1941
Does Functional Parameters from Gadoxetic Acid–enhanced MRI Predict Decompensation in Cirrhosis?1Affiliated Nantong Hospital 3 of Nantong University, Nantong, China, 2Philips Healthcare, Shanghai, China
Synopsis
We used Look-Locker sequences to acquire T1 mapping images pre and post-contrast at 20 minutes after gadoxetic acid administration. Liver-to-spleen contrast index (LSI), contrast uptake index (CUI), relative liver enhancement (RLE), hepatocyte fraction (HeF), T1 relaxation times on unenhanced phase (T1unenh), T1 relaxation times on hepatobiliary phase (T1HBP), reduction rates of T1 relaxation times (rrT1), and the functional liver imaging score (FLIS) of the liver were measured and calculated by two radiologists independently. Our study showed that LSI, CUI, HeF, T1HBP, rrT1 and FLIS based on gadoxetic acid–enhanced MRI are help for the evaluation of liver function.
INTRODUCTION
Assessment of the liver function is an essential procedure for preventing hepatic failure and for the medical management of patients with hepatic dysfunction. Gadoxetic acid is a hepatocyte-specific contrast agent for MRI of the liver, and uptake and metabolism of gadoxetic acid is related to hepatocyte function. The clinical grading systems such as the Albumin-Bilirubin ratio (ALBI) score, the Child-Turcotte-Pugh (CTP) score, the Model of End-Stage Liver Disease (MELD) score and the indocyanine green retention rate at 15 min (ICG R15) are used to determine liver function and used for treatment decision-making.PURPOSE
To investigate whether the functional parameters from gadoxetic acid–enhanced MRI can predict decompensation in cirrhosis.METHODS
This retrospective study included 77 cirrhotic patients (62 men and 15 women), divided into compensated advanced chronic liver disease (CACLD) group and decompensated advanced chronic liver disease (DACLD) group. All patients were performed non-enhanced and gadoxetic acid–enhanced MRI of liver, hepatobiliary phases were obtained 19 min after the injection of gadoxetic acid. Look-Locker sequences were performed pre and post-contrast at 20 minutes after gadoxetic acid administration. Liver-to-spleen contrast index (LSI), contrast uptake index (CUI), relative liver enhancement (RLE), hepatocyte fraction (HeF), T1 relaxation times on unenhanced (T1unenh) and hepatobiliary phase (T1HBP), reduction rates of T1 relaxation times (rrT1), and the functional liver imaging score (FLIS) of the liver were measured and calculated by two radiologists independently, with four regions of interest (ROIs) separately placed in both lobes of the liver. The serum biochemistry markers were collected to calculated clinical grading systems (ALBI score, CTP score, MELD score and ICG R15). Interreader agreement was evaluated by using intraclass correlation coefficient (ICC). Independent samples t test and Mann-Whitney U test were performed to compare MRI parameters and clinical parameters between CACLD and DACLD groups. Associations between MRI parameters and clinical parameters were investigated using Pearson’s correlation coefficient or Spearman’s correlation coefficient. ROC analyses were done to differentiate the diagnostic performance of MRI parameters and clinical parameters between CACLD and DACLD groups.The MRI parameters and clinical grading systems were calculated using the following formulas1-5:LSI = SILiver HBP/ SISpleen HBP
CUI = LMRHBP/ LMRunenh LMR = SILiver / SIparespinal muscle
RLE = ( SILiver HBP - SILiver unenh ) / SILiver unenh
R1(t) = 1 / T1(t) t: time after contrast injection (min) ΔR1 = [ R1(t) - R1(0) ]
Hepatocyte fraction (HeF) = ΔR1Hepatobilitary / (ΔR1Hepatobilitary+ΔR1BloodEES)
rrT1 = (T1unenh - T1HBP) / T1unenh
FLIS = Liver parenchymal enhancement quality score (EnQS) + Portal vein sign quality score (PVsQS) + Biliary contrast excretion quality score (ExQS)
ALBI score = (log10 bilirubin × 0.66) + (albumin × -0.085)
MELD score = 10 × [0.957 × ln (creatinine) + 0.378 × ln (bilirubin) + 1.12 × ln (INR)] + 0.643
RESULTS
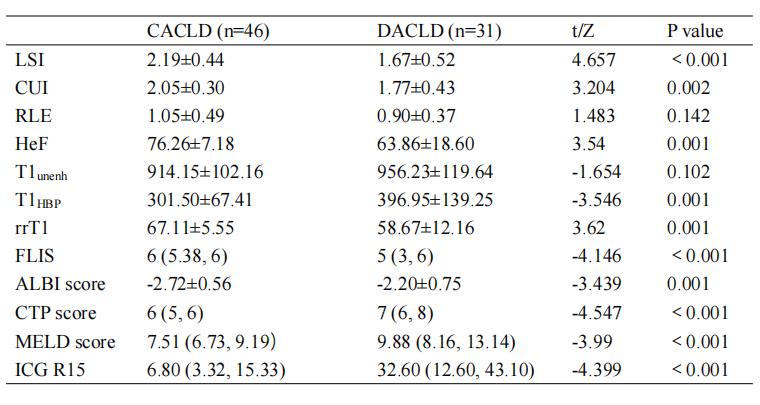
1. ICC of the two reviewers with the gadoxetic acid-enhanced MRI parameters (LSI, CUI, RLE, HeF, T1unenh, T1HBP, rrT1 and FLIS) ranged from 0.933 for CUI to 0.993 for HeF, as shown in Table 1.2. Comparison of the gadoxetic acid-enhanced MRI parameters and clinical parameters between CACLD and DACLD groups were shown in Table 2. There were significantly differences (P<0.05) in all MRI parameters and clinical parameters between CACLD and DACLD groups except RLE and T1unenh.
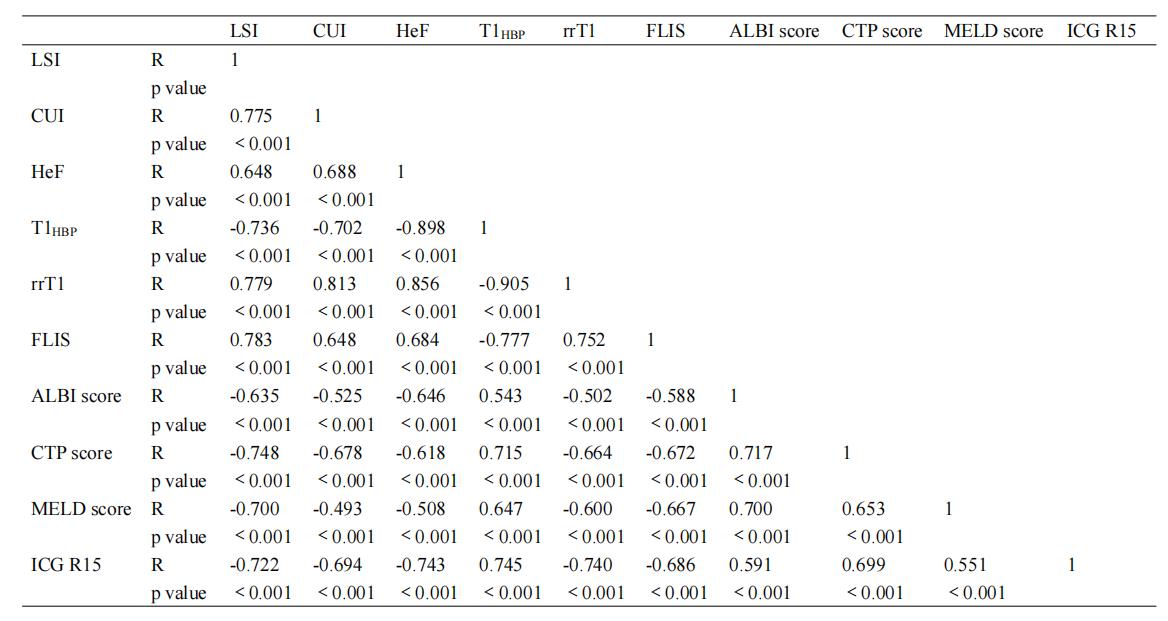
3. Correlation between MR parameters and clinical parameters were shown in Table 3. MR parameters (LSI, CUI, HeF, T1HBP, rrT1 and FLIS) correlated significantly (P<0.05) with clinical parameters (ALBI score, CTP score, MELD score and ICG R15).
4. The diagnostic performance for MR parameters and clinical parameters to evaluate DACLD group were shown in Table 4. MR parameters and clinical parameters were able to discriminate patients with CACLD group versus DACLD group, with AUC values ranging from 0.705 for HeF to 0.797 for ICG R15. There were no significant difference among these parameters (P>0.05).
DISCUSSION
Gadoxetic acid can be specifically taken up by hepatocytes and excreted through the biliary tract. The intracellular transport mechanisms of gadoxetic acid are mediated by organic anion-transporting polypeptide 1 (OATP1). The reduced gadoxetic acid uptake may be either due to a decreased number of normal hepatocytes in cirrhotic liver or due to decreased expression of OATP1 or diminished OATP1 activity on the surface of hepatocytes6-7. Previous study showed that the MRI functional parameters from gadoxetic acid–enhanced which were simple to obtain and simple to calculate were useful for the staging of liver function. Our study showed that the ICCs ranged from 0.933 for CUI to 0.993 for HeF, and the interreader agreements of all MRI parameters were almost perfect. The study demonstrated that LSI, CUI, HeF, T1HBP, rrT1, FLIS, ALBI score, CTP score, MELD score and ICG R15 were significantly different between CACLD and DACLD groups. The correction coefficients between MRI parameters and clinical parameters were moderate and high. The majority of MR parameters and all clinical parameters were able to discriminate patients with CACLD group versus DACLD group, with AUC values ranging from 0.705 for HeF to 0.797 for ICG R15. MELD score had the highest sensitivity, and FLIS had the highest specificity.CONCLUSIONS
The functional parameters from gadoxetic acid–enhanced MRI can predict decompensation in cirrhosis. MRI parameters are help for the evaluation of chronic liver disease patients in clinical practice.Acknowledgements
No acknowledgement found.References
[1] Katsube T, Okada M, Kumano S, et al. Estimation of liver function using T1 mapping on Gd-EOB-DTPA-enhanced magnetic resonance imaging[J]. Invest Radiol, 2011, 46(4): 277-283.
[2] Poetter-Lang S, Bastati N, Messner A, et al. Quantification of liver function using gadoxetic acid-enhanced MRI[J]. Abdom Radiol, 2020, 45(11): 3532-3544.
[3] Beer L, Mandorfer M, Bastati N, et al. Inter- and intra-reader agreement for gadoxetic acid-enhanced MRI parameter readings in patients with chronic liver diseases[J]. Eur Radiol, 2019, 29(12): 6600-6610.
[4] Bastati N, Beer L, Mandorfer M, et al. Does the Functional Liver Imaging Score Derived from Gadoxetic Acid-enhanced MRI Predict Outcomes in Chronic Liver Disease?[J]. Radiology, 2020, 294(1): 98-107.
[5] Lee HJ, Hong SB, Lee NK, et al. Validation of functional liver imaging scores (FLIS) derived from gadoxetic acid-enhanced MRI in patients with chronic liver disease and liver cirrhosis: the relationship between Child-Pugh score and FLIS[J]. Eur Radiol. 2021, 31(11): 8606-8614.
[6] Tsuda N, Harada K, Matsui O. Effect of change in transporter expression on gadolinium-ethoxybenzyl-diethylene triamine pentaacetic acid-enhanced magnetic resonance imaging during hepatocarcinogenesis in rats[J]. J Gastroenterol Hepatol, 2011, 26(3): 568-576.
[7] Ba-Ssalamah A, Bastati N, Wibmer A, et al. Hepatic gadoxetic acid uptake as a measure of diffuse liver disease: Where are we? [J]. J Magn. Reson. Imaging, 2017, 45(3): 646-659.
Figures