1939
The value of diffusion kurtosis imaging texture analysis in predicting treatment response to transcatheter arterial chemoembolization in HCC1the First Affiliated Hospital of Dalian Medical University, DaLian, China, 2Philips Healthcare, BeiJing, China
Synopsis
This work aimed at texture analysis based on mean apparent diffusion coefficient (MD) of diffusion kurtosis imaging (DKI) to evaluate the treatment efficacy of transcatheter arterial chemoembolization (TACE) in hepatocellular carcinoma (HCC). The results showed that MD texture features can differentiate objective response and non-response groups. When using the single parameter, the GreyLevelNonuniformity_angle135_offset1 achieved the best result (AUC: 0.714, sensitivity: 68.2%, specificity: 81%). In the combined diagnosis of multiple parameters, FrequencySize,MaxIntensity, GreyLevelNonuniformity_angle0_offset1 and GreyLevelNonuniformity_angle135_offset1 were combined to obtain the best combined diagnosis(AUC:0.760,sensitivity: 81.8%, specificity: 66.7%).
Synopsis
This work aimed at texture analysis based on mean apparent diffusion coefficient (MD) of diffusion kurtosis imaging (DKI) to evaluate the treatment efficacy of transcatheter arterial chemoembolization (TACE) in hepatocellular carcinoma (HCC). The results showed that MD texture features can differentiate objective response and non-response groups. When using the single parameter, the GreyLevelNonuniformity_angle135_offset1 achieved the best result (AUC: 0.714, sensitivity: 68.2%, specificity: 81%). In the combined diagnosis of multiple parameters, FrequencySize,MaxIntensity, GreyLevelNonuniformity_angle0_offset1 and GreyLevelNonuniformity_angle135_offset1 were combined to obtain the best combined diagnosis(AUC:0.760,sensitivity: 81.8%, specificity: 66.7%).Purpose
To investigate the value of texture analysis of the mean apparent diffusion coefficient (MD) of diffusion kurtosis imaging (DKI) in predicting the treatment efficacy of transcatheter arterial chemoembolization (TACE) in hepatocellular carcinoma (HCC).Introduction
Hepatocellular carcinoma (HCC) is the sixth most common malignant tumor in the world, and its fatality rate ranks third in the world [1]. Transcatheter arterial chemoembolization (TACE) has been recommended as the important treatment for HCC patients with BCLC B stage. Previous studies have demonstrated that tumors were not necessarily shrinken when they responded to the treatment. It is worth noted that some tumors respond obviously to the treatment, but there is no significant change in their size [2-3]. Therefore, the traditional morphological imaging can not evaluate the efficacy of TACE in the early stage of treatment, which is not conducive to the formulation and modification of the treatment planning. MR functional imaging technology, represented by diffusion weighted imaging (DWI), diffusion kurtosis imaging (DKI) and Intravoxel incoherent motion (IVIM), which reflects the changes of biological microstructure, has become a research hotspot. There have been some studies in quantitative evaluation of therapeutic effect of TACE using MR functional imaging [4-6]. However, there were few studies using DKI texture analysis to evaluate the response. We hypothesize that it’s feasible to evaluate the tumor response of TACE in HCC using DKI texture features.Materials and Methods
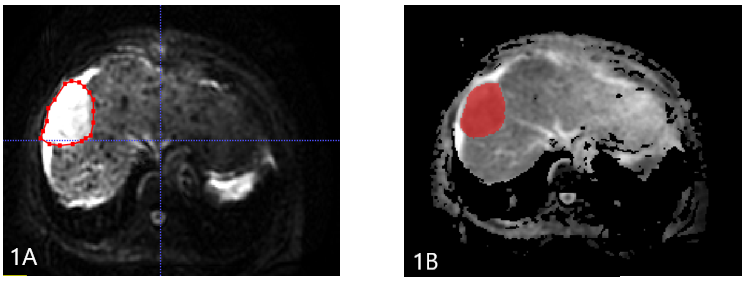
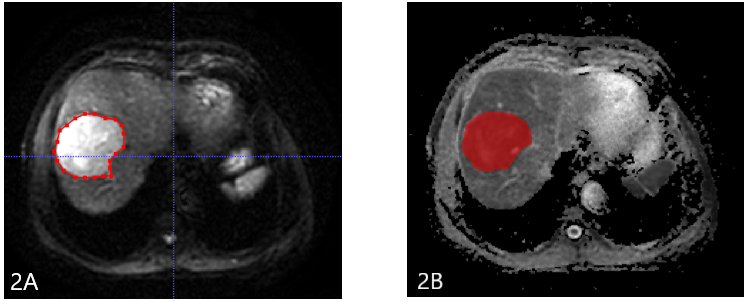
The present study retrospectively enrolled 43 patients with HCC (33 males , 10 females;median age ,60 years;range,41-77 years.) confirmed by clinical or pathological diagnosis who were scheduled to undergo the first TACE treatment.. All patients underwent abdominal MRI examination (GE healthcare, USA), including routine scanningsequences (T1WI, T2WI, and contrast-enhanced MR imaging) and additional DKI sequence (b value=0, 1000 (s/mm2)). Patients received MRI examination again within 3 months after TACE treatment. According to mRESICT criteria, the treatment response was divided into complete response (CR), partial response (PR), stable disease (SD), and progress disease (PD). CR and PR were defined as objective reponse (OR) group (n =21 ), SD and PD were defined as non-reponse (NR) group (n = 22). DKI images were transferred to the GE AW 4.6 workstation, and the MD map were imported into ITK-SNAP software. The radiologist reviewed the MR images and manually outlined the region of interests (ROIs) on each slice of the lesion on MD signal intensity map (Figure 1 and 2), and three-dimensional volume of interest (3D-VOI) was generated. The AK software (GE Healthcare) was used to extract texture features, including FrequencySize, MaxIntensity, MeanDeviation, MeanValue, MedianIntensit, MinIntensity, RelativeDeviation, histogramEnergy, histogramEntropy, kurtosis, skewness, stdDeviation, uniformity, GreyLevelNonuniformity_AllDirection_offset1, GreyLevelNonuniformity_AllDirection_offset1_SD, GreyLevelNonuniformity_angle0_offset1, GreyLevelNonuniformity_angle135_offset1, GreyLevelNonuniformity_angle45_offset1, and GreyLevelNonuniformity_angle90_offset1. Data analyses were performed using SPSS19.0 statistical software. Independent sample t test or Mann-Whitney U test was used to compare the difference of texture features between the OR and NR groups. Diagnostic performance was evaluated by receiver operating characteristic (ROC) analysis. Logistic regression was used to combine several features with better performance in MD texture features.Results
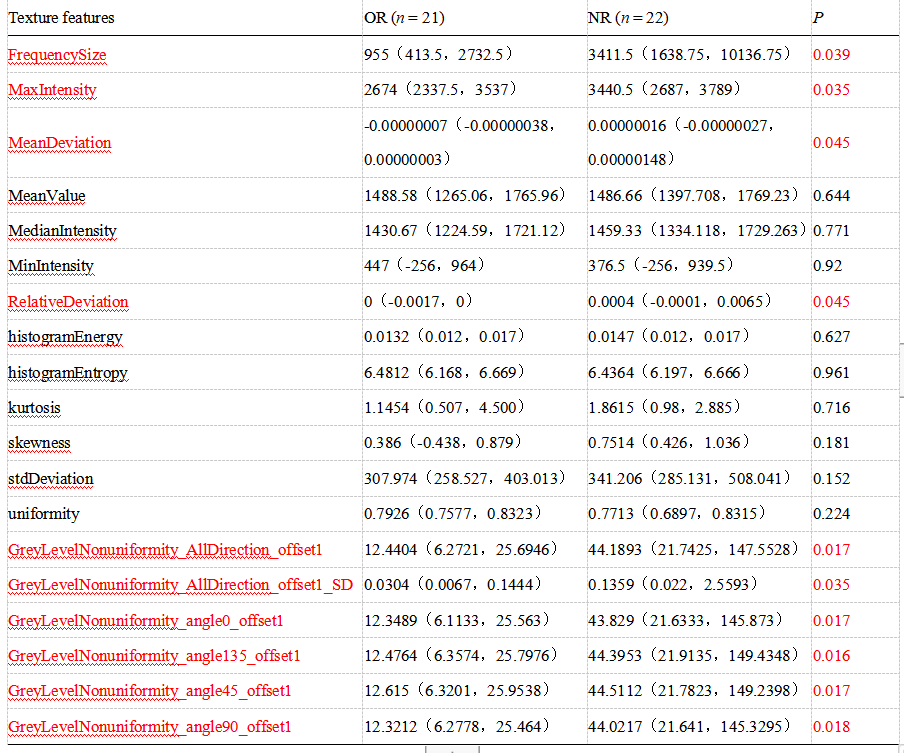
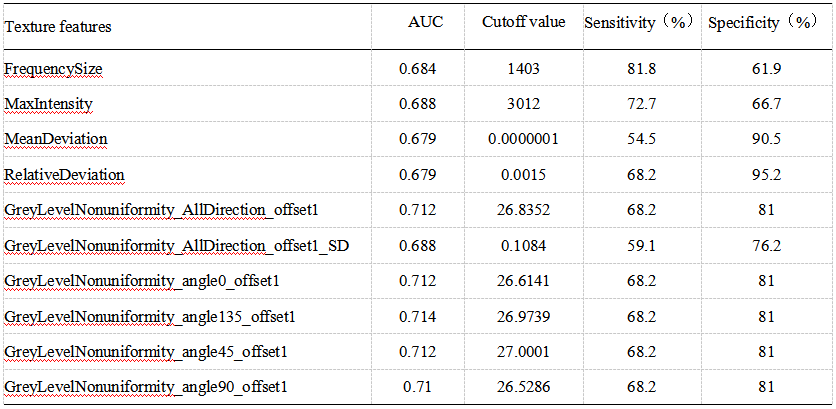
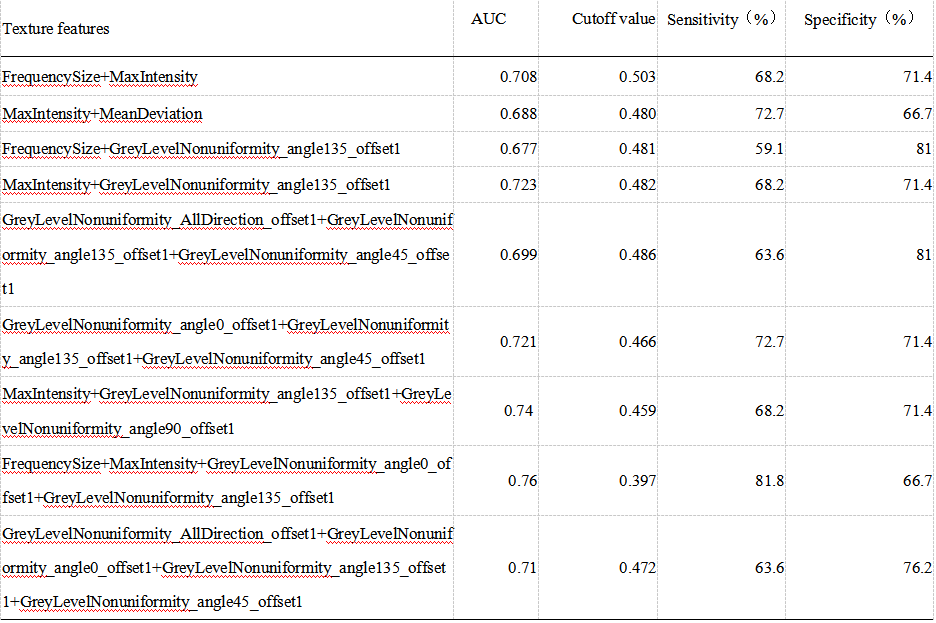
There were significant differences of FrequencySize,MaxIntensity, MeanDeviation, RalativeDeviation, GreyLevelNonuniformity_AllDirection_offset1, GreyLevelNonuniformity_AllDirection_offset1_SD, GreyLevelNonuniformity_angle0_offset1, GreyLevelNonuniformity_angle135_offset1, GreyLevelNonuniformity_angle45_offset1, and GreyLevelNonuniformity_angle90_offset1 on MD signal intensity map between the OR and NR groups (P < 0.05, Table 1). The remaining parameters were not statistically different (P > 0.05). When using the single parameter, the GreyLevelNonuniformity_angle135_offset1 achieved the best result (AUC: 0.714, sensitivity: 68.2%, specificity: 81%, shown in Table 2). In the combined diagnosis of multiple parameters, FrequencySize, MaxIntensity, GreyLevelNonuniformity_angle0_offset1 and GreyLevelNonuniformity_angle135_offset1 were combined to obtain the best combined diagnosis(AUC:0.76,sensitivity: 81.8%, specificity: 66.7%, shown in Table 3).Discussion and Conclusion
The TACE significantly improves survival in patients with HCC and is the treatment of choice for patients unsuitable for surgical resection. The evaluation of the response to TACE treatment not only affects the assessment of treatment effect, but also influences the development of subsequent treatment planning. Conventional T1WI and T2WI do not reflect the heterogeneity of the tumor well, which is not conducive to the development and modification of treatment plans. Magnetic resonance functional imaging techniques represented by diffusion-weighted imaging (DWI), diffusion kurtosis imaging (DKI) and intra-voxel incoherent motion (IVIM) can reflect changes in biological microstructure and can detect poor prognosis. In the current study, we proposed a DKI-based texture strategy to evaluate the treatment effect of TACE in HCC, which will provide guidance for treatment planning.Acknowledgements
No acknowledgement found.References
[1] Forner Alejandro,Reig María,Bruix Jordi,Hepatocellular carcinoma.[J] .Lancet, 2018, 391: 1301-1314.
[2] Yang Lin,Zhang Xiao-ming,Tan Bang-xian et al. Computed tomographic perfusion imaging for the therapeutic response of chemoembolization for hepatocellular carcinoma.[J] .J Comput Assist Tomogr, 2012, 36: 226-30.
[3] Kamel Ihab R,Liapi Eleni,Reyes Diane K et al. Unresectable hepatocellular carcinoma: serial early vascular and cellular changes after transarterial chemoembolization as detected with MR imaging.[J] .Radiology, 2009, 250: 466-73.
[4] Shirota Natsuhiko,Saito Kazuhiro,Sugimoto Katsutoshi et al. Intravoxel incoherent motion MRI as a biomarker of sorafenib treatment for advanced hepatocellular carcinoma: a pilot study.[J] .Cancer Imaging, 2016, 16: 1.
[5] Gluskin Jill S,Chegai Fabrizio,Monti Serena et al. Hepatocellular Carcinoma and Diffusion-Weighted MRI: Detection and Evaluation of Treatment Response.[J] .J Cancer, 2016, 7: 1565-70.
[6] Bonekamp Susanne,Jolepalem Prashant,Lazo Mariana et al. Hepatocellular carcinoma: response to TACE assessed with semiautomated volumetric and functional analysis of diffusion-weighted and contrast-enhanced MR imaging data.[J] .Radiology, 2011, 260: 752-61.
Figures