1937
SENSE and Compressed SENSE chemical shift encoded multi-gradient echo for T2* quantification in the liver1Institute of Biomedical Engineering, University of Oxford, Oxford, United Kingdom, 2Perspectum Ltd, Oxford, United Kingdom, 3SingHealth Polyclinic - Bedok, Singapore, Singapore, 4SingHealth Polyclinic - Sengkang, Singapore, Singapore, 5SingHealth Polyclinic - Tampines, Singapore, Singapore, 6Department of Gastroenterology and Hepatology, Singapore General Hospital, Singapore, Singapore, 7Division of Gastroenterology and Hepatology, National University Hospital, Singapore, Singapore, 8Department of Gastroenterology and Hepatology, Sengkang General Hospital, Singapore, Singapore, 9SingHealth Polyclinic - Outram, Singapore, Singapore, 10SingHealth Polyclinic - Bukit Merah, Singapore, Singapore, 11SingHealth Polyclinic - Marine Parade, Singapore, Singapore, 12SingHealth Polyclinic - Pasir Ris, Singapore, Singapore, 13Division of Medical Oncology, National Cancer Centre Singapore, Singapore, Singapore, 14Department of Gastroenterology & Hepatology, Changi General Hospital, Singapore, Singapore, 15Duke-NUS Medical School, Singapore, Singapore, 16Gastroenterology and Hepatology, Tan Tock Seng Hospital, Singapore, Singapore, 17SingHealth Polyclinic - Punggol, Singapore, Singapore, 18Division of Surgery and Surgical Oncology, National Cancer Centre Singapore, Singapore, Singapore, 19Department of Hepato-pancreato-biliary and Transplant Surgery, Singapore General Hospital and National Cancer Centre Singapore, Singapore, Singapore, 20Surgery Academic Clinical Programme, Duke-NUS Medical School, Singapore, Singapore
Synopsis
T2*, measured using 3D breath-hold chemical shift encoded multi-gradient echo can be used to estimate liver iron concentration. The breath-hold duration (typically 10-20 s) with traditional parallel imaging acceleration techniques such as Sensitivity Encoding (SENSE) can be difficult for patients. Compressed SENSE (C-SENSE) can be used to decrease acquisition time. We compare T2* obtained with SENSE and C-SENSE in 21 patients. We found that C-SENSE acquisition was faster (9 s vs 18 s), with strong correlation and agreement with SENSE. Our findings suggest C-SENSE may potentially improve patient tolerance and turnover speed for T2* acquisitions when compared to SENSE.
Introduction
Measurement of T2* is increasingly used to estimate liver iron concentration 1–3. This has typically been used to monitor patients with severe iron overload, though it has far wider application. For example, patients with cirrhosis who have even mild iron overload may be at greater risk of hepatocellular carcinoma (HCC) 4,5. Again, measurement of iron sparing could be useful in detection and characterisation of HCC 6. 3D chemical shift encoded (CSE) multi-gradient echo (GRE) sequences are increasingly used for T2* quantification. This is particularly important in the cases of cirrhosis and HCC detection, where iron distribution can be heterogenous, such heterogeneity being clinically significant, and where HCCs can be located anywhere in the liver. However, 3D techniques necessitate longer breath-holds, particularly when the echo train is long. This is important for quantification of longer T2* associated with the lower iron found in cirrhotic patients and in HCC, compared to patients with extreme iron overload. To shorten the acquisition time, compressed sensing can be used. However, prior to routine clinical deployment it is important to demonstrate that the T2* measurements resulting from compressed sensing are equivalent to those given with conventional parallel imaging techniques. A study by Boyarko et al. in children and young adults showed only a moderate correlation between T2* measurements given with Sensitivity Encoding, SENSE (Philips product parallel imaging) and Compressed SENSE (C-SENSE, Philips product compressed sensing) 7. In this study we compare results from SENSE and C- SENSE in a population at increased risk of HCC, as a further investigation into whether compressed sensing can be used for faster imaging in the clinic in T2* acquisitions.Methods
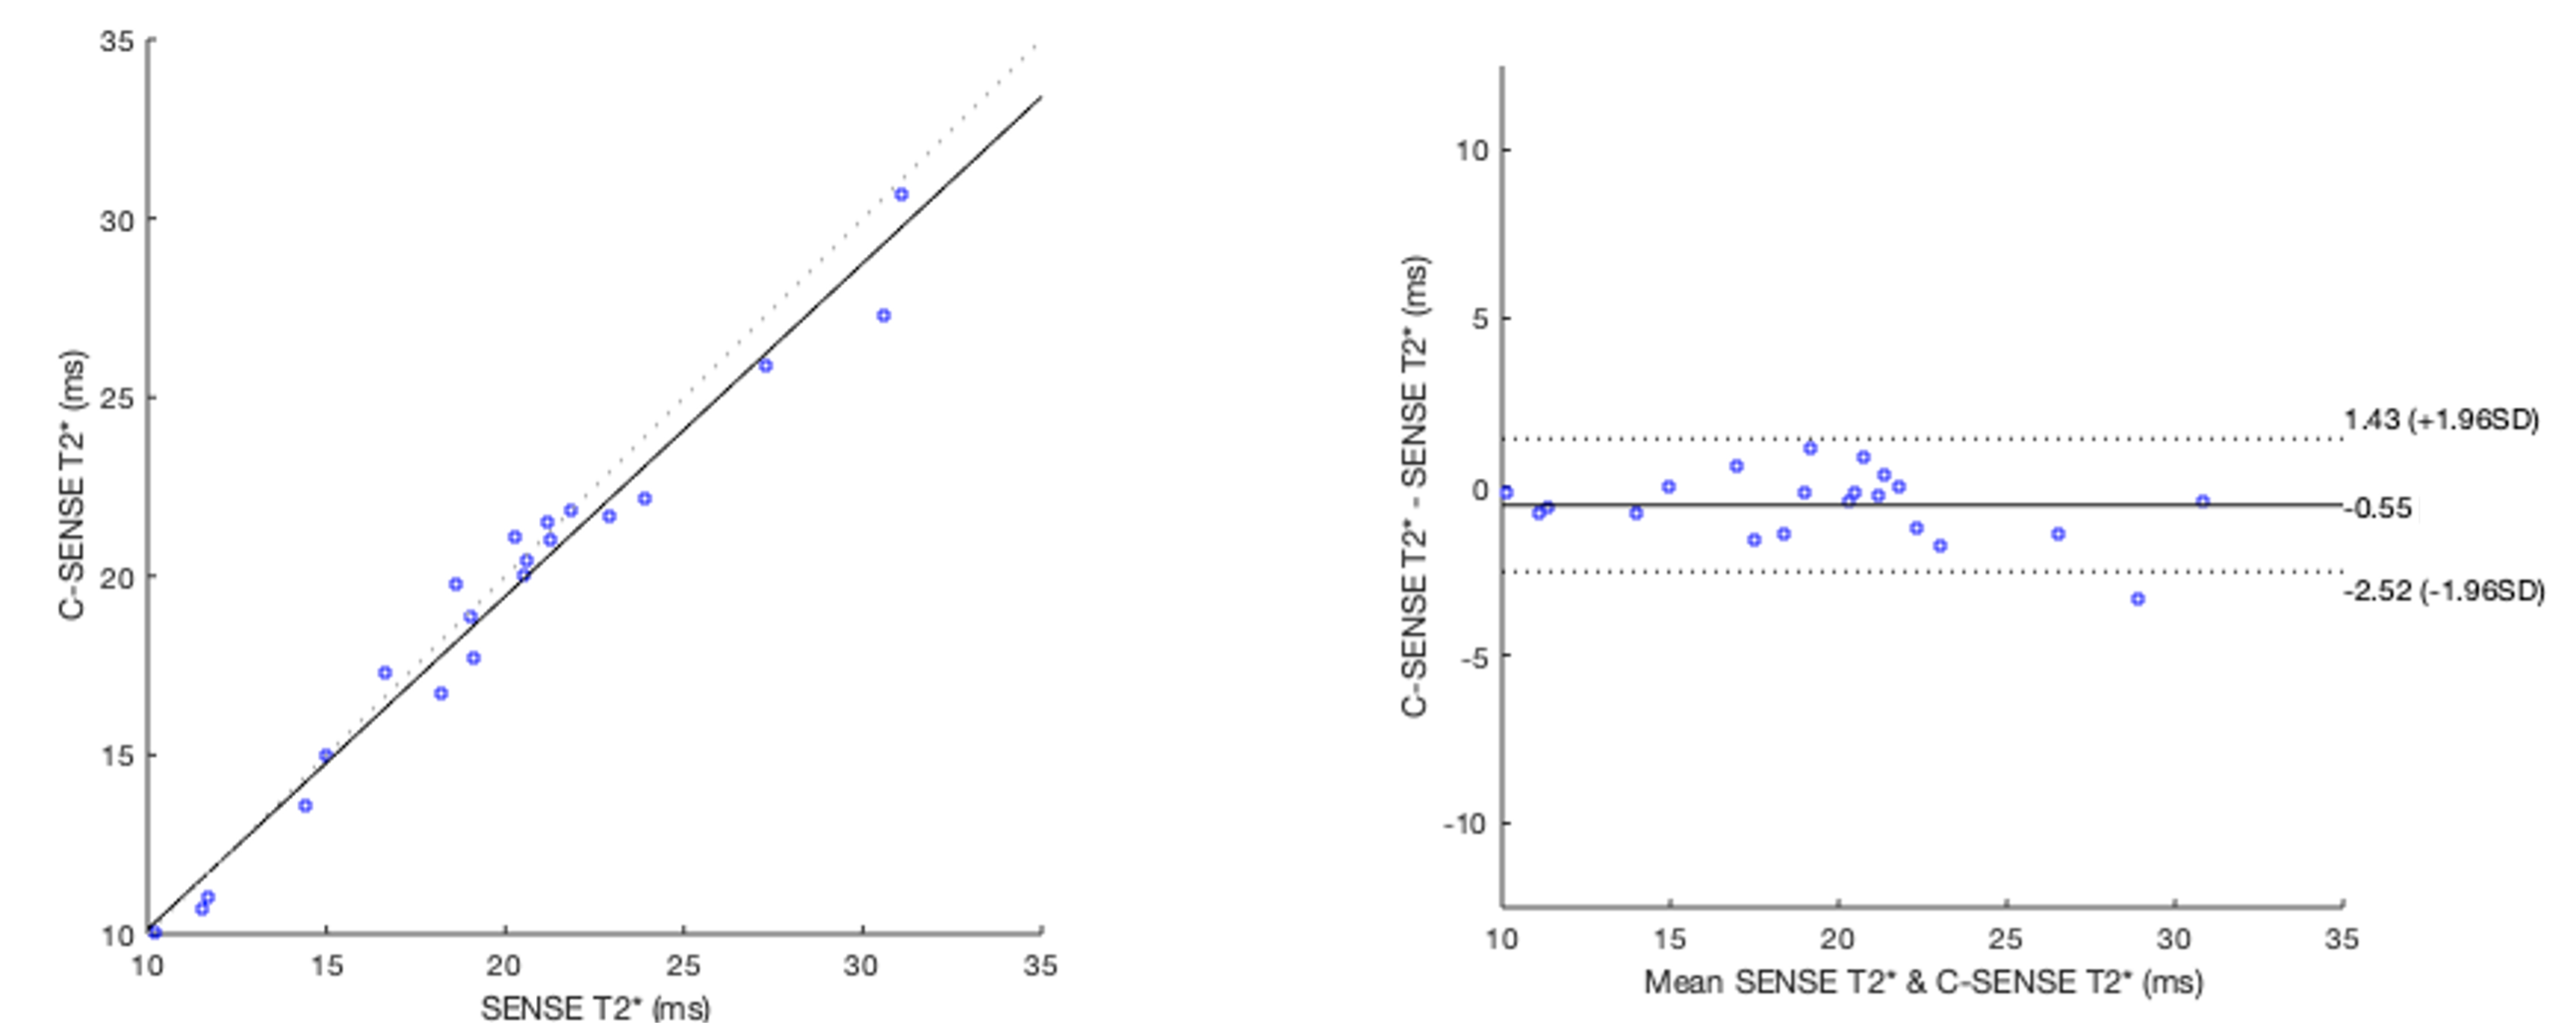
The ELEGANCE Study is an investigator-initiated multi-centre, longitudinal cohort study of patients at increased risk of HCC in Singapore (ClinicalTrials.gov: NCT04965259) under the auspices of the Asia-Pacific Hepatocellular Carcinoma (AHCC) Trials Group. 21 patients at increased risk of HCC (14 with Hepatitis B virus (HBV) and no cirrhosis, 7 with cirrhosis of any aetiology) were scanned on a Philips Achieva 3 T scanner with a modified version of the mDixon Quant sequence (Philips Product 3D CSE multi-GRE sequence. 12 echoes: TE1 = 1 ms, delta TE: 0.7 ms). One acquisition was with SENSE factor 2, the other with Compressed SENSE factor 4.5, with acquisition length of 18 s and 9 s respectively. T2* maps were calculated using the MAGO method 8. Three circular 15 mm diameter ROIs were placed on the liver on the SENSE T2* map, avoiding vessels, and these were copied to the Compressed SENSE map. The median T2* from the ROIs on the SENSE and C-SENSE map for each patient were plotted in a scatter graph. Correlation and agreement were calculated using Spearman’s Rank Correlation Coefficient and intraclass correlation coefficient (ICC) respectively. A Bland-Altman plot was used to assess mean bias and 95% limits of agreement.Results
The scatter plot and Bland-Altman plot are shown in Figure 1. Spearman’s Rank Correlation coefficient was 0.98 (p<0.001) and ICC was 0.98. Mean bias was -0.55 ms and limits of agreement -2.52 ms and 1.43 ms.Discussion
We found close agreement between the acquisitions with SENSE and C-SENSE, with a small mean bias and tight limits of agreement. This contrasts with the results reported by Boyarko et al 7. In that study the Spearman’s rank correlation coefficient was 0.53, p = 0.001, between T2* measurements given with SENSE factor 2 and C-SENSE factor 6 7. Additionally there was a -3 ms bias of C-SENSE compared with SENSE, with relatively wide limits of agreement(-12.0, 6 ms) 7. One reason for the difference to the current study was that in Boyarko’s study the SENSE calibration data was used for the C-SENSE acquisition, and the motion between the calibration scan and C-SENSE acquisition may have been the cause of artifacts in the image, which would have impacted the T2* measurements. In the current study a new calibration scan was performed directly before the C-SENSE acquisition. Other potential reasons for the difference include the lower C-SENSE factor, the higher number of echoes and the different patient group in the current study.Conclusion
This study shows that T2* measured using a 3D multi-GRE CSE sequence with C-SENSE are in close agreement with the same sequence with SENSE in a population at risk of HCC. It is therefore likely that C-SENSE can be used to speed up a 3D multi-GRE CSE in the clinical setting. However, given that this conflicts with results from a previous study, more results are needed to further validate this and to help identify any potential causes of C-SENSE causing a difference in T2* measurements compared to SENSE.Acknowledgements
This project was supported by an Industrial Fellowship from the Royal Commission for the Exhibition of 1851.
The ELEGANCE Study (AHCC10) is supported by a Singapore Government scientific funding agency, A*Star under its Industry Alignment Fund – Industry Collaboration Projects (IAF–ICP) programme and co-supported by MiRXES Pte Ltd, Perspectum Asia Pte Ltd and AMILI Pte Ltd through NCCS Cancer Fund. Any opinions, findings and conclusions or recommendations expressed in this material are those of the author(s) and do not reflect the views of the A*STAR.
References
1. Wood JC, Enriquez C, Ghugre N, et al. MRI R2 and R2* mapping accurately estimates hepatic iron concentration in transfusion-dependent thalassemia and sickle cell disease patients. Blood. 2005;106(4):1460-1465.
2. Hankins JS, McCarville MB, Loeffler RB, et al. R2* magnetic resonance imaging of the liver in patients with iron overload. Blood. 2009;113(20):4853-4855.
3. Garbowski MW, Carpenter JP, Smith G, et al. Biopsy-based calibration of T2* magnetic resonance for estimation of liver iron concentration and comparison with R2 Ferriscan. J Cardiovasc Magn Reson. 2014;16(1):1-11.
4. Sorrentino P, D’Angelo S, Ferbo U, et al. Liver iron excess in patients with hepatocellular carcinoma developed on non-alcoholic steato-hepatitis. J Hepatol. 2009;50(2):351-357.
5. Corradini E, Pietrangelo A. Iron and steatohepatitis. J Gastroenterol Hepatol. 2012;27(SUPPL.2):42-46.
6. Choi JY, Lee JM, Sirlin CB. CT and MR imaging diagnosis and staging of hepatocellular carcinoma: Part I. Development, growth, and spread: Key pathologic and imaging aspects. Radiology. 2014;272(3):635-654.
7. Boyarko AC, Dillman JR, Tkach JA, et al. Comparison of compressed SENSE and SENSE for quantitative liver MRI in children and young adults. Abdom Radiol. 2021;46(10):4567-4575.
8. Triay Bagur A, Hutton C, Irving B, et al. Magnitude-intrinsic water–fat ambiguity can be resolved with multipeak fat modeling and a multipoint search method. Magn Reson Med. 2019;82(1):460-475.
Figures