1933
A Graph Theoretical Approach for Lateralization of Temporal Lobe Epilepsy Using Nodal Functional Connectivity
Alireza Fallahi 1, Mohammad Pooyan2, Jafar Mehvari-Habibabadi 3, Narges Hoseini Tabatabaei4, Mohammadreza Ay1,5, and Mohammad-Reza Nazem-Zadeh1,5
1Research Center for Molecular and Cellular Imaging, Tehran University of Medical Sciences, Tehran, Iran (Islamic Republic of), 2Biomedical Engineering, Shahed University, Tehran, Iran (Islamic Republic of), 3Isfahan Neuroscience Research Center, Isfahan University of Medical Sciences, Isfahan, Iran (Islamic Republic of), 4Medical School, Tehran University of Medical Sciences, Tehran, Iran (Islamic Republic of), 5Medical Physics and Biomedical Engineering, Tehran University of Medical Sciences, Tehran, Iran (Islamic Republic of)
1Research Center for Molecular and Cellular Imaging, Tehran University of Medical Sciences, Tehran, Iran (Islamic Republic of), 2Biomedical Engineering, Shahed University, Tehran, Iran (Islamic Republic of), 3Isfahan Neuroscience Research Center, Isfahan University of Medical Sciences, Isfahan, Iran (Islamic Republic of), 4Medical School, Tehran University of Medical Sciences, Tehran, Iran (Islamic Republic of), 5Medical Physics and Biomedical Engineering, Tehran University of Medical Sciences, Tehran, Iran (Islamic Republic of)
Synopsis
In this study, six graph theoretical measures were identified as nodal level epileptogenicity in TLE patients using functional connectivity analysis. The aim of this study is to define brain nodes that have significant difference between left and right TLE patients using resting state functional connectivity analysis. Clustering coefficient, degree centrality, betweenness centrality, node neighbor’s degree, closeness centrality, and page rank were calculated as graph theoretical characteristics and multi-dimensional scaling (MDS) was used as a statistical method. Results of the applied method suggested significant nodes for prediction of laterality in TLE patients.
Introduction
Temporal lobe epilepsy (TLE) is the most frequent type of focal epilepsy in adults and also the most common pharmacoresistant epilepsy accountable for surgical treatment. However, surgery is not possible in about 30% of TLE patients due to a lack of clear localizing abnormality1,2 . In recent studies, different patterns of functional connectivity have been identified between left and right TLE, including redistribution of global functional activation in left TLE and functional impairments in right TLE 4,5,6 . Recently, some studies have reported discrepant results provided by graph theoretical method for functional connectivity. Clustering coefficient and characteristic path length, for instance, have shown different trends, either an increase, a decrease, or a no-change, altogether, in patients with epilepsy compared to controls 3,7 . Furthermore, the temporal instability in some topological characteristics has inspired the investigations to capture the topology of particular functional network configurations. In this study, we aimed to use some graph theoretical characteristics for analyzing resting state fMRI and characterizing the nodal level differences between the left and right TLE patients.Material and Methods
We studied 35 unilateral patients with left or right temporal lobe epilepsy. Twenty-one patients had left TLE and 14 patients had right TLE (19 females, 21 men; age range: 17-54; mean age 30.4 yrs). Patients with disabling cognitive impairment or other patients with other neurological disease were excluded. We asked from all subjects to relax, close their eyes without sleeping and think nothing in particular. MRI data were collected using a 3-Tesla scanner (Siemens Prisma, Erlangen, Germany) at National Brain Mapping Laboratory (NMBL) in Iran. Anatomic images were acquired for clinical diagnosis including transverse T1 weighted images (TR = 1840 ms, TE = 3.47 ms, matrix = 256 256, slice thickness = 1.0 mm). Functional images covering the whole brain were acquired transverse using an echo planar imaging sequence (TR = 3000 ms, TE = 30 ms, flip angle = 90, matrix = 640 640; 2.4mm thickness and 2.4 mm gap). For each subject, the duration of each fMRI measurements was approximately 10 minutes, and 330 volumes were obtained for each patient. For each subject, the first 10 volumes were discarded. The remaining 320 volumes were first corrected for the differences in image acquisition time between slices, and then realigned to the middle volume for head-motion correction. Head motion parameters were computed by estimating translation in each direction and angular rotation on each axis for all 320 volumes. Participants with head motion greater than 3 mm or 3 degrees in any of the six parameters were excluded. The realigned functional volumes were then spatially normalized to the MNI space using the normalization parameters estimated by T1 structural image (voxel size [3, 3, 3]). Then, the datasets were smoothed using Gaussian kernel (FWHM = 8 mm), detrended to remove linear trends, and temporally filtered (0.01– 0.08 Hz) to decrease the effect of low-frequency drifts. The images were segmented into 90 anatomical Region of interests (ROIs) using Automated Anatomical Labeling (AAL) atlas 8,9 to extract the ROIs time-series. In each ROI the mean time series of all voxels was considered as a ROI time series. We calculated functional connectivity using the Pearson correlation coefficient between each pair of ROI time courses representing brain regional activity. For graph theoretical analysis we considered the graph with 90 nodes. We applied a threshold on functional connectivity matrix; the edges that were upper than the threshold remained as a substantial link between nodes, and considered unweighted and undirected. We tested different values of proportional threshold and the value of 0.8 showed the most robust results. Therefore, we chose clustering coefficient and focused on centrality measures including degree centrality, betweenness centrality, node neighbor’s degree, closeness centrality, and page rank. Multi-dimensional scaling (MDS) method was used to explore similarities between individuals based on selected nodes. We considered those nodes selected more than 300 times over 1000 repetitions using the Lasso method.Results
Fig.1 shows the selected nodes and the related networks. The clustering coefficient, betweenness centrality and closeness centrality, were represented for the selected nodes in sensory motor, default mode, attention, visual and subcortical networks. The other graph measures (degree centrality node neighbor degree and page rank) were not represented for the selected nodes. Fig. 2 shows the significantly different nodes between left and right TLE groups.Conclusion
In this work, we identified major differences in cognitive networks using graph theoretical analysis of functional connectivity in resting state fMRI data of TLE patients. We found that graph theoretical measures of clustering coefficient and betweenness centrality in some brain network nodes made significant difference between left and right TLE. Accounting of complex characteristic of functional connectivity, the graph theoretical measures can be a prerequisite tool in searching for potential connectivity-derived lateralization biomarkers in TLE.Acknowledgements
We must acknowledge the contribution of the Iranian National Brain Mapping Lab (NBNL) for MRI data acquisition throughout this project. This work was partially funded and supported by Iran’s National Elites Foundation, National Institute for Medical Research Development (Grant No. 971683), and Cognitive Sciences & Technologies Council (Grant No. 6431), between 2017 and 2021.References
1. Berg, A.T., Vickrey, B.G., Langfitt, J.T., Sperling, M.R., Walczak,T.S., Shinnar, S., Bazil, C.W., Pacia, S.V., Spencer, S.S., 2003. Themulticenter study of epilepsy surgery: recruitment and selectionfor surgery. Epilepsia 44, 1425—1433. 2. Duncan, J.S., 1997. Imaging and epilepsy. Brain 120, 339—377. 3. Chiang, S., Haneef, Z., 2014. Graph theory findings in the patho-physiology of temporal lobe epilepsy. Clin. Neurophysiol. 125,1295—1305. 4. Billingsley, R.L., McAndrews, M.P., Crawley, A.P., Mikulis, D.J., 2001.Functional MRI of phonological and semantic processing in tem-poral lobe epilepsy. Brain 124, 1218—1227. 5. Dupont, S., Samson, Y., Van de Moortele, P.F., Samson, S., Poline,J.B., Hasboun, D., Le Bihan, D., Baulac, M., 2002. Bilateral hemi-spheric alteration of memory processes in right medial temporallobe epilepsy. J. Neurol. Neurosurg. Psychiatry 73, 478—485. 6. Vlooswijk, M.C., Jansen, J.F., de Krom, M.C., Majoie, H.M., Hofman,P.A., Backes, W.H., Aldenkamp, A.P., 2010. Functional MRI inchronic epilepsy: associations with cognitive impairment. LancetNeurol. 9, 1018—1027. 7. vanDiessen, E., Zweiphenning, W.J., Jansen, F.E., Stam, C.J., Braun, K.P., Otte, W.M., 2014. Brain network organization in focal pilepsy: a systematic review and metaanalysis. PLoS One 9 (12), e114606. 8. N. Tzourio-Mazoyer, B. Landeau, D. Papathanassiou, F. Crivello, O. Étard, N. Delcroix, B. Mazoyer, and M. Joliot Automated Anatomical Labeling of Activations in SPM Using a Macroscopic Anatomical Parcellation of the MNI MRI Single-Subject Brain. NeuroImage 2002. 15 :273-289 9. Rolls ET, Joliot M &Tzourio-MazoyerN,Implementation of a new parcellation of the orbitofrontal cortex in the automated anatomical labeling atlas, NeuroImage. 2015.Figures
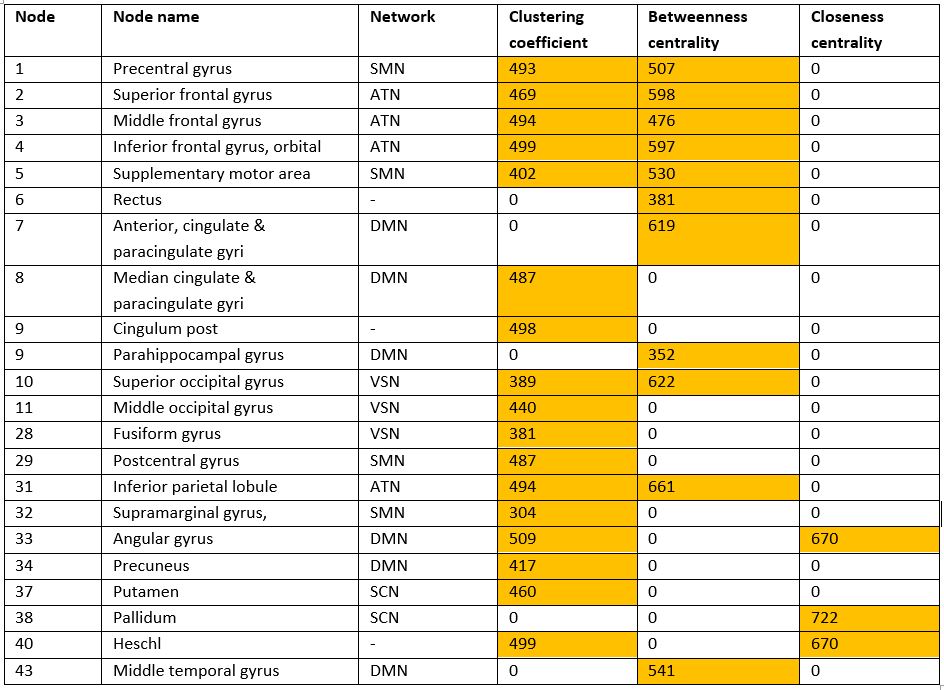
Fig. 1: The nodes selected at least 300 out of 1000 repetitions using the
Lasso method for each graph theoretical method. Default mode network (DMN),
sensorimotor network (SMN), attention network (ATN), and subcortical network
(SCN).
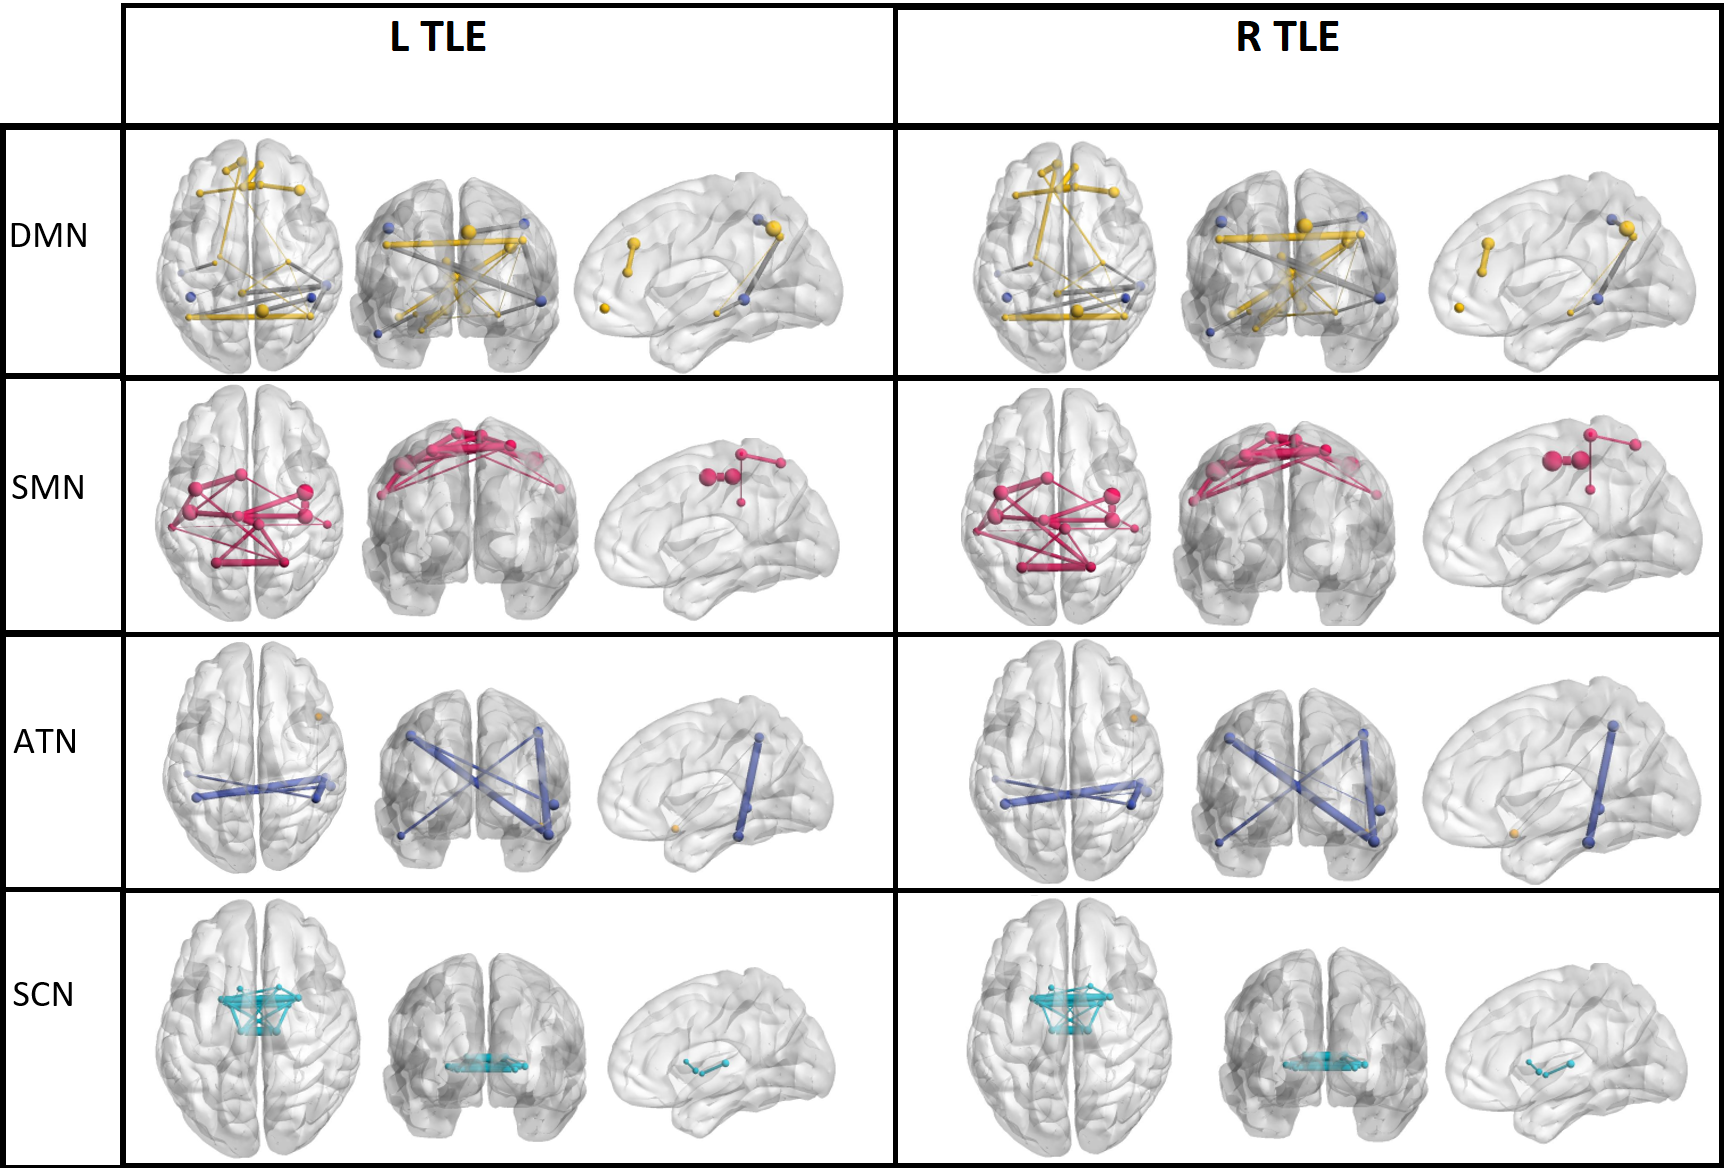
Fig. 2: Significantly different nodes in functional
connectivity between left and right TLE groups in default mode network (DMN),
sensorimotor network (SMN), attention network (ATN), and subcortical network
(SCN).
DOI: https://doi.org/10.58530/2022/1933