1932
Static and Dynamic Resting-State fMRI Features to Localize Brain Areas Generating Epileptic Spikes1Department of Pediatrics, University of Calgary, Calgary, AB, Canada, 2Department of Radiology, University of Calgary, Calgary, AB, Canada
Synopsis
The potential of using features derived from resting-state fMRI time series to localize epileptic brain areas was studied. Static and dynamic correlations between local spike rates measured with intracranial EEG and regional homogeneity (ReHo), amplitude of low-frequency fluctuations (ALFF), and functional connectivity (FC), respectively, were analyzed based on data collected from 13 subjects with refractory epilepsy. While static measures of ReHo and ALFF were not statistically correlated with spike rates measured during long-term monitoring, static correlation with FC was apparent. However, in dynamic analysis, temporal variations in instantaneous spike rates were associated with synchronous fluctuations of both ALFF and FC.
Introduction
In patients with refractory focal epilepsy, seizure freedom can be best achieved by the surgical resection of epileptic brain areas, although this depends heavily on whether these areas can be precisely identified1,2,3. The gold standard to localize those areas is intracranial EEG (iEEG), an invasive procedure that involves implanting electrodes in the brain, yet only offers limited brain coverage4. In contrast, functional MRI (fMRI) is a non-invasive procedure that measures activity across the entire brain. This study investigates the possibility of using features from resting-state fMRI time series to predict the location of epileptic brain areas.Methods
iEEG data were collected at 10 kHz using SynAmps amplification/digitization system and Scan 4.4 Software (Compumedics NeuroScan) on 13 subjects. Concurrent resting-state fMRI data were acquired by a GE Discovery MR750 scanner using established safety protocols5. The 3T scanner adopted echo planar imaging sequence with \(\mathrm{TR}/\mathrm{TE}=1500/30\) ms, 24-cm field of view, \(64 \times 64\) matrix, 24 5-mm thick slices6. The fMRI scans consisted of 1 to 3 20-minute sessions for each subject.FMRI data were motion-corrected and normalized to MNI space using Statistical Parametric Mapping (SPM) software. Motion parameters were regressed out from the fMRI time series and the data were bandpass filtered between 0.01-0.1 Hz. Several features readily available in fMRI time series, which included regional homogeneity (ReHo) and amplitude of low-frequency fluctuations (ALFF) were computed at every iEEG channel location to enable comparisons with the corresponding spike rates measured at every channel. Additionally, functional connectivity (FC) was computed between every channel location and a reference defined as the channel where interictal spikes were most.
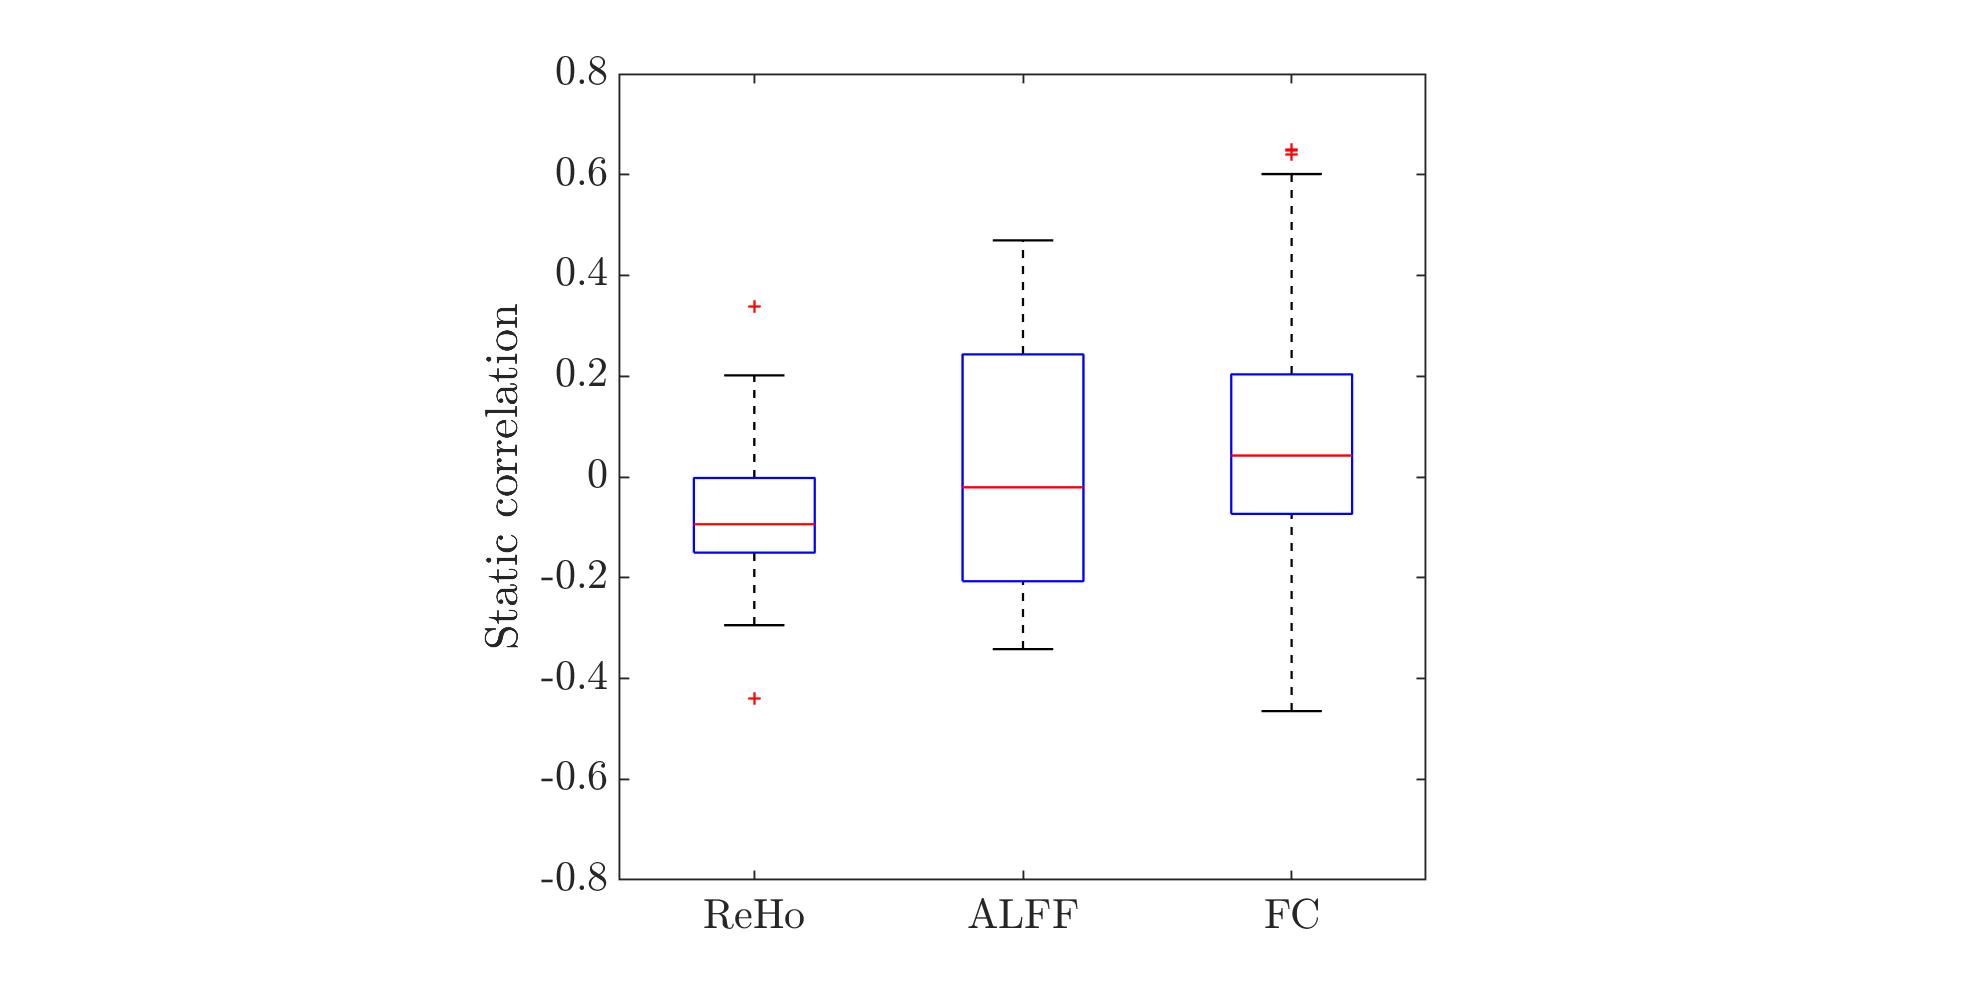
Static correlations were first analyzed, whereby Spearman’s correlation coefficient (\(\rho\)) was computed between spike rates measured during long-term monitoring and each of the features listed above for every session of every subject to obtain \(\rho_{\mathrm{ReHo}}\), \(\rho_{\mathrm{ALFF}}\), and \(\rho_{\mathrm{FC}}\), where subscripts denote the corresponding fMRI features. Afterwards, the statistical significance of the correlations at the group level was determined by a \(t\)-test on the Fisher-transformed \(\rho\) of every subject (Fig.1).
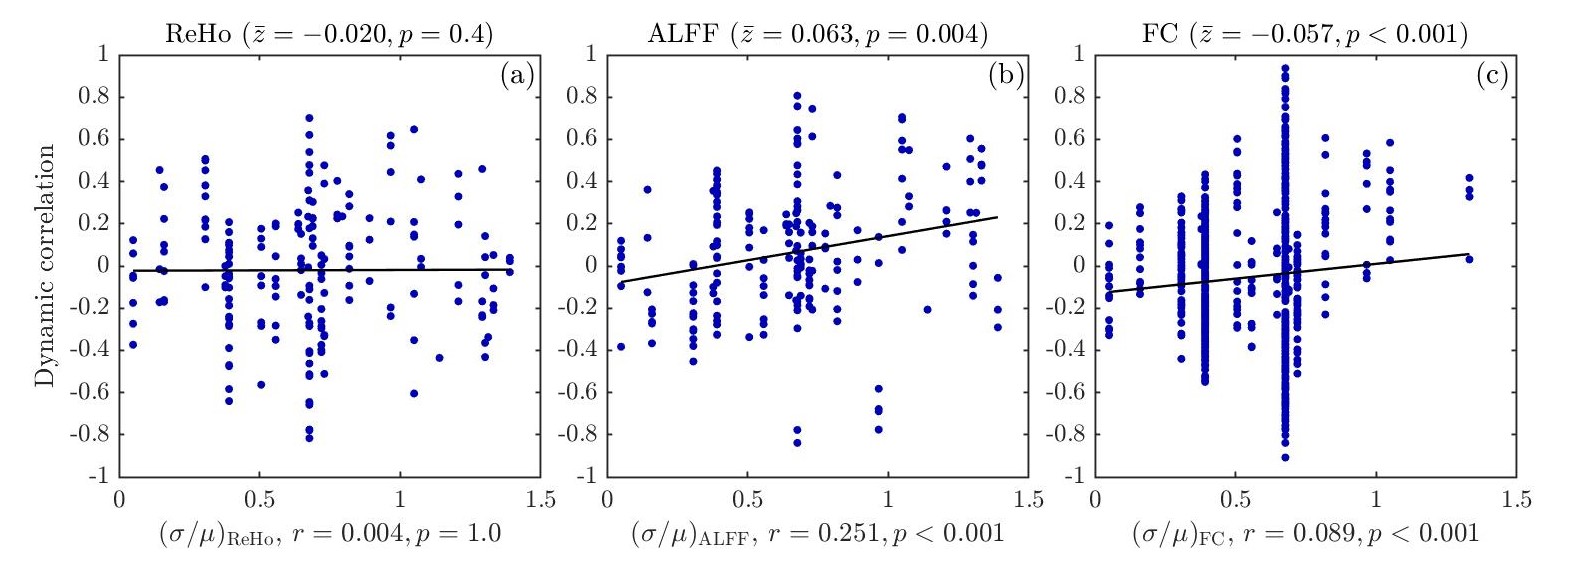
Dynamic correlations were then analyzed by decomposing the fMRI time series into segments of 120 \(s\), with \(50 \%\) overlap. All features were then calculated within each segment and correlated across time with the instantaneous spike rate fluctuations seen on iEEG during the scan (Fig.2).
Results
Among 30 sessions conducted, only 4 of them showed significant static \(\rho_{\mathrm{ReHo}}\). From all sessions combined, static \(\rho_{\mathrm{ReHo}}\) was only marginally significant (\(p=0.03\)) (Fig.1). For ALFF, 12 sessions showed significant static correlation with spike rate, although half were positive and half were negative. At the group level, a much wider distribution of static \(\rho_{\mathrm{ALFF}}\) than that of \(\rho_{\mathrm{ReHo}}\) was thus obtained, with approximately half of the sessions conducted having static \(\rho_{\mathrm{ALFF}}\) within \([-0.2, 0.2]\). The inconsistent sign of \(\rho_{\mathrm{ALFF}}\) across subjects thus led to it not being significantly different from zero, at the group level. For FC, its distribution of static \(\rho_{\mathrm{FC}}\) was the widest among them all, with a range of \([-0.4, 0.6]\), and a \(p\)-value \(< 0.001\), indicating FC between channels exhibited significant static correlations with spike rates.Preliminary findings revealed that dynamic \(\rho_{\mathrm{ALFF}}\) and \(\rho_{\mathrm{FC}}\) were strongly correlated with spike rates across time segments. However, dynamic correlations between fMRI features and instantaneous spike rates would only be expected in cases where there were sufficient fluctuations in spike rates during the scan. Therefore, these correlations are plotted in Fig.2 as a function of the coefficient of variation in spike rates across time segments, defined as the ratio between standard deviation (\(\sigma\)) and mean (\(\mu\)) spike rate of all segments in every time series. In Fig.2a, no significant relationship is found for dynamic \(\rho_{\mathrm{ReHo}}\). For ALFF, statistically significant correlation between dynamic \(\rho_{\mathrm{ALFF}}\) and \(\sigma/\mu\) was recorded (\(r=0.251\), \(p\)-value \(<0.001\)), demonstrating that channels with high \(\rho_{\mathrm{ALFF}}\) were likely associated with high temporal variations in spike rate (high \(\sigma/\mu\)) (Fig.2b). In Fig.2c, dynamic \(\rho_{\mathrm{FC}}\) between simultaneously spiking channels followed similar response to \(\sigma/\mu\) as that depicted in the case of ALFF. Though the magnitude of correlation, \(r\), between \(\rho_{\mathrm{FC}}\) and \(\sigma/\mu\) was weak, a clear trend of high \(\sigma/\mu\) accompanying high dynamic \(\rho_{\mathrm{FC}}\) was evident.
Conclusion
The prospect of using features derived from fMRI time series, specifically, ReHo, ALFF, and FC, to predict the locations of brain areas generating epileptic spikes was examined. In terms of static correlation, sensitivity of ReHo to changes in spike rate measured during long term monitoring was minimal. Moreover, \(t\)-test on the corresponding set of Fisher’s \(z\) scores showed that ALFF was not statistically significant at the group level, likely due to inconsistent relationships across subjects and sessions. Nonetheless, strong static correlation was found between FC and spike rate. Analysis on dynamic correlations revealed that while no statistically significant relationship was obtained for ReHo, ALFF and FC showed significant association with instantaneous spike rates. Overall, ALFF and FC thus appear to reflect the instantaneous occurrence of interictal epileptic discharges during the fMRI scan. To be considered suitable clinical biomarkers to identify the locations of epileptic brain areas, resting-state fMRI features would thus need to take into account dynamic fluctuations in interictal activity occurring during the scan.Acknowledgements
This study was funded by NSERC Discovery Grant RGPIN-2021-02797.References
1. Rosenow F, Luders H. Presurgical evaluation of epilepsy. Brain. 2001;124(9):1683-1700.
2. Wellmer J, von der Groeben F, Klarmann U, et al. Risks and benefits of invasive epilepsy surgery workup with implanted subdural and depth electrodes. Epilepsia. 2012;53(8):1322-1332.
3. Thomschewski A, Hincapie A, Frauscher B. Localization of the Epileptogenic Zone Using High Frequency Oscillations. Front Neurol. 2019;10:94.
4. Jobst B, Bartolomei F, Diehl B, et al. Intracranial EEG in the 21st Century. Epilepsy Curr. 2020;20(4):180-188.
5. Boucousis S, Beers C, Cunningham C, et al. Feasibility of an intracranial EEG-fMRI protocol at 3T: risk assessment and image quality. Neuroimage. 2012;63(3):1236-1248.
6. Aghakhani Y, Beers C, Pittman D. Co-localization between the BOLD response and epileptiform discharges recorded by simultaneous intracranial EEG-fMRI at 3 T. Neuroimage Clin. 2015; 7(7):755-763.
Figures