1931
fMRI Can Detect Functional Connections of Seizure Spread Regions to Onset Zones in Patients with Mesial Temporal Sclerosis1Thomas Jefferson University, Philadelphia, PA, United States, 2The University of New Mexico, Albuquerque, NM, United States
Synopsis
Epilepsy is a disease involving seizure initiation and often spread. sEEG has shown that areas of seizure spread are correlated with onset regions. We find that seed-to-voxel analysis via amplitude synchronization of fMRIs of epilepsy patients can also detect significant correlations between seizure onset and spread zones. These results validate fMRI analysis as a promising noninvasive method to detect other correlated brain regions that may be involved in seizure propagation.
Introduction
Epilepsy is a disease of abnormal connections in the brain. Temporal lobe epilepsy (TLE) is the most common form of focal epilepsy refractory to medical management and has severe forms such as mesial temporal sclerosis (MTS)1-3. Estimates of the prevalence and incidence of medically refractory MTS in the U.S. range from 0.51 – 0.66 cases per 1,000 people and 3.1 – 3.4 cases per 100,000 people per year, respectively, showing a significant burden of disease4.Seizures spread to different brain regions via connected networks. Abnormal networks in the brain may facilitate the spread of seizures and may be involved in the manifestation of clinical signs and symptoms seen in epilepsy5. Pathologic changes in brain networks due to MTS may underlie these alterations in connectivity.
Currently, stereotactic electroencephalography (sEEG) can be used to detect regions of seizure onset and spread. These regions are understood to be correlated with the seizure onset zone, underpinning one of the mechanisms for seizure spread to those areas. fMRI has been shown to be a promising modality to detect similar measures of functional connectivity and correlations to sEEG6 and guide epilepsy treatment7.
In this study, we examined whether patient rsfMRIs can be used to detect correlations between the seizure onset zones and regions of early and late seizure spread. Through this analysis, we aimed to see whether noninvasive fMRI imaging techniques can be used to predict patterns of seizure spread, providing insight into the disease process and potentially demarcating areas for intervention without the use of invasive techniques such as sEEG.
Methods
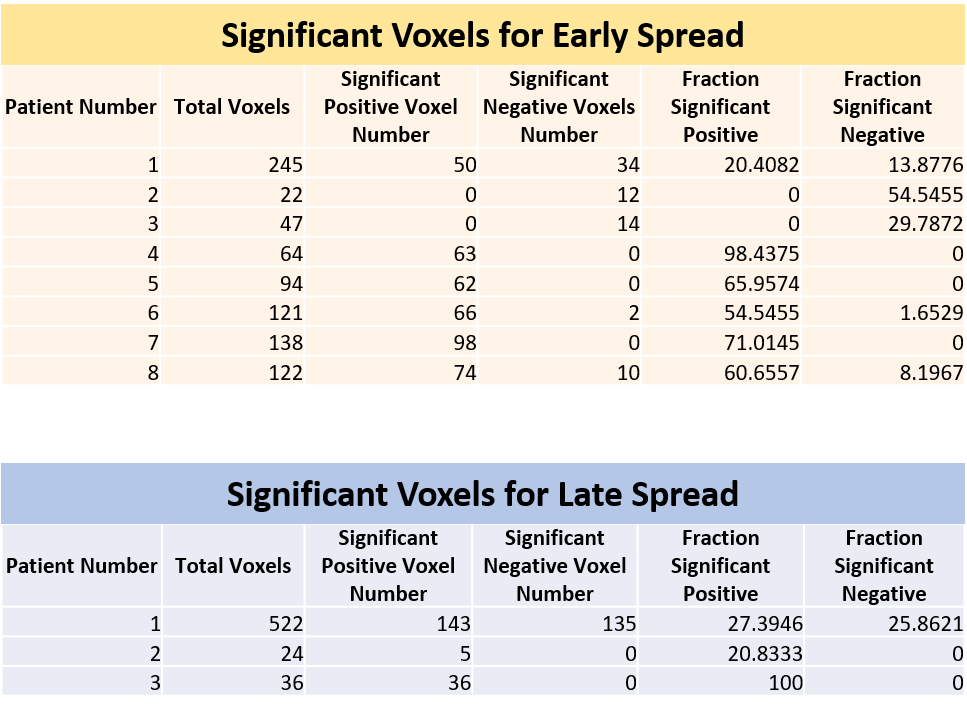
This is a retrospective study of 8 patients with refractory MTS (ages 25-53). Patient preoperative fMRI scans were preprocessed and registered to a standard space. Onset, early spread, and, when possible, late spread zones calculated by identifying, via a epileptologist, sEEG contacts that recorded seizure activity. The coordinates of involved contacts were used to generate spherical regions of interest with a radius of 2.5 cm around the contact. These regions were registered as segmentations to the fMRI space using symmetric normalization (QSyN) with B-spline. For each subject, we used dual regression analysis to detect amplitude synchronization of the onset zone with the rest of the brain. We calculated the overlapped volume ratio of synchronized voxels to the whole region within early spread zones and late spread zones if applicable. Voxels were considered to be significantly positively synchronized if their correlation to the onset zone had a z > 2.5, and negatively synchronized if z < -2.5. The distribution of voxels within the spread regions was averaged as well as reported as a histogram for each patient. Proportions of significantly positively and negatively correlated voxels in early spread and late spread areas were compared in each patient using a two-proportion t-test with a significance value of 0.05.Results
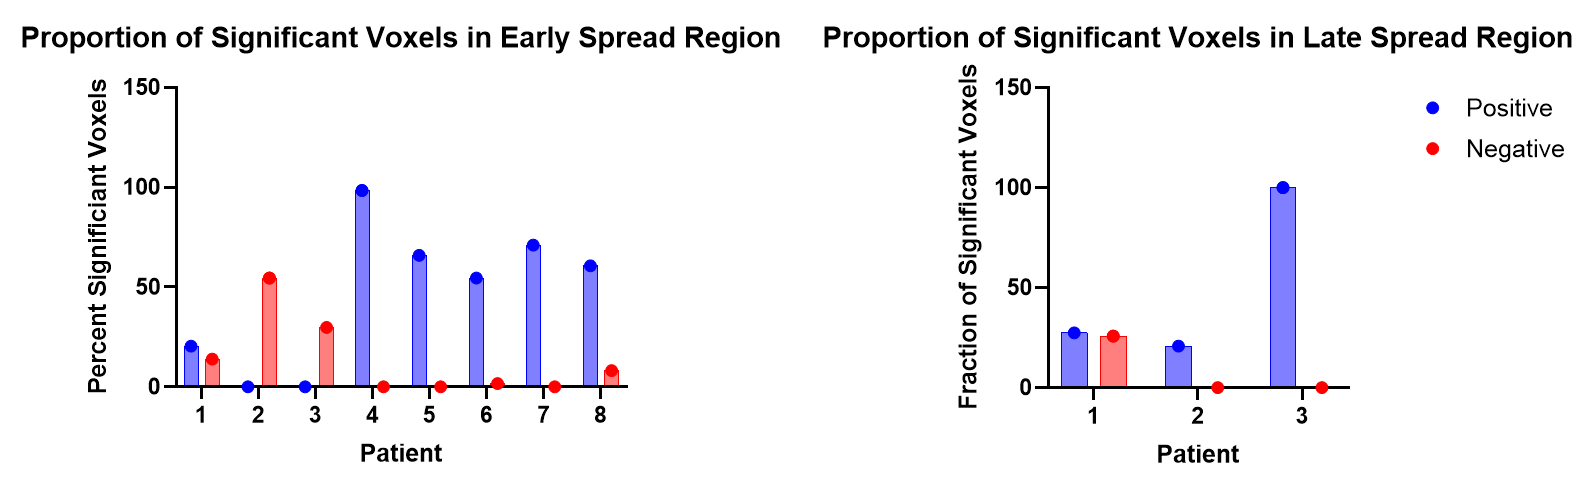
5 patients showed a significantly larger proportion of significantly positively correlated voxels from the onset zone to the early spread region compared to negatively correlated voxels (patients 4, 5, 6, 7, 8: p < 0.01). 1 patient was an edge case showing a nonsignificant difference between a larger proportion of significantly positively correlated voxels compared to negative (patient 1: p = 0.05486). 2 patients showed a significantly larger proportion of significantly negatively correlated voxels compared to positive (patients 2, 3: p < 0.01). 2 out of the 3 patients with data for late spread showed significantly larger proportions of significantly positively correlated voxels from the onset zone to the late spread region compared to negative (patient 2: p = 0.01828, patient 3: p < 0.01). Patient 1 had no significant differences between proportions of significant positively and negatively correlated voxels (p = 0.57548). Significant results are reported in Figure 1 and Figure 2 and graphically in Figure 3.Discussion
A majority of patients showed significant positive correlations between the seizure onset zone and early spread regions, indicating that functional connectivity and brain networks may influence and even drive seizure propagation. A majority of the patients with data for late spread showed a higher proportion of significantly positively correlated voxels. These patients were the same ones that showed a higher proportion of significantly negatively correlated voxels in the early spread region, indicating that the underlying pathological mechanisms that drive early seizure propagation may change between early and late seizure spread.Conclusion
Our findings indicate that seed-to-voxel analysis via amplitude synchronization of rsfMRI data can detect functional connectivity and correlations between regions of seizure onset and spread. The high degree of correlated regions implicates functional brain networks as the mode for propagating seizures. There is interpatient variability as to whether these associations represent positive or negative correlations between the onset and spread regions. These results indicate that noninvasive fMRI analysis can be used to find other brain regions with significant correlations to seizure onset zones, thereby revealing otherwise undetected regions that may be involved in seizure propagation pathways.Acknowledgements
No acknowledgement found.References
1. Allone C, Lo Buono V, Corallo F, Pisani LR, Pollicino P, Bramanti P, et al. Neuroimaging and cognitive functions in temporal lobe epilepsy: A review of the literature. J Neurol Sci. 2017 Oct 15;381:7–15.
2. Wu C, Jermakowicz WJ, Chakravorti S, Cajigas I, Sharan AD, Jagid JR, et al. Effects of surgical targeting in laser interstitial thermal therapy for mesial temporal lobe epilepsy: A multicenter study of 234 patients. Epilepsia. 2019 May 21;60(6):1171–1183.
3. Tramoni-Negre E, Lambert I, Bartolomei F, Felician O. Long-term memory deficits in temporal lobe epilepsy. Rev Neurol. 2017 Aug 31;173(7-8):490–497.
4. Asadi-Pooya AA, Stewart GR, Abrams DJ, Sharan A. Prevalence and Incidence of Drug-Resistant Mesial Temporal Lobe Epilepsy in the United States. World Neurosurg. 2017 Mar;99:662–666.
5. Kramer MA, Cash SS. Epilepsy as a disorder of cortical network organization. Neuroscientist. 2012 Aug 1;18(4):360–372.
6. Su J, Khoo HM, von Ellenrieder N, Zeng L-L, Hu D, Dubeau F, et al. fMRI functional connectivity as an indicator of interictal epileptic discharges. Neuroimage Clin. 2019 Oct 23;24:102038.
7. Winston GP. The role of magnetic resonance imaging techniques in the diagnosis, surgical treatment and biological understanding of epilepsy. Quant Imaging Med Surg. 2015 Apr;5(2):186–187.
Figures