1927
Network efficiency of structural covariance networks relate to cognitive performance in children with childhood absence epilepsy1Department of Biomedical Technology, Eindhoven University of Technology, Eindhoven, Netherlands, 2Department of Radiology & Nuclear Medicine, Maastricht University Medical Center, Maastricht, Netherlands, 3School for Mental Health & Neuroscience, Maastricht University, Maastricht, Netherlands, 4Department of Neurology, Maastricht University Medical Center, Maastricht, Netherlands, 5Department of Behavioral Sciences, Kempenhaeghe, Heeze, Netherlands
Synopsis
Cognitive deficits have been reported in children with childhood absence epilepsy (CAE). Regional alterations in morphology in children with CAE are likely related to the changes in the underlying network structure. Structural covariance networks (SCNs) based on interregional correlations of cortical thicknesses can describe these changes. To relate cognitive performance to network efficiency, individual SCNs are derived from anatomical MR images of the control group and one patient. The global efficiency calculated from the resulting SCNs showed a negative relation with cognitive performance for children with CAE.
Introduction
Childhood absence epilepsy (CAE) is a generalized epilepsy and is a common form of epilepsy in school-aged children, typically between 6 and 12 years old. These children experience frequent, brief absence seizures during which the child is not aware or responsive. CAE has been considered as a benign condition, since most children become seizure-free when reaching adulthood. However, various cognitive impairments have been previously reported in children with CAE compared to controls1,2,3. Moreover, a previous neuroimaging study also revealed regional alterations in cortical thickness in children with CAE4. Possibly, these regional changes are not independent, but are related to an underlying network structure, which can be described by the structural covariance network (SCN). The SCN is constructed using interregional correlations of morphological properties, such as cortical thicknesses, and rests on the assumption that functional and/or axonal connected regions share similar patterns of morphology5. The SCNs can subsequently be characterized using graph theoretic analysis, which can provide measures related to network efficiency. The aim of this study is to investigate the potential relation between network efficiency of individual SCNs and cognitive performance of children with CAE.Methods
Data acquisitionSixteen children with clinically diagnosed CAE (6-12y, 12 male) and 15 healthy, age- and sex-matched control subjects (6-12y, 11 male) were included6. The Full Scale Intelligence Quotient (FSIQ) of all participants was assessed using the Wechsler Intelligence Scale for Children third edition (WISC-III). All subjects were scanned on a 3.0T (Philips Achieva) scanner using a 32-element phased-array coil. Structural MR images were acquired for each subject using a T1-weighted three-dimensional turbo field echo sequence (TR = 8.4 ms, TE = 3.8 ms, FA = 8°, voxel size 1 mm3).
Preprocessing
As part of the Freesurfer pipeline, T1-weighted images were parcellated into 68 cortical regions based on the Desikan-Killiany atlas, and for each region the mean cortical thickness was determined. Subsequently, for each region, potential effects of age, sex and total intercranial volume on the cortical thickness were regressed out via linear regression models.
SCN construction
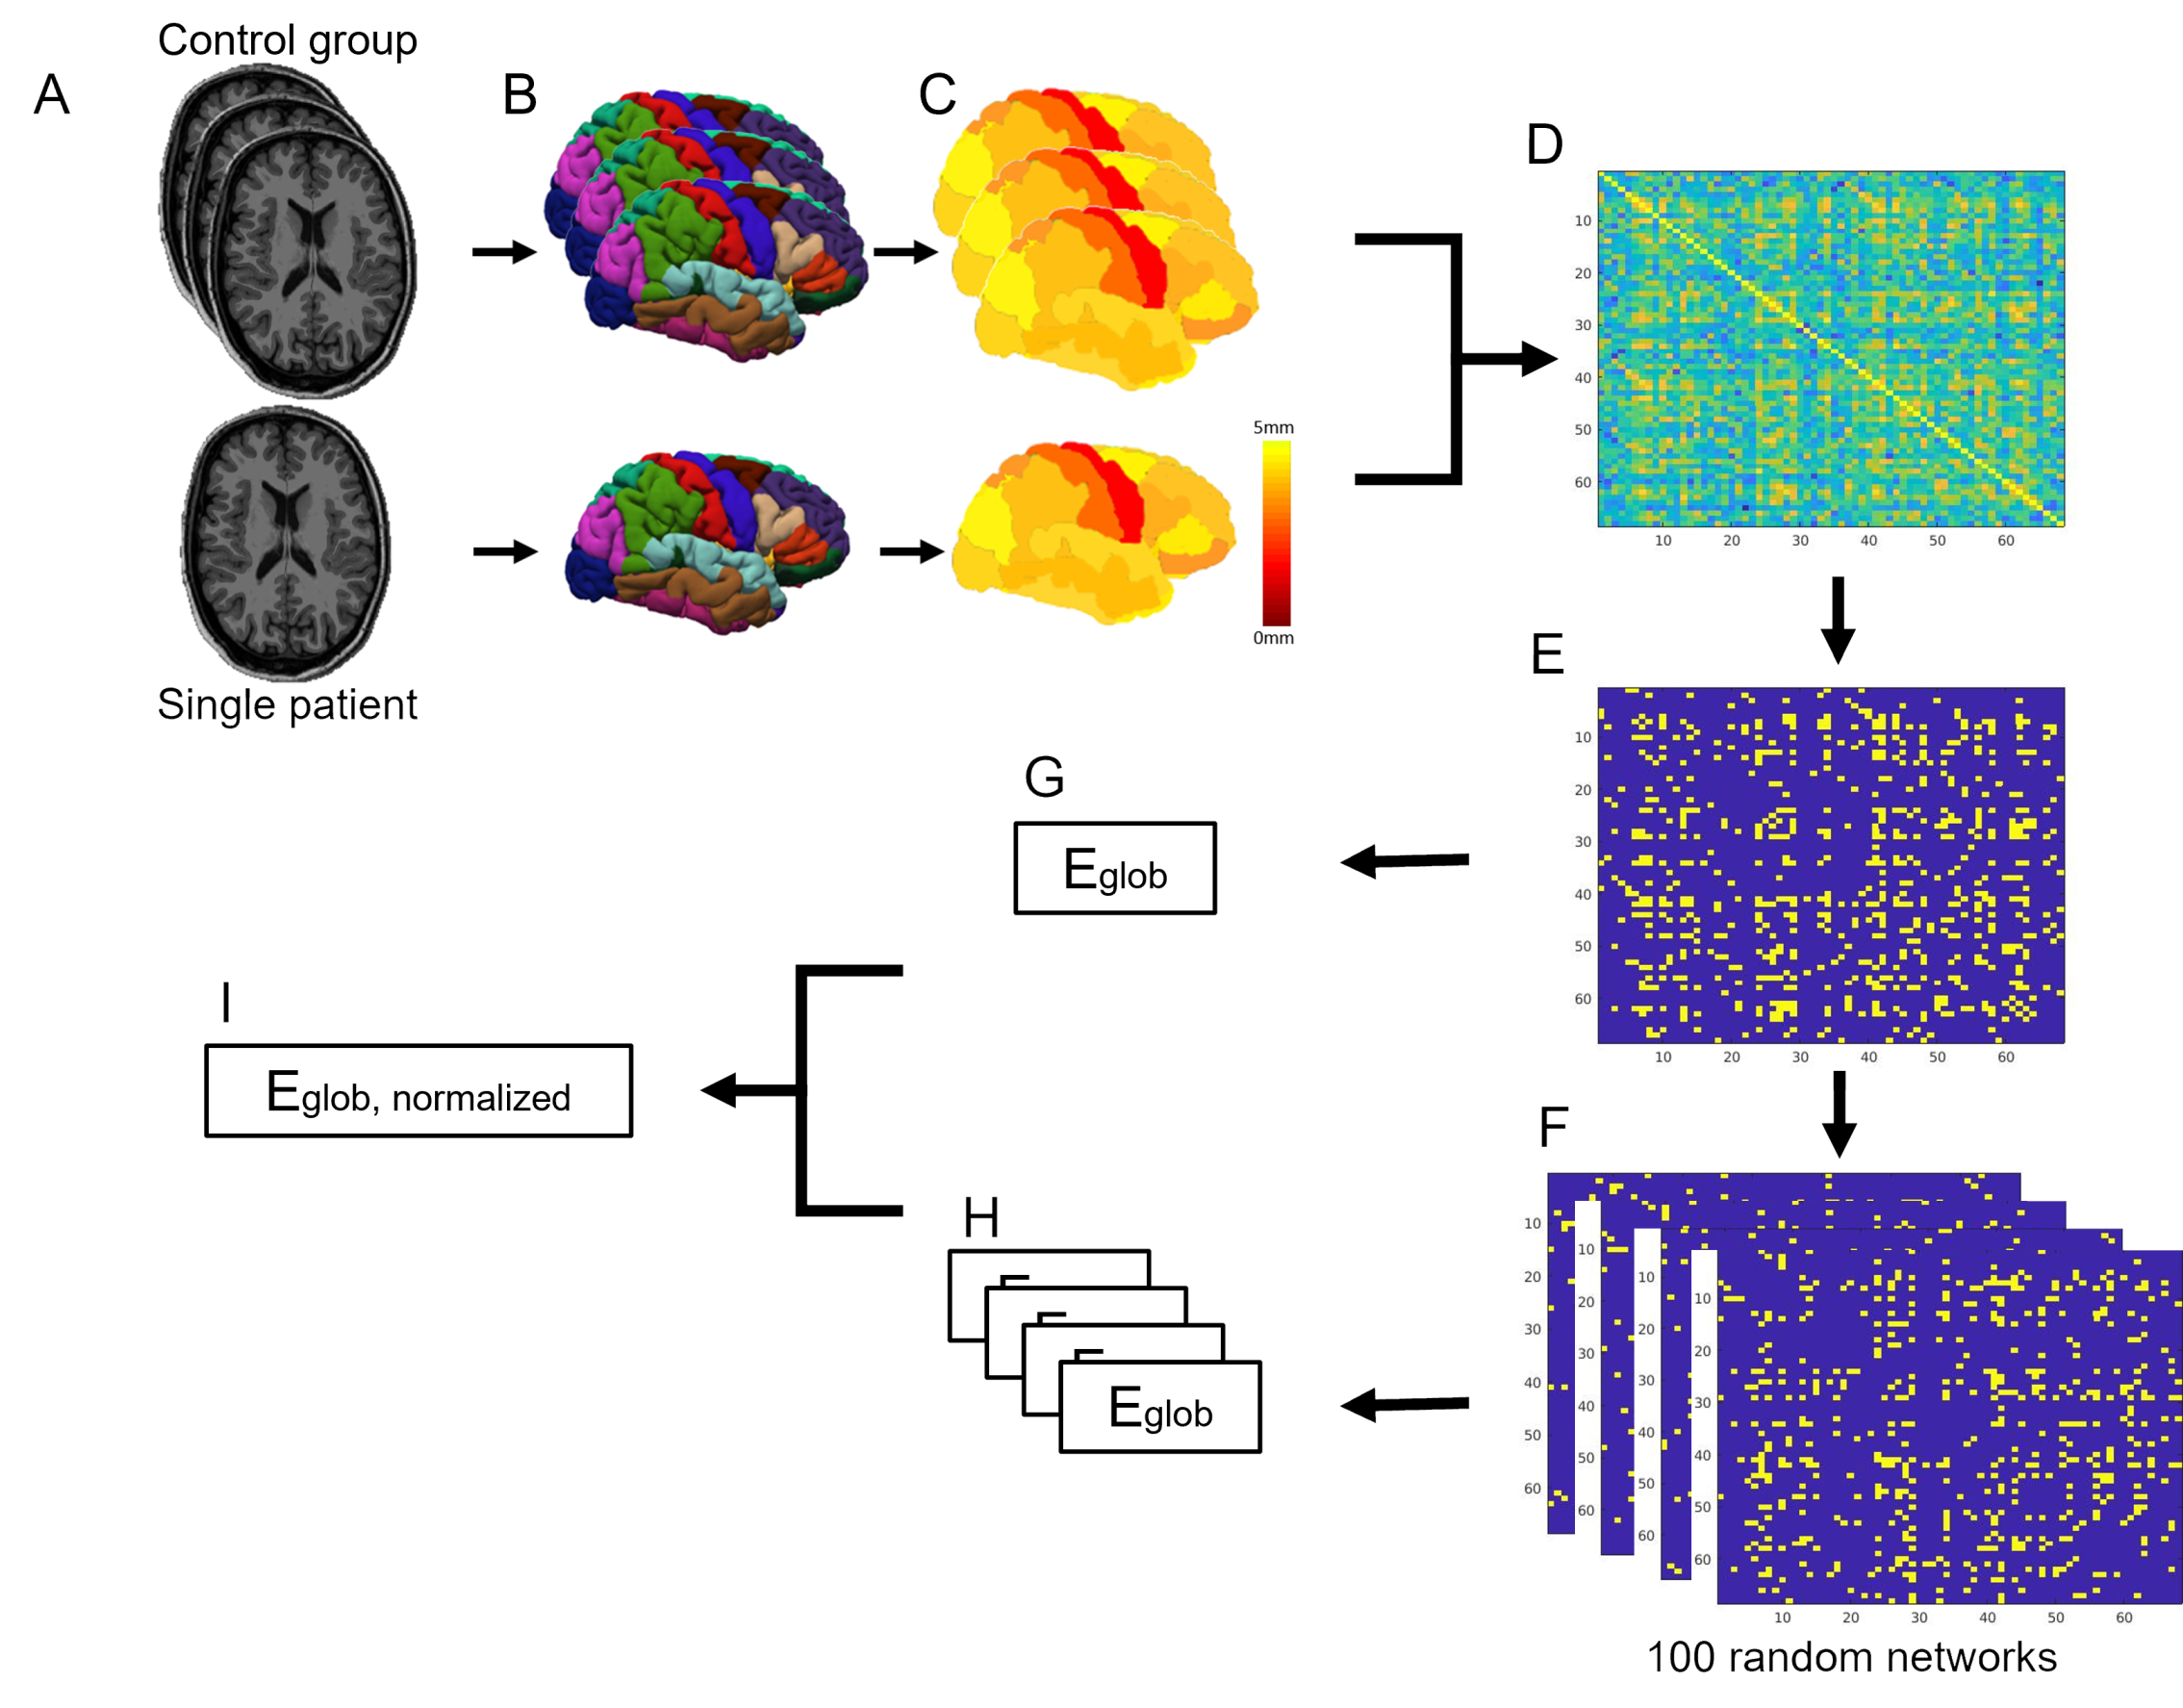
For the SCN analysis, each brain region is treated as a node in the network, while the connection strength between the nodes was calculated by the Pearson coefficient across a group of subjects. Therefore, an individual SCN cannot be obtained directly. Previously, Saggar et al.7 introduced the Add-One-Patient approach to estimate the individual contribution of a patient on the SCN of the control group. In short, the SCN is generated for the control group including one patient. Next, the graph metric is calculated from the resulting SCN. This process is repeated for all subsequent patients, resulting in individual graph metrics for each patient. Negative and non-significant correlations were not considered, to cope with false positive connections. Subsequently, the resulting adjacency matrix is binarized using sparsity thresholds ranging from 85.5%-90% with increments of 0.5%. This allows for comparisons of networks with the same number of connections, which is important since the graph metrics are influenced by the sparsity of the network (i.e. the number of connections). The graph metric used to characterize the network efficiency is the global efficiency, which is inversely related to the mean path lengths between all pairs of nodes in a sparse graph8. This metric is normalized with respect to 100 random networks with a preserved degree and strength distribution. A graphical representation of the method is given in Figure 1. All preprocessing and SCN analyses were performed in Matlab.
Statistical analysis
After visual assessment, a Box-Cox transformation is performed on the non-normally distributed global efficiency values. To investigate whether the global network efficiency relates significantly to the FSIQ of children with CAE, a linear regression model was applied. Age and sex are added to the model as covariates. Statistical significance was inferred when p < 0.05.
Results
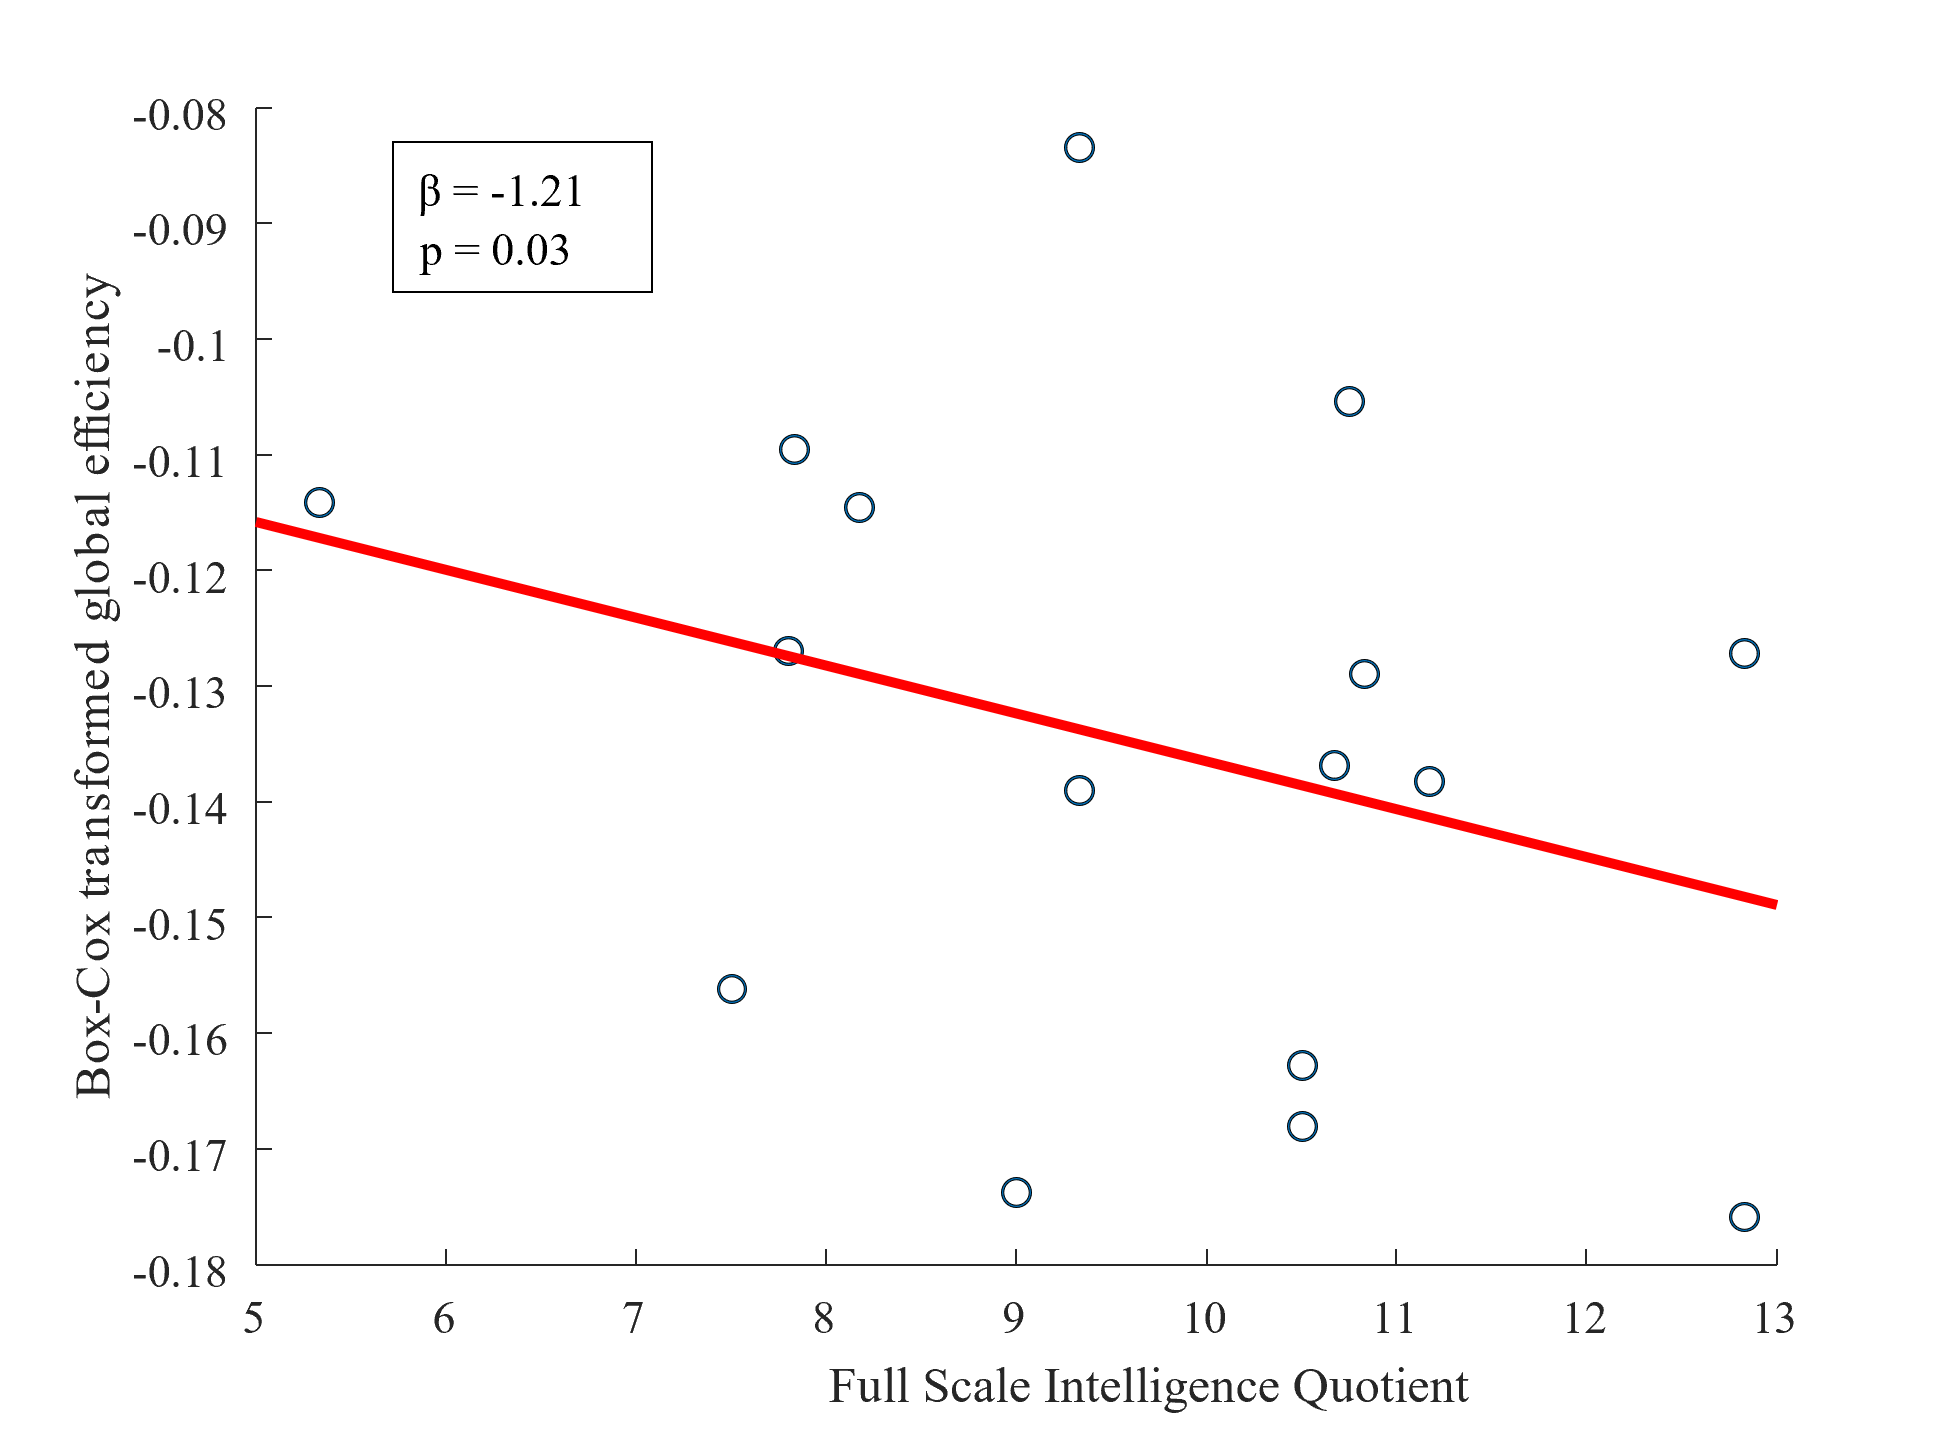
A significant negative relation between global efficiency and FSIQ was found at a sparsity level of 88.5% (β = -1.21, p = 0.03) and 89% (β = -1.21, p = 0.04). This indicates that at both sparsity levels, a lower FSIQ is associated with a higher global efficiency in children with CAE. A scatterplot of the Box-Cox transformed global efficiency as function as FSIQ at sparsity level 88.5% is shown in Figure 2.Discussion & Conclusion
This study demonstrates that the global efficiency calculated from individual cortical thickness derived SCNs is significantly related to the FSIQ of children with CAE. The negative relation for global efficiency and FSIQ indicates that for a more efficient network the FSIQ score is lower. This is in line with the findings of a prior SCN study in epilepsy, which reported that higher clustered (i.e. more efficient) networks related to epilepsy severity, in terms of lower cognitive performance scores, younger age at onset and higher seizure frequency9. From the results presented here, a relation between global efficiency and epilepsy severity cannot be formally drawn, therefore, this needs to be further investigated in future work.Acknowledgements
No acknowledgement found.References
1. Fonseca Wald ELA, Hendriksen JGM, Drenthen GS, Kuijk SMJV, Aldenkamp AP, Vles JSH, Vermeulen RJ, Debeij-van Hall MHJA, Klinkenberg S. Towards a Better Understanding of Cognitive Deficits in Absence Epilepsy: a Systematic Review and Meta-Analysis. Neuropsychol Rev. 2019;29(4):421-449.
2. Caplan R., Siddarth P, Stahl L, Lanphier E, Vona P, Gurbani S, Koh S, Sankar R, Shields W. Childhood absence epilepsy: Behavioral, cognitive, and linguistic comorbidities. Epilepsia. 2008;49(11):1838–1846.
3. Fonseca Wald ELA, Klinkenberg S, Voncken TPC, Ebus SCM, Aldenkamp AP, Vles JSH, Vermeulen RJ, Hendriksen JGM, Debeij-Van Hall MHJA. Cognitive development in absence epilepsy during long-term follow-up. Child Neuropsychol. 2019;25(8):1003-1021.
4. Kim E, Shim W, Lee J, Yoon H, Ko T, Yum M. Altered structural network in newly onset childhood absence epilepsy. Journal of Clinical Neurology. 2020;16(4):573.
5. Wright IC, Sharma T, Ellison ZR, McGuire PK, Friston KJ, Brammer MJ, Murray RM, Bullmore ET. Supra-regional brain systems and the neuropathology of schizophrenia, Cerebral Cortex. 1999;9(4):366-378.
6. Drenthen GS, Fonseca Wald EL, Backes WH, Debeij-Van Hall MH, Hendriksen JG, Aldenkamp AP, Vermeulen RJ, Klinkenberg S, Jansen JF. Lower myelin‐water content of the frontal lobe in childhood absence epilepsy. Epilepsia. 2019;60(8):1689–1696.
7. Saggar M, Hossein, SMH, Bruno JL, Quintin EM, Raman MM, Kesler SR, Reiss AL. Estimating individual contribution from group-based Structural Correlation Networks. NeuroImage. 2015;120:274–284
8. Rubinov M, Sporns O. Complex network measures of brain connectivitiy: Uses and interpretations. NeuroImage. 2010;52(3):1059-1069.
9. Drenthen GS, Backes WH, Rouhl RPW, Vlooswijk MCG, Majoie MHJM, Hofman PAM, Aldenkamp AP, Jansen JFA. Structural covariance networks relate to the severity of epilepsy with focal-onset seizures. NeuroImage: Clinical. 2018;20:861–867.
Figures