1923
7T metabolic MRI in focal epilepsy1Department of Radiology and Nuclear Medicine, University Medical Center Utrecht, Utrecht, Netherlands, 2Spinoza Centre for Neuroimaging Amsterdam, Amsterdam, Netherlands, 3Department of Pathology, University Medical Center Utrecht, Utrecht, Netherlands, 4Department of Pathology, Amsterdam University Medical Center, location AMC, Amsterdam, Netherlands, 5UMC Utrecht Brain Center, Department of Neurology and Neurosurgery, University Medical Center Utrecht, Utrecht, Netherlands, 6Stichting Epilepsie Instellingen Nederland (SEIN), Heemstede, Netherlands, 7Department of Radiology, Radboud University Medical Center, Nijmegen, Netherlands
Synopsis
In this clinical study, we combined different (metabolic) MRI sequences at 7T to characterize focal epileptogenic lesions, and uncover potential metabolic markers that could help identifying the culprit lesion in MRI-negative epilepsy patients. Using QSM, we observed increased iron deposition in the affected hippocampus of two HS patients that was not found in the contralateral hippocampus, neither in a suspected HS patient with no abnormal tissue, nor in matched healthy volunteers. No increased iron deposition was found in patients with FCD or matched healthy volunteers. No significantly different metabolite ratios between patients and healthy volunteers were found using SV 1H-MRS.
Epilepsy surgery is an effective therapy for drug-resistant epilepsy1,2, and surgery is more successful in patients with epileptogenic lesions detected with structural MRI. About 20-30% of patients with focal epilepsy show no structural abnormalities, i.e., are MRI-negative3. Surgery can be effective if an epileptic focus can be defined in another way. Metabolic MRI can visualize underlying metabolic pathways associated with disease, especially when applied at ultrahigh field with its increased SNR and spectral dispersion to help us identify epileptogenic lesions not detected with structural MRI.
Several potential metabolic markers for epileptogenic lesions that can be imaged with MRI have been reported in recent years. For instance, glutamate, associated with mitochondrial and metabolic injury inducing seizures in patients with epilepsy, can be measured with MRS, and locally increased concentrations have been found in MRI-negative epileptogenic lesions.4 Also iron accumulation, a potential marker of oxidative stress, has been found in hippocampal sclerosis (HS) and focal cortical dysplasia (FCD) using histopathological staining.5 The metabolic phenotype – or ‘profile’ – of epileptogenic lesions will likely consist of a combination of metabolites, some of which may not even have been found using in vivo imaging techniques.
In this preliminary clinical trial, we aim to find (combinations of) metabolic markers of epileptogenic lesions that can be detected with 7T metabolic MRI, using glutamate-CEST (GluCEST), quantitative susceptibility mapping (QSM) and single-voxel (SV) 1H MRS, and validate these with histopathology. This abstract discusses the imaging results of QSM and 1H MRS in the first five patients compared to five healthy volunteers.
METHODS
Five patients (aged 23-48 years; three females) and five healthy volunteers (aged 24-27 years; two females) were included. All patients were diagnosed with focal epilepsy with an epileptogenic lesion on structural MRI and/or positron emission tomography and were scheduled for surgical treatment. This clinical trial was approved by our IRB; all participants gave written informed consent.
MRI examination
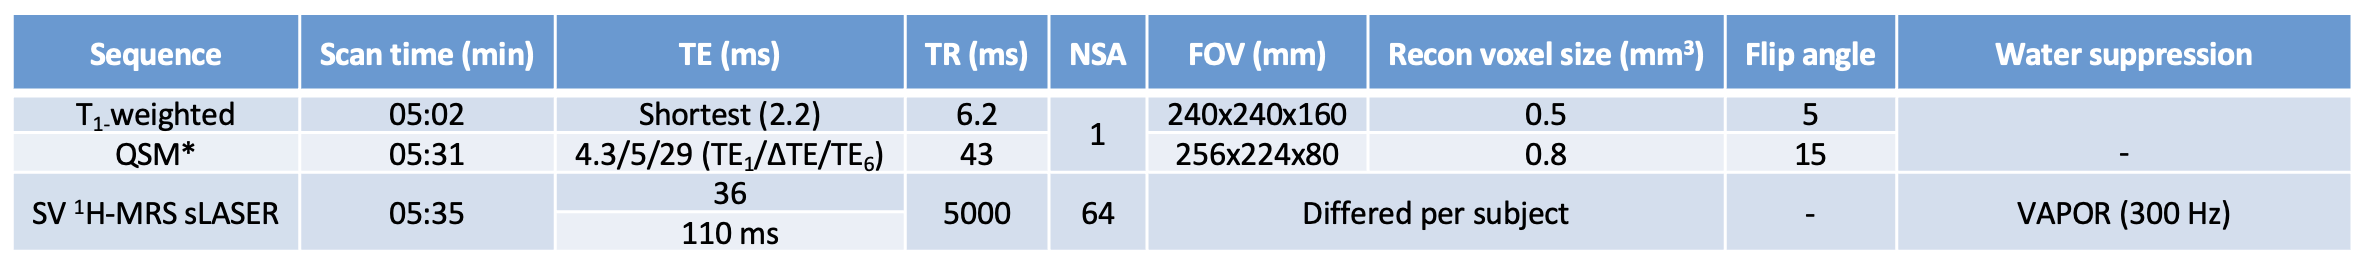
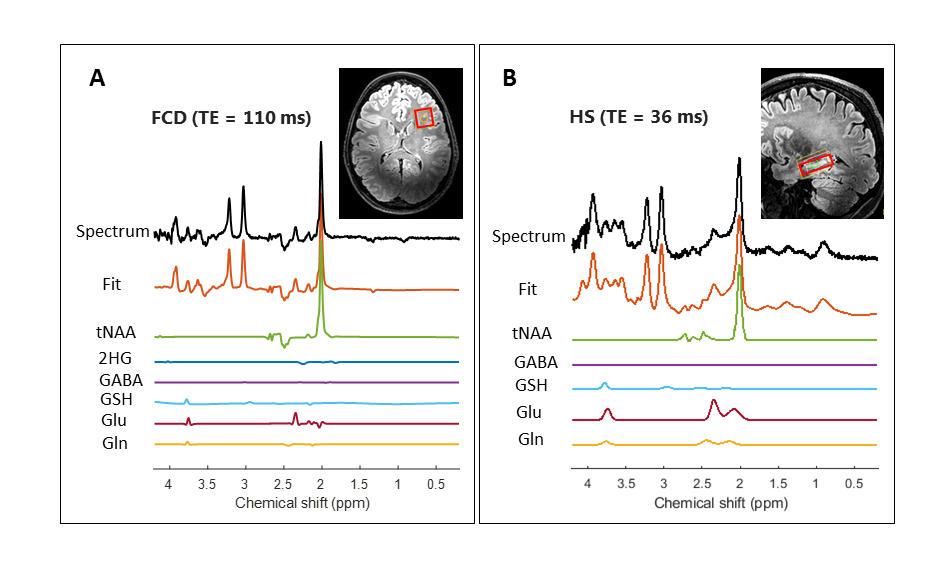
All subjects underwent one 7T (Philips, Best, the Netherlands) MRI examination with a 32-channel head coil (Nova Medical) the day prior to their surgery. Next to QSM and SV 1H MRS (sLASER), a high-resolution T1-weighted sequence was acquired for FOV planning; see Table 1 for acquisition parameters. The FOV in healthy volunteers was matched with the lesion location in the patients; for MRS, a TE of 36 ms was used in HS patients (N=3) and matched volunteers, and a TE of 110 ms was used in the FCD patients (N=2) and matched volunteers. Final diagnosis was based on histopathology.
Post-processing & data analysis
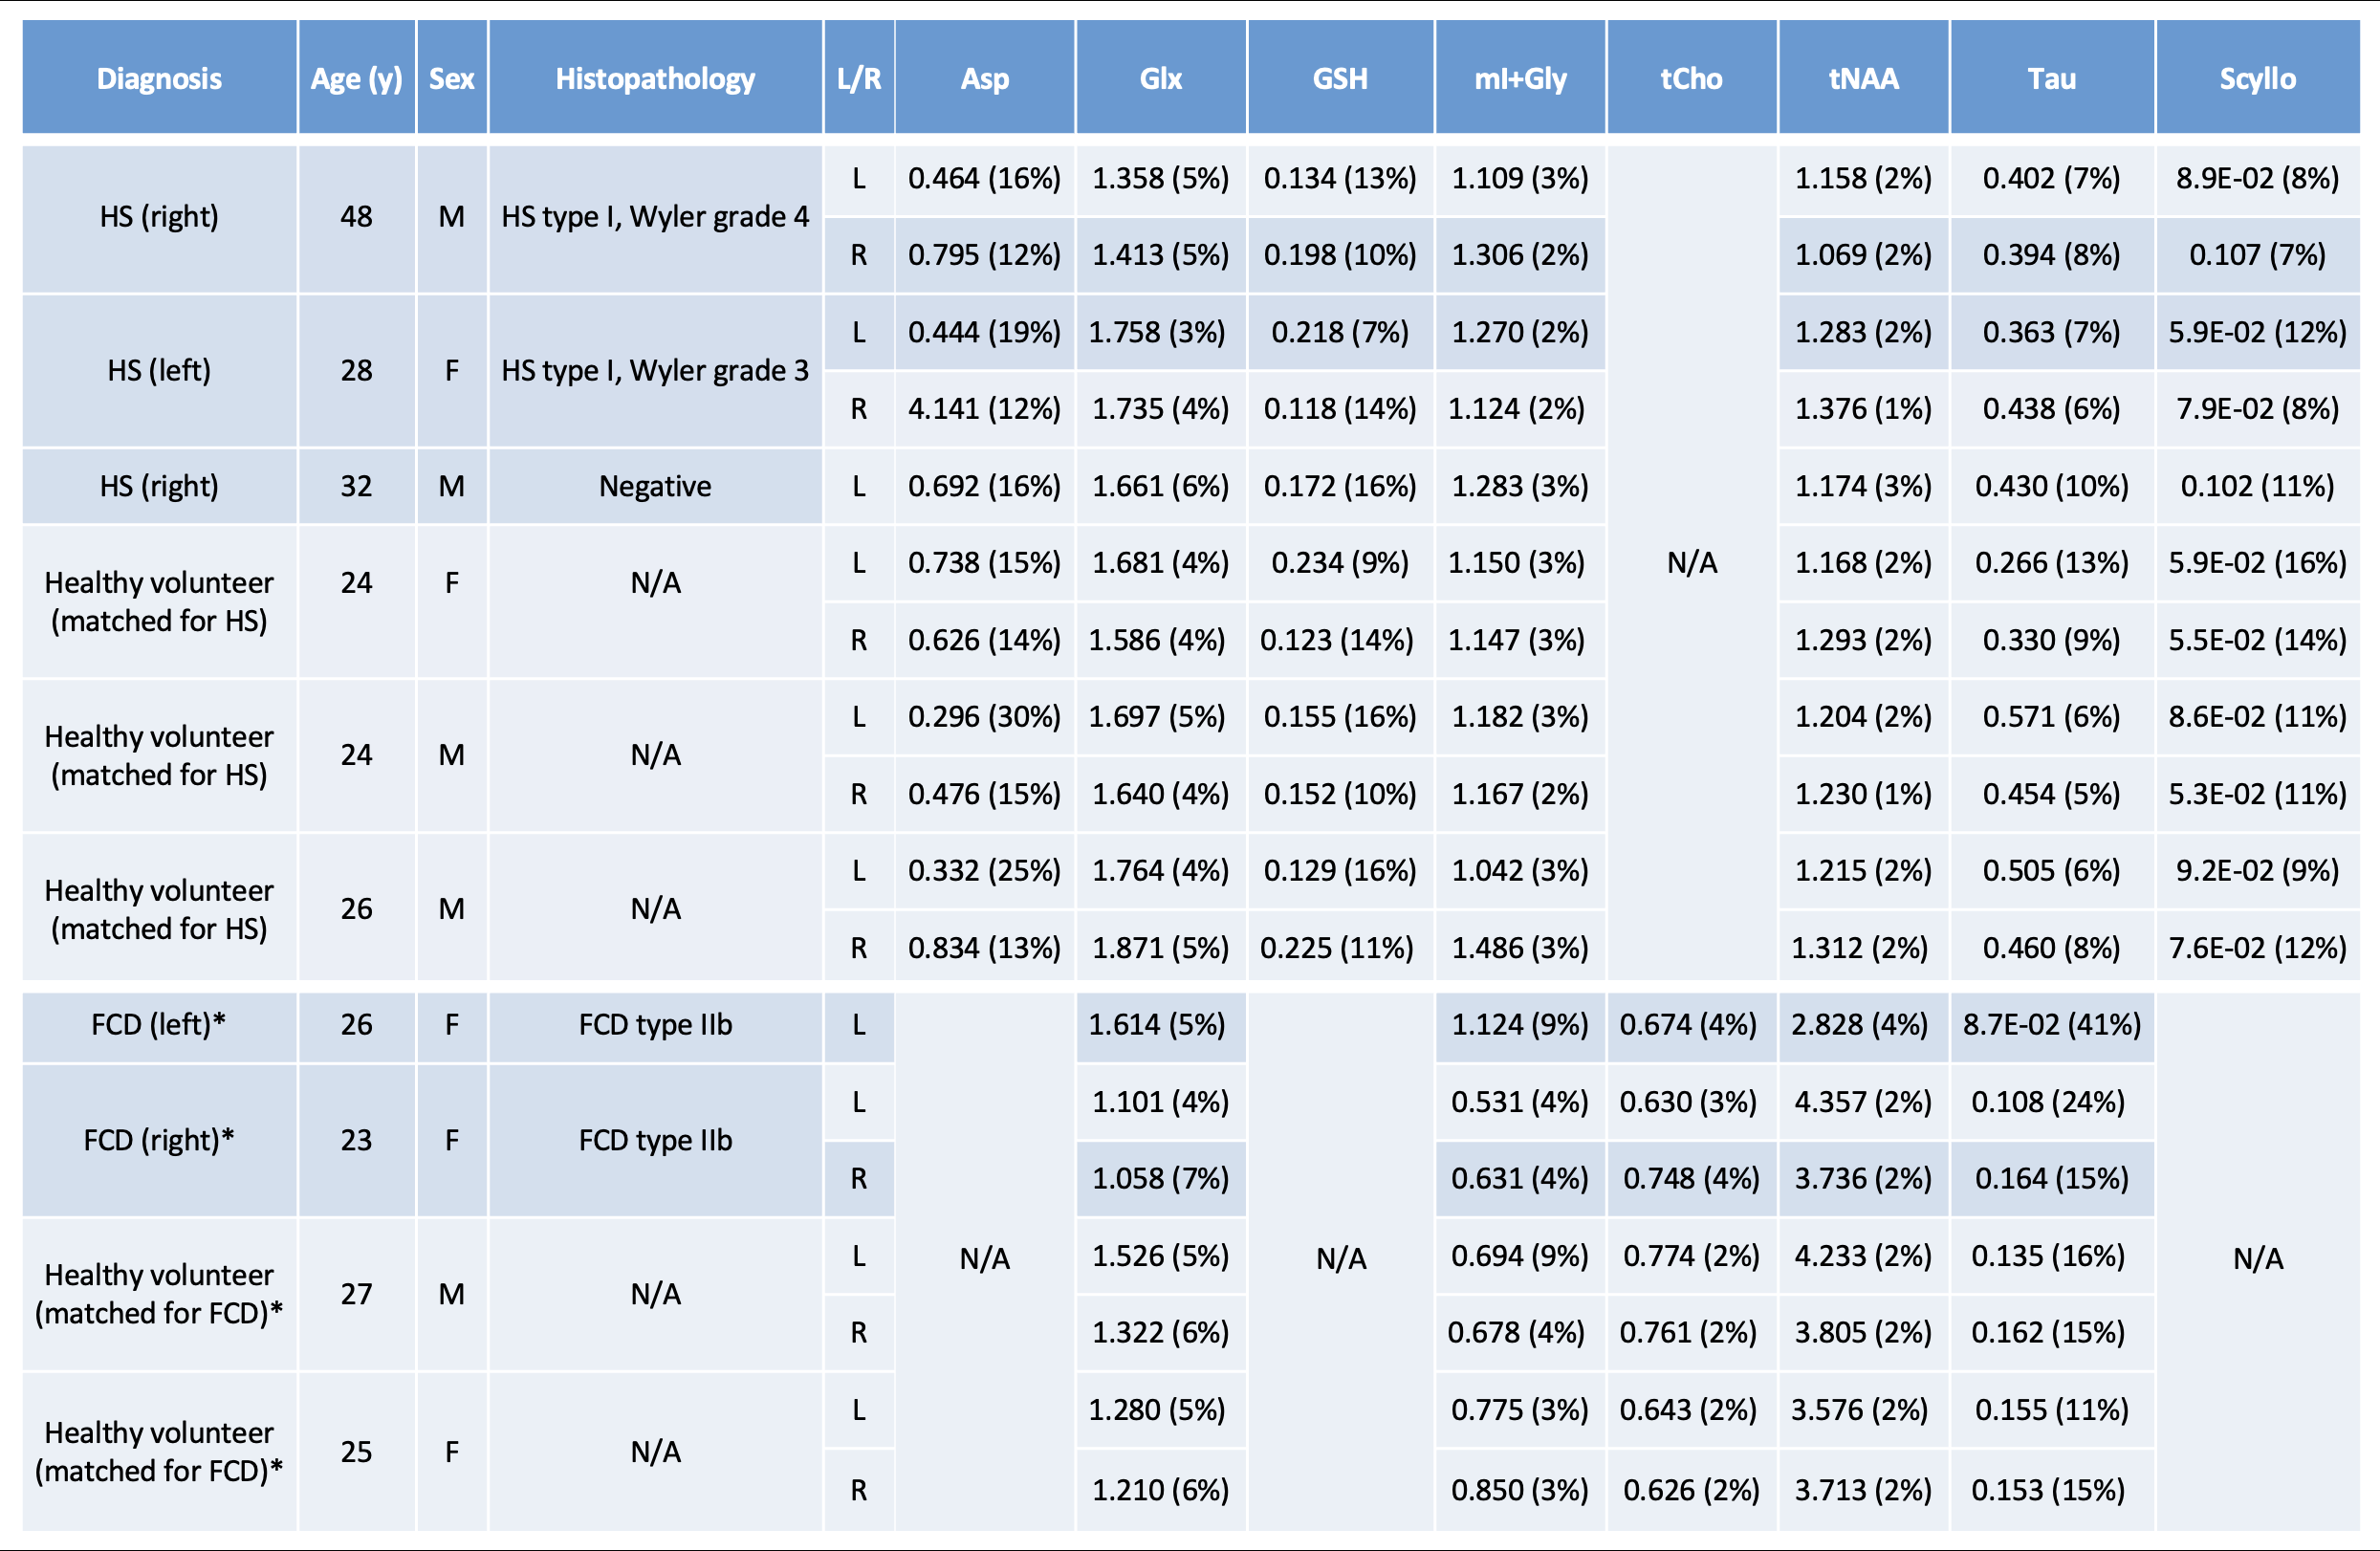
QSM data was post-processed with the SEPIA tool using Laplacian-based phase unwrapping, variable-kernel SHARP background field removal and the iLSQR method for computing the susceptibility maps. MRS data was analyzed using LCModel with a simulated basis set.6 No correction for T1 or T2 relaxation times was applied. Metabolite ratios with respect to total creatine, with a Cramér Rao Lower Bound of <20% for N≥2 per different TE were reported (Figure 1; Table 2). QSM images were analyzed qualitatively for differences in iron deposition; a Wilcoxon-signed rank test was used to compare differences in metabolite ratios between epileptic lesions and healthy brain tissue.
RESULTS
QSM
The two patients with histopathologically confirmed HS showed increased iron deposition in the affected hippocampus, while the third HS patient did not show abnormal iron deposition in either hippocampus (Figure 2); this patient however turned out not to have abnormal tissue. None of the matched healthy volunteers nor the patients with FCD showed increased iron deposition in either hippocampus or respective lesions of interest.
1H MRS
Some differences in metabolite ratios between HS and the contralateral hippocampus in the two histopathologically confirmed HS patients could be seen, though not statistically evident. We also found no evident differences in metabolite ratios between HS patients and healthy volunteers. This same result was found in the FCD patients and their matched healthy volunteers.
DISCUSSION & CONCLUSION
In this clinical study, we combined different (metabolic) MRI sequences at 7T to characterize focal epileptogenic lesions, and uncover potential metabolic markers that could help identifying the culprit lesion in MRI-negative epilepsy patients. Using QSM, we observed increased iron deposition in the affected hippocampus of two HS patients that was not found in the contralateral hippocampus, nor in a patient with suspected HS with no abnormal tissue, nor in matched healthy volunteers. These results support previous findings of increased iron deposition using susceptibility-weighted imaging and histopathology in temporal lobe epilepsy (TLE)5,7; however, contrary to previous histopathology-based literature, no increased iron deposition was found in patients with FCD. Two studies at 7T using MRS in epilepsy patients showed variable metabolite ratios: both increased (FCD) and ‘normal’ (TLE) GABA levels were found, and no differences in glutathione and glutamate/glutamine.8,9 The same lack of statistically significantly different metabolite ratios was found in our five patients; however, our very small sample size precludes any final conclusions. Ongoing patient inclusion will increase our sample size, allowing for more robust statistical analyses of our QSM and MRS data. Combining these with planned GluCEST data acquisition in the same patients could lead to an even stronger profiling of the metabolic phenotype of epileptogenic lesions.
Acknowledgements
We would like to thank neurosurgeons dr. P.C. van Rijen, drs. P.H. Gosselaar and nurse specialist J.M. Ophorst-van Eck from the University Medical Center Utrecht for their contribution to this study.References
1. Lamberink HJ, Otte WM, Blümcke I, et al. European Epilepsy Brain Bank writing group; study group; European Reference Network EpiCARE. Seizure outcome and use of antiepileptic drugs after epilepsy surgery according to histopathological diagnosis: a retrospective multicentre cohort study. Lancet Neurol. 2020 Sep;19(9):748-757
2. Dwivedi R, Ramanujam B, Chandra PS, et al. Surgery for Drug-Resistant Epilepsy in Children. N Engl J Med. 2017 Oct 26;377(17):1639-1647
3. Nguyen DK, Mbacfou MT, Nguyen DB, et al. Prevalence of nonlesional focal epilepsy in an adult epilepsy clinic. Can J Neurol Sci 2013; 40: 198–202
4. Davis KA, Nanga RPR, Das S, et al. Glutamate imaging (GluCEST) lateralizes epileptic foci in non-lesional temporal lobe epilepsy. Sci Transl Med 2015;7:309ra161
5. Zimmer TS, Ciriminna G, Arena A, et al. Chronic activation of anti-oxidant pathways and iron accumulation in epileptogenic malformations [published online ahead of print, 2019 Dec 23]. Neuropathol Appl Neurobiol. 2019;10.1111/nan.12596
6. Shams Z, van der Kemp WJM, Emir U, et al. Comparison of 2-Hydroxyglutarate Detection With sLASER and MEGA-sLASER at 7T. Front Neurol. 2021 Sep 7;12:718423
7. Zhang Z, Liao W, Bernhardt B, et al. Brain iron redistribution in mesial temporal lobe epilepsy: a susceptibility-weighted magnetic resonance imaging study. BMC Neurosci. 2014;15:117. Published 2014 Nov 21
8. Gong T, Liu Y, Chen Y, et al. Focal cortical dysplasia in epilepsy is associated with GABA increase. Neuroimage Clin. 2021;31:102763
9. Gonen OM, Moffat BA, Desmond PM, et al. Seven-tesla quantitative magnetic resonance spectroscopy of glutamate, γ-aminobutyric acid, and glutathione in the posterior cingulate cortex/precuneus in patients with epilepsy. Epilepsia. 2020 Dec;61(12):2785-2794
Figures
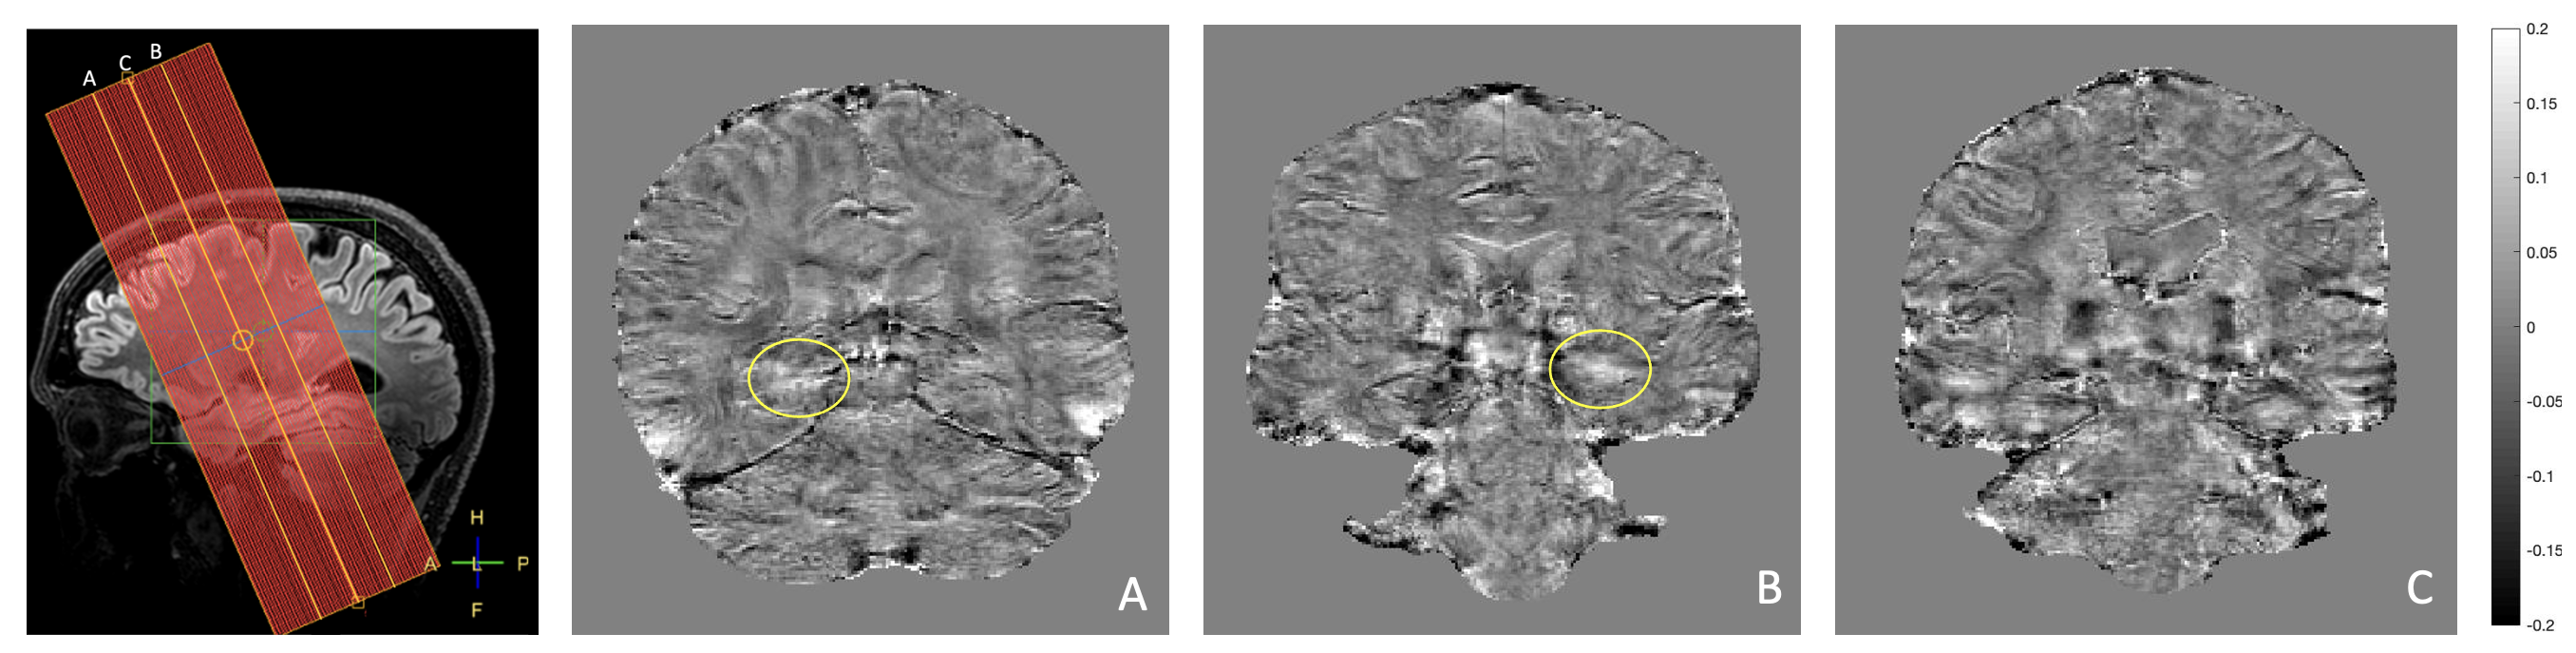
QSM images of all three patients with suspected HS, location indicated by yellow lines; HS patients 1 and 2 were confirmed with histopathology and show iron deposition in the right hippocampus tail (A) and the left hippocampus head (B), respectively, indicated by yellow circle, while the 3rd patient shows no difference / abnormal iron deposition between hippocampi (C).