1922
Frailty assessment using synthetic MRI1Beijing Hospital, National Center of Gerontology; Institute of Geriatric Me, Beijing, China, 2Beijing Hospital, Beijing, China, 3GE Healthcare, Beijing, China, Beijing, China
Synopsis
Synthetic MRI is a novel method which can provides quantitative relaxation mapping and synthetic contrast-weighted images at the same time. In this study, we adopted this technique to assessed the frailty. We found T2 relaxation of right insular lobe and right limbic subcortical nuclei had significant difference between frailty and prefrailty patients. T1 and T2 relaxation of right limbic subcortical nuclei and right basal ganglia significantly correlated with the short physical performance battery total scores. Overall, our findings suggested the synthetic MR can be considered an effective tool for assessing frailty.
Introduction
Physical frailty is a biological syndrome of reduced physiological reserves, which is prevalent in old age. Fried et al. [1] assessed the phenotype of frailty in terms of five components: slow walking speed, muscle weakness, low level of physical activity, exhaustion, and body weight loss. Frailty is a useful predictor for the older adults in the aspects of life expectancy and medical care. Short physical performance battery (SPPB) is a widely used scale exploring the reduction of physical performance in older persons. Synthetic MRI is an emerging technique which can simultaneously provide quantitative relaxation mapping, synthetic contrast-weighted images, and volumetric characteristics of the brain [2]. This research aims to investigate the changes of frailty and prefrailty, and the correlation between the relaxometry characteristics and SPPB total scores.Methods
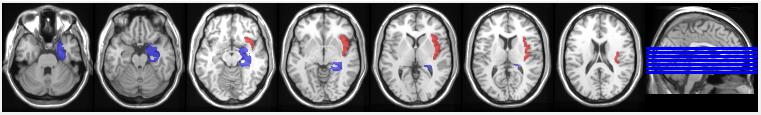
Frailty was assessed by trained researchers according to Fried criteria, which consisted of five frailty components: slow walking speed, muscle weakness, low level of physical activity, exhaustion, and body weight loss [1]. Subjects were categorized as 1) nonfrail, who had none of these components, 2) prefrail, who had a combination of one or two components, and 3) frail, who had a combination of three or more components. 15 frailty patients and 15 prefrailty patients were enrolled in this study. SPPB tests were performed for all subjects. All data were acquired from a 3.0T MRI scanner (SIGNA Pioneer, GE Healthcare, Milwaukee, WI, USA) equipped with a 32-channel head-neck receiver coil. Synthetic MRI (MAGnetic resonance image Compilation, MAGiC) was then performed with an oblique axial prescription parallel to the anterior commissure-posterior commissure line. The acquisition parameters of MAGiC were: field of view (FOV) = 240 mm × 240 mm; matrix = 320 × 256; slice thickness/gap = 4/0.5 mm; number of slice = 32; repetition time (TR) = 4906 ms; echo time (TE) = 22.0/87.9 ms; echo-train length = 12; bandwidth = 22.73 kHz; number of excitation (NEX) = 1; scan time = 4 min 55 sec. The MAGiC raw data was further processed using SyMRI version 8.04 (SyntheticMR AB, Linköping, Sweden) to generate relaxation maps of T1, T2. Finally, we applied 16 brain regions according to the AAL atlas (http://www.gin.cnrs.fr/en/tools/aal/) to extract the brain regional relaxometry, volumetry, and susceptibility values (Figure 1). All data were analyzed using the statistical package SPSS 19.0 (IBM Corp., Armonk, NY, USA). The analysis of covariance (ANCOVA) test was adopted to test the difference of relaxometry parameters between two groups, with the age, gender and the intracranial volume (ICV) as covariance.We also calculated the partial correlation of the relaxometry characteristics and SPPB total scores, with the age, gender and ICV as covariance. The level of significance was set at P < 0.05.Results
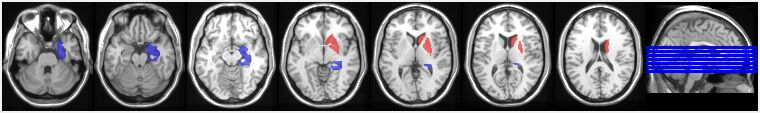
There were no results of regional T1 relaxation between frailty and prefrailty patients. T2 relaxation of right insular lobe and right limbic subcortical nuclei had significant differences between frailty and prefrailty patients (P=0.029, 0.01, respectively), which were shown in Figure 1. T1 relaxation of right limbic subcortical nuclei and right basal ganglia negatively correlated with the SPPB total scores (P = 0.004, 0.005, r = -0.54, -0.53, respectively). T2 relaxation of right limbic subcortical nuclei and right basal ganglia negatively correlated with the SPPB total scores (P = 0.002, 0.019, r = -0.57, -0.45, respectively). Figure 2 showed the brain subregions correlated with SPPB total scores.Discussion and Conclusion
The MRI relaxation times are sensitive to changes in brain tissue microstructural integrity and tissue composition [3, 4]. T2 relaxation of right insular lobe and right limbic subcortical nuclei had significant differences between two groups. We also found the relationship between T1 and T2 relaxation of right limbic subcortical nuclei and right basal ganglia and SPPB total scores, these brain subregions were important node in frailty consisted with previous study[5]. The frailty can lead to a high risk of adverse health outcomes, and our results showed that the relaxation parameters may help to verify the frailty using synthetic MRI.Acknowledgements
We sincerely thank the participants in this study.References
1. Fried LP, Tangen CM, Walston J, et al. Frailty in older adults: evidence for a phenotype. J Gerontol A Biol Sci Med Sci. 2001;56(3):M146-M156.
2. Hagiwara A, Warntjes M, Hori M, et al. SyMRI of the Brain: Rapid Quantification of Relaxation Rates and Proton Density, With Synthetic MRI, Automatic Brain Segmentation, and Myelin Measurement. Invest Radiol. 2017;52(10):647-657.
3. Tang X, Cai F, Ding DX, Zhang LL, Cai XY, Fang Q. Magnetic resonance imaging relaxation time in Alzheimer's disease. Brain Res Bull. 2018;140:176-189.
4. Stüber C, Morawski M, Schäfer A, et al. Myelin and iron concentration in the human brain: a quantitative study of MRI contrast. Neuroimage. 2014;93 Pt 1:95-106.
5. Li C, Chen Y, Wu PY, et al. Associations between brain volumetry and relaxometry signatures and the Edmonton Frail Scale in frailty. Quant Imaging Med Surg. 2021;11(6):2560-2571.
Figures