1921
A radiomics approach to assess high risk carotid plaques: a non-invasive imaging biomarker, retrospective study
Sihan celestine Chen1, Yunfei Zha2, Changsheng Liu2, Xixiang chen3, Ling ma4, and Weiyin vivian Liu5
1Radiology, Renmin Hospital of Wuhan University and Hubei General Hospital, Wuhan, China, 2Radiology, enmin Hospital of Wuhan University and Hubei General Hospital, Wuhan, China, 3Renmin Hospital of Wuhan University and Hubei General Hospital, Wuhan, China, 4He Kang Corporate Management (SH) Co.Ltd, Shanghai, China, Wuhan, China, 5Advanced Application specialist, GE Healthcare, Beijing, China, Beijing, China
1Radiology, Renmin Hospital of Wuhan University and Hubei General Hospital, Wuhan, China, 2Radiology, enmin Hospital of Wuhan University and Hubei General Hospital, Wuhan, China, 3Renmin Hospital of Wuhan University and Hubei General Hospital, Wuhan, China, 4He Kang Corporate Management (SH) Co.Ltd, Shanghai, China, Wuhan, China, 5Advanced Application specialist, GE Healthcare, Beijing, China, Beijing, China
Synopsis
This study aimed to construct a radiomics-based T2-weighted imaging (T2WI) approach from high-resolution multi-contrast magnetic resonance imaging (hrMRI) in combination with clinical high-risk factors for non-invasive assessment, to differentiate symptomatic carotid atherosclerotic plaques from asymptomatic ones. Radscore showed a better diagnostic performance. The combination model of texture features and clinical data had the best performance in assessment of lesion vulnerability. This study demonstrated that hrMRI radiomics features provided incremental value for assessment of the carotid atherosclerotic vulnerability.
Synopsis
This study aimed to construct a radiomics-based T2-weighted imaging (T2WI) approach from high-resolution multi-contrast magnetic resonance imaging (hrMRI) in combination with clinical high-risk factors for non-invasive assessment, to differentiate symptomatic carotid atherosclerotic plaques from asymptomatic ones. Radscore showed a better diagnostic performance. The combination model of texture features and clinical data had the best performance in assessment of lesion vulnerability. This study demonstrated that hrMRI radiomics features provided incremental value for assessment of the carotid atherosclerotic vulnerability.Introduction and purpose
Carotid atherosclerotic plaque contributes to ~20% of ischemic cerebrovascular events, including transient ischemic attack (TIA) [1]. Clinical trials demonstrated that ultrasonography-defined luminal stenosis ≥70% was predictive for future ischemic event for both symptomatic [2] and asymptomatic [3] patients. However, numerous studies have demonstrated serious limitations of angiology-defined degree of luminal stenosis and carotid ultrasound screening in the general population is therefore not recommended [4]. However, atherosclerosis is a complex structure, e.g., there is existence of mixture of fibrous tissue and lipid [5], different type of collagen (type I and type III) [6]. The complexity of compositional feature might be captured as a special image texture by in vivo imaging. But, this has been least studied. Pilot other studies have demonstrated the clinical potential of image texture analysis. This study aimed to build an effective model using hrMRI texture features and patient clinical risk factors in differentiation of symptomatic and asymptomatic plaques.Materials and Methods
115 patients with at least 30% carotid luminal stenosis diagnosed by ultrasound angiography visited were recruited and underwent hrMRI examination on a 3.0T MR (Discovery 750, GE Healthcare, USA) with an 8-channel carotid coil. The protocol of hrMRI contained 2D T1- and T2-weighted double inversion recovery fast spin echo (FSE) and proton density (PD) weighted FSE. T2WI was segmented manually using ITK-SNAP (www.itksnap.org). All the patients were divided into symptomatic plaque (SP) and asymptomatic plaque (ASP) groups. SP is diagnosed as follows: a) an acute ischemic stroke within the last 7 days, including patients with a symptom duration of ≤ 24 h who had met the World Health Organization definition of transient ischemic attack but had a documented acute ischemic infarct, b) patients who had a corresponding unilateral infarct restricted to the territory of a single carotid artery defined by diffusion-weighted imaging, c) at least 30% carotid luminal stenosis, and d) thickness of plaques confirmed to be larger than 2 mm. Radiomics features were extracted using the Analysis Kit Software 3.1.0 (GE Healthcare, USA). Max-Relevance and Min-Redundancy (mRMR) and Least Absolute Shrinkage and Selection Operator (LASSO) were employed for an optimized model. Radscore was applied to build a diagnostic model with hrMRI texture features and patient demography and demonstrate the power in differentiating SP and ASP. The statistics were carried out using R 3.6.1 (http://www.Rproject.org) (Fig. 1).Results
75 SPs and 40 ASPs (age, 54.0±12.9 year; BMI, 23.63±2.24 kg/cm2) were used for the final analyses. The lesions were randomly distributed as training and testing groups in a ratio of 7:3. A total of 1121 features were initially extracted from T2WI. After the mRMR operation, 30 features were retained by LASSO for both weightings. The log λ (0.0086) identified 16 features of the T2WI. In the training group, the laboratory examinations such aslow-density lipoprotein (LDL) (p=0.013), high-density lipoprotein (HDL) (p=0.000), and LDL/HDL ratio (LHR) (p=0.000) were significantly different between SP and ASP patients (Table 2). The plaque composition, IPH (p=0.0001) and LRNC (p=0.001), were significantly different between SP and ASP patients. Age (p=0.001) was significantly different in the test group. LDL (odds ratio [OR]=9.10), HDL (OR=0.019), LHR (OR=5.31), IPH (OR=9.33), and LRNC (OR=6.56) were maintained owing to a variance inflation factor (VIF) ≤5. LHR, IPH, and LRNC were used to build a clinical model and a combined model based on the minimal AIC principle. LHR, IPH, and LRNC were used to construct a clinical model and the Rad_clin_model was constructed combined with the Radscore. The clinical model (p=0.003 vs. p=0.007) and Rad_clin_model (p=0.004 vs. p=0.0001) showed significant differences between SPs and SAPs in the training and test groups. The Rad_clin model yielded the largest AUC of 0.929 (95% confidence intervals [CI], 0.881–0.982) in the training group and 0.912 (95%CI, 0.810–1.000) in the test group, which showed significant differences between the clinical model (p=0.023) and Radscore (p=0.013) in the training group, but not in the test group (p=0.090 vs. p=0.155). The Radscore was not significantly different from the clinical model in both the training group (p=0.782) and the test group (p=0.852). The Hosmer-Lemeshow test in the Rad_clin model showed no significant differences in the goodness-of-fit for the training group (p=0.454) and test group (p=0.7442).Discussion and Conclusions
In this study, we built a multivariable logistic regression model with the highest diagnostic performance to identify SPs via extracting high-throughput texture features from T2WI of carotid atherosclerotic plaques in combination with patient clinical risk. Joint analysis of radiomics and clinical features could be of great significance in the differential diagnosis of other indistinguishable diseases. This study demonstrated that the SP of carotid plaques could be assessed using a T2WI-based radiomics model, constructed using a radiomics signature and clinical data.Acknowledgements
No acknowledgement found.References
1. J. F. Fairhead, Peter M. Rothwell (2005). The Need for Urgency in identification and treatment of symptomatic carotid stenosis is already established. Cerebrovasc Dis 19: 355-358 2. Barrnelt HJM, Taylor DW, Haynes RB, Sackett DL, Peerless SJ, Ferguson GG, Fox, AJ, et al. North American Symtomatic Carotid Endarterectomy Trial Collaborators (1991) Beneficial effect of carotid endarterectomy in symptomatic patients with high-grade carotid stenosis. N Engl J Med 235: 445-453 3. LeFevre ML, U.S. Preventive Serviced Task Force (2014) Screening for asymptomatic carotid artery stenosis: U.S. Preventive Services Task Force recommendation statement. Ann Intern Med 5: 356-362. 4. Rothwell P M, Gibson R, Warlow CP (2000) On behalf of the European Carotid Surgery Trialists, Collaborative Group. Interrelation between plaque surface Morphology and degree of stenosis on carotid angiograms and the risk of Ischemic stroke in patients with symptomatic carotid stenosis. Stroke 31: 615–621. 5. Van Dijk AC, Truijman MT, Hussain B, Zadi T, Saiedie G, de Rotte AA, Liem MI, et al (2015) Intraplaque hemorrhage and the plaque surface in carotid atherosclerosis: the plaque at RISK study (PARISK). AJNR Am J Neuroradio 36: 2127-2133. 6. Kolossvary M, Karady J, Kikuchi Y, Ivanov A, Schlett CL, LU MT, Foldyna B, et al (2019) Radiomics versus Visual and Histogram-based Assessment to Identify Atheromatous Lesions at Coronary CT Angiography: An ex Vivo Study. Radiology 93: 89-96.Figures
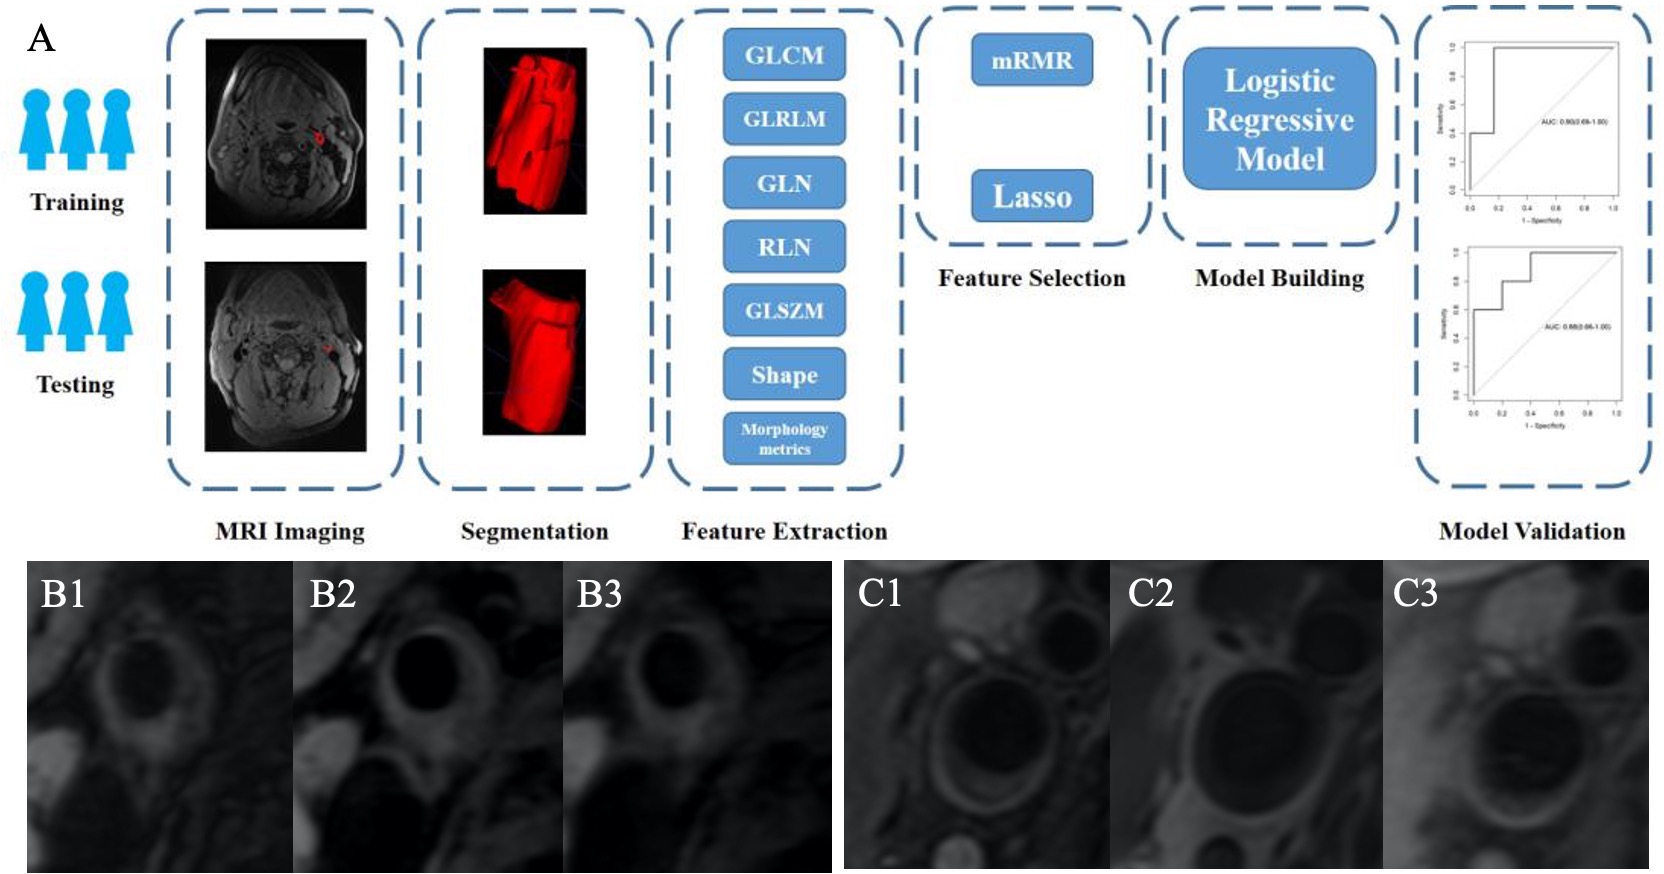
Fig. 1. A. Flowchart of vulnerability plaque
model development. The steps included were as follows: (1) date classification,
(2) magnetic resonance imaging (MRI), (3) region of interest (ROI)
segmentation, (4) feature extraction, (5) feature selection, (6) model building,
(7) model validation. B. vulnerability plaque (B1. T2WI, B2. T1WI, and B3.
PDWI), C. Stability plaque (C1. T2WI, C2. T1WI, and C3. PDWI)
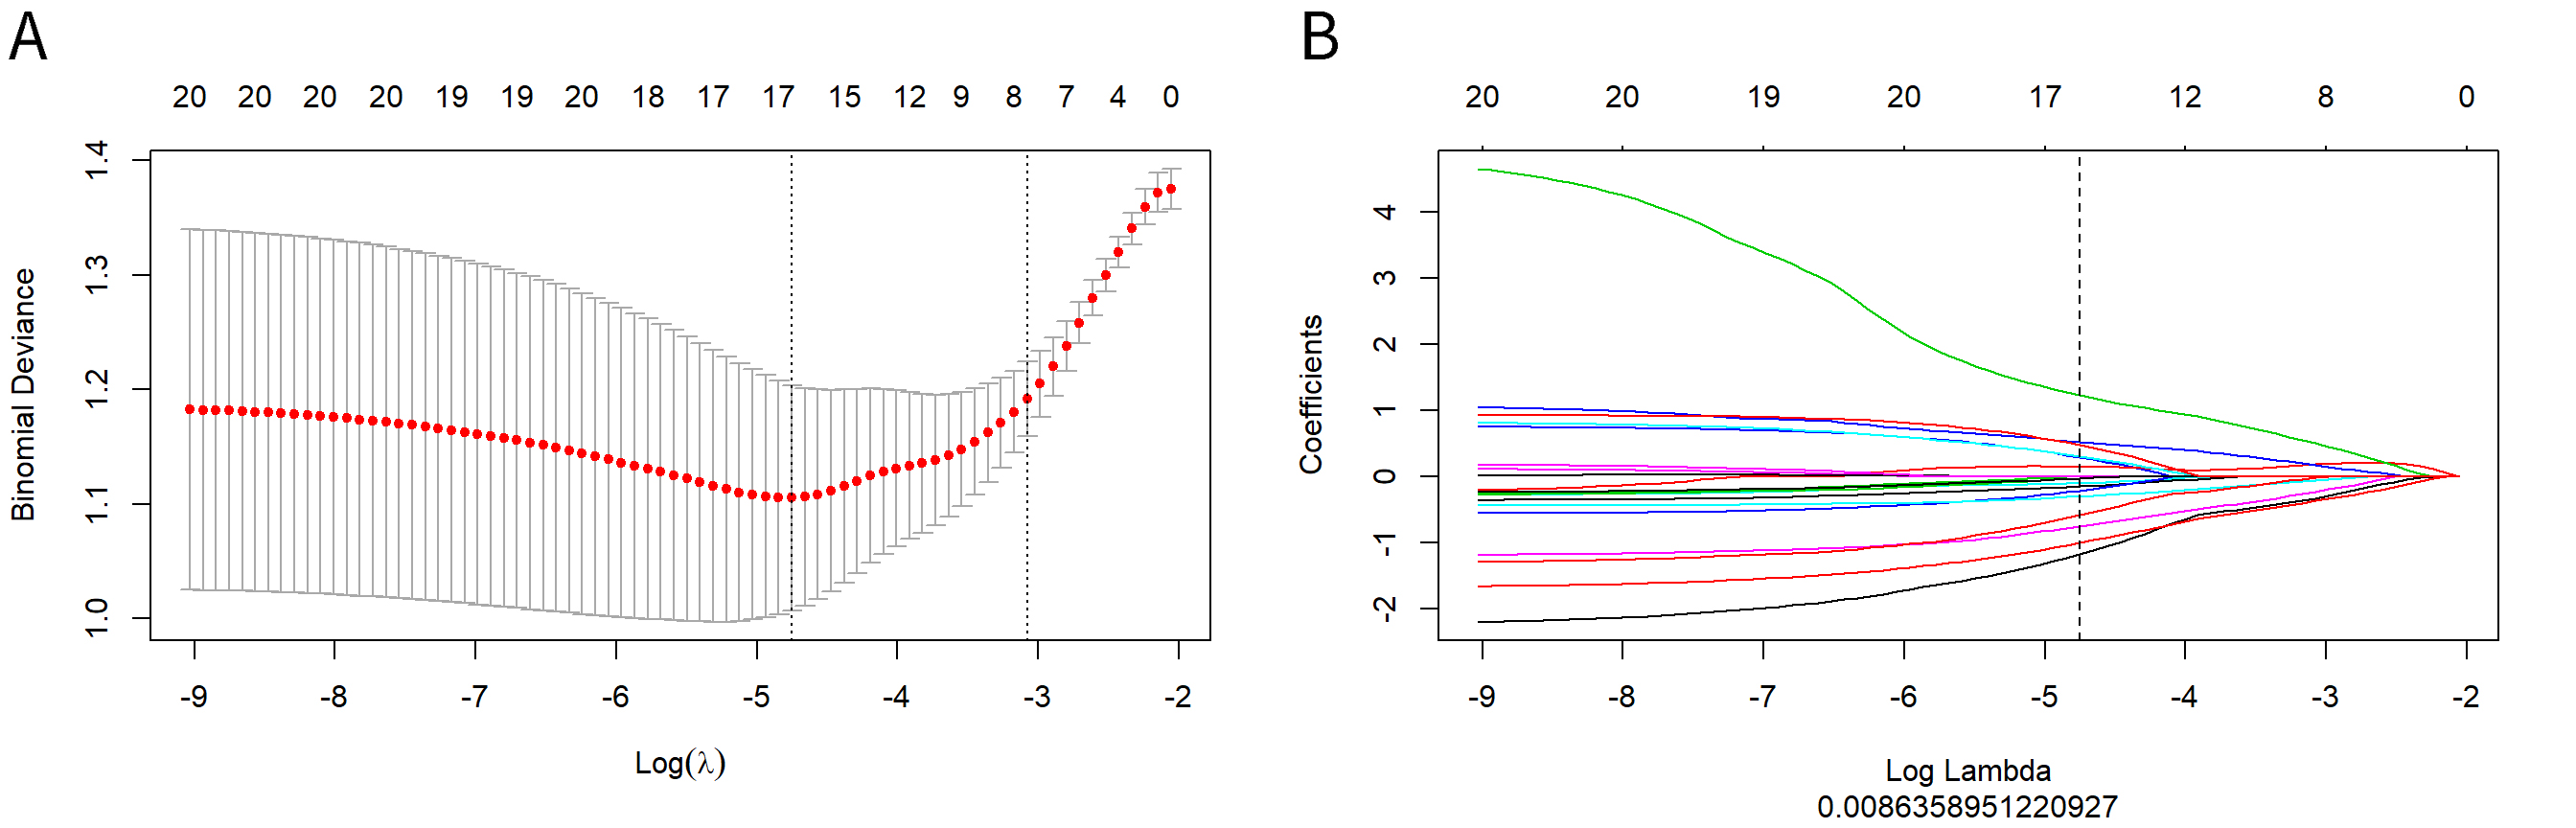
Fig. 2. Texture feature selection using the
absolute shrinkage and selection operator (LASSO) binary logistic regression
model. A. The penalty term (λ) in the lasso model was selected through 10-fold
cross validation which is based on minimum criteria. B. LASSO
coefficient profiles of the 16 features. The dotted vertical line was drawn at
the value where log λ (0.008) resulted in eight non-zero coefficients.
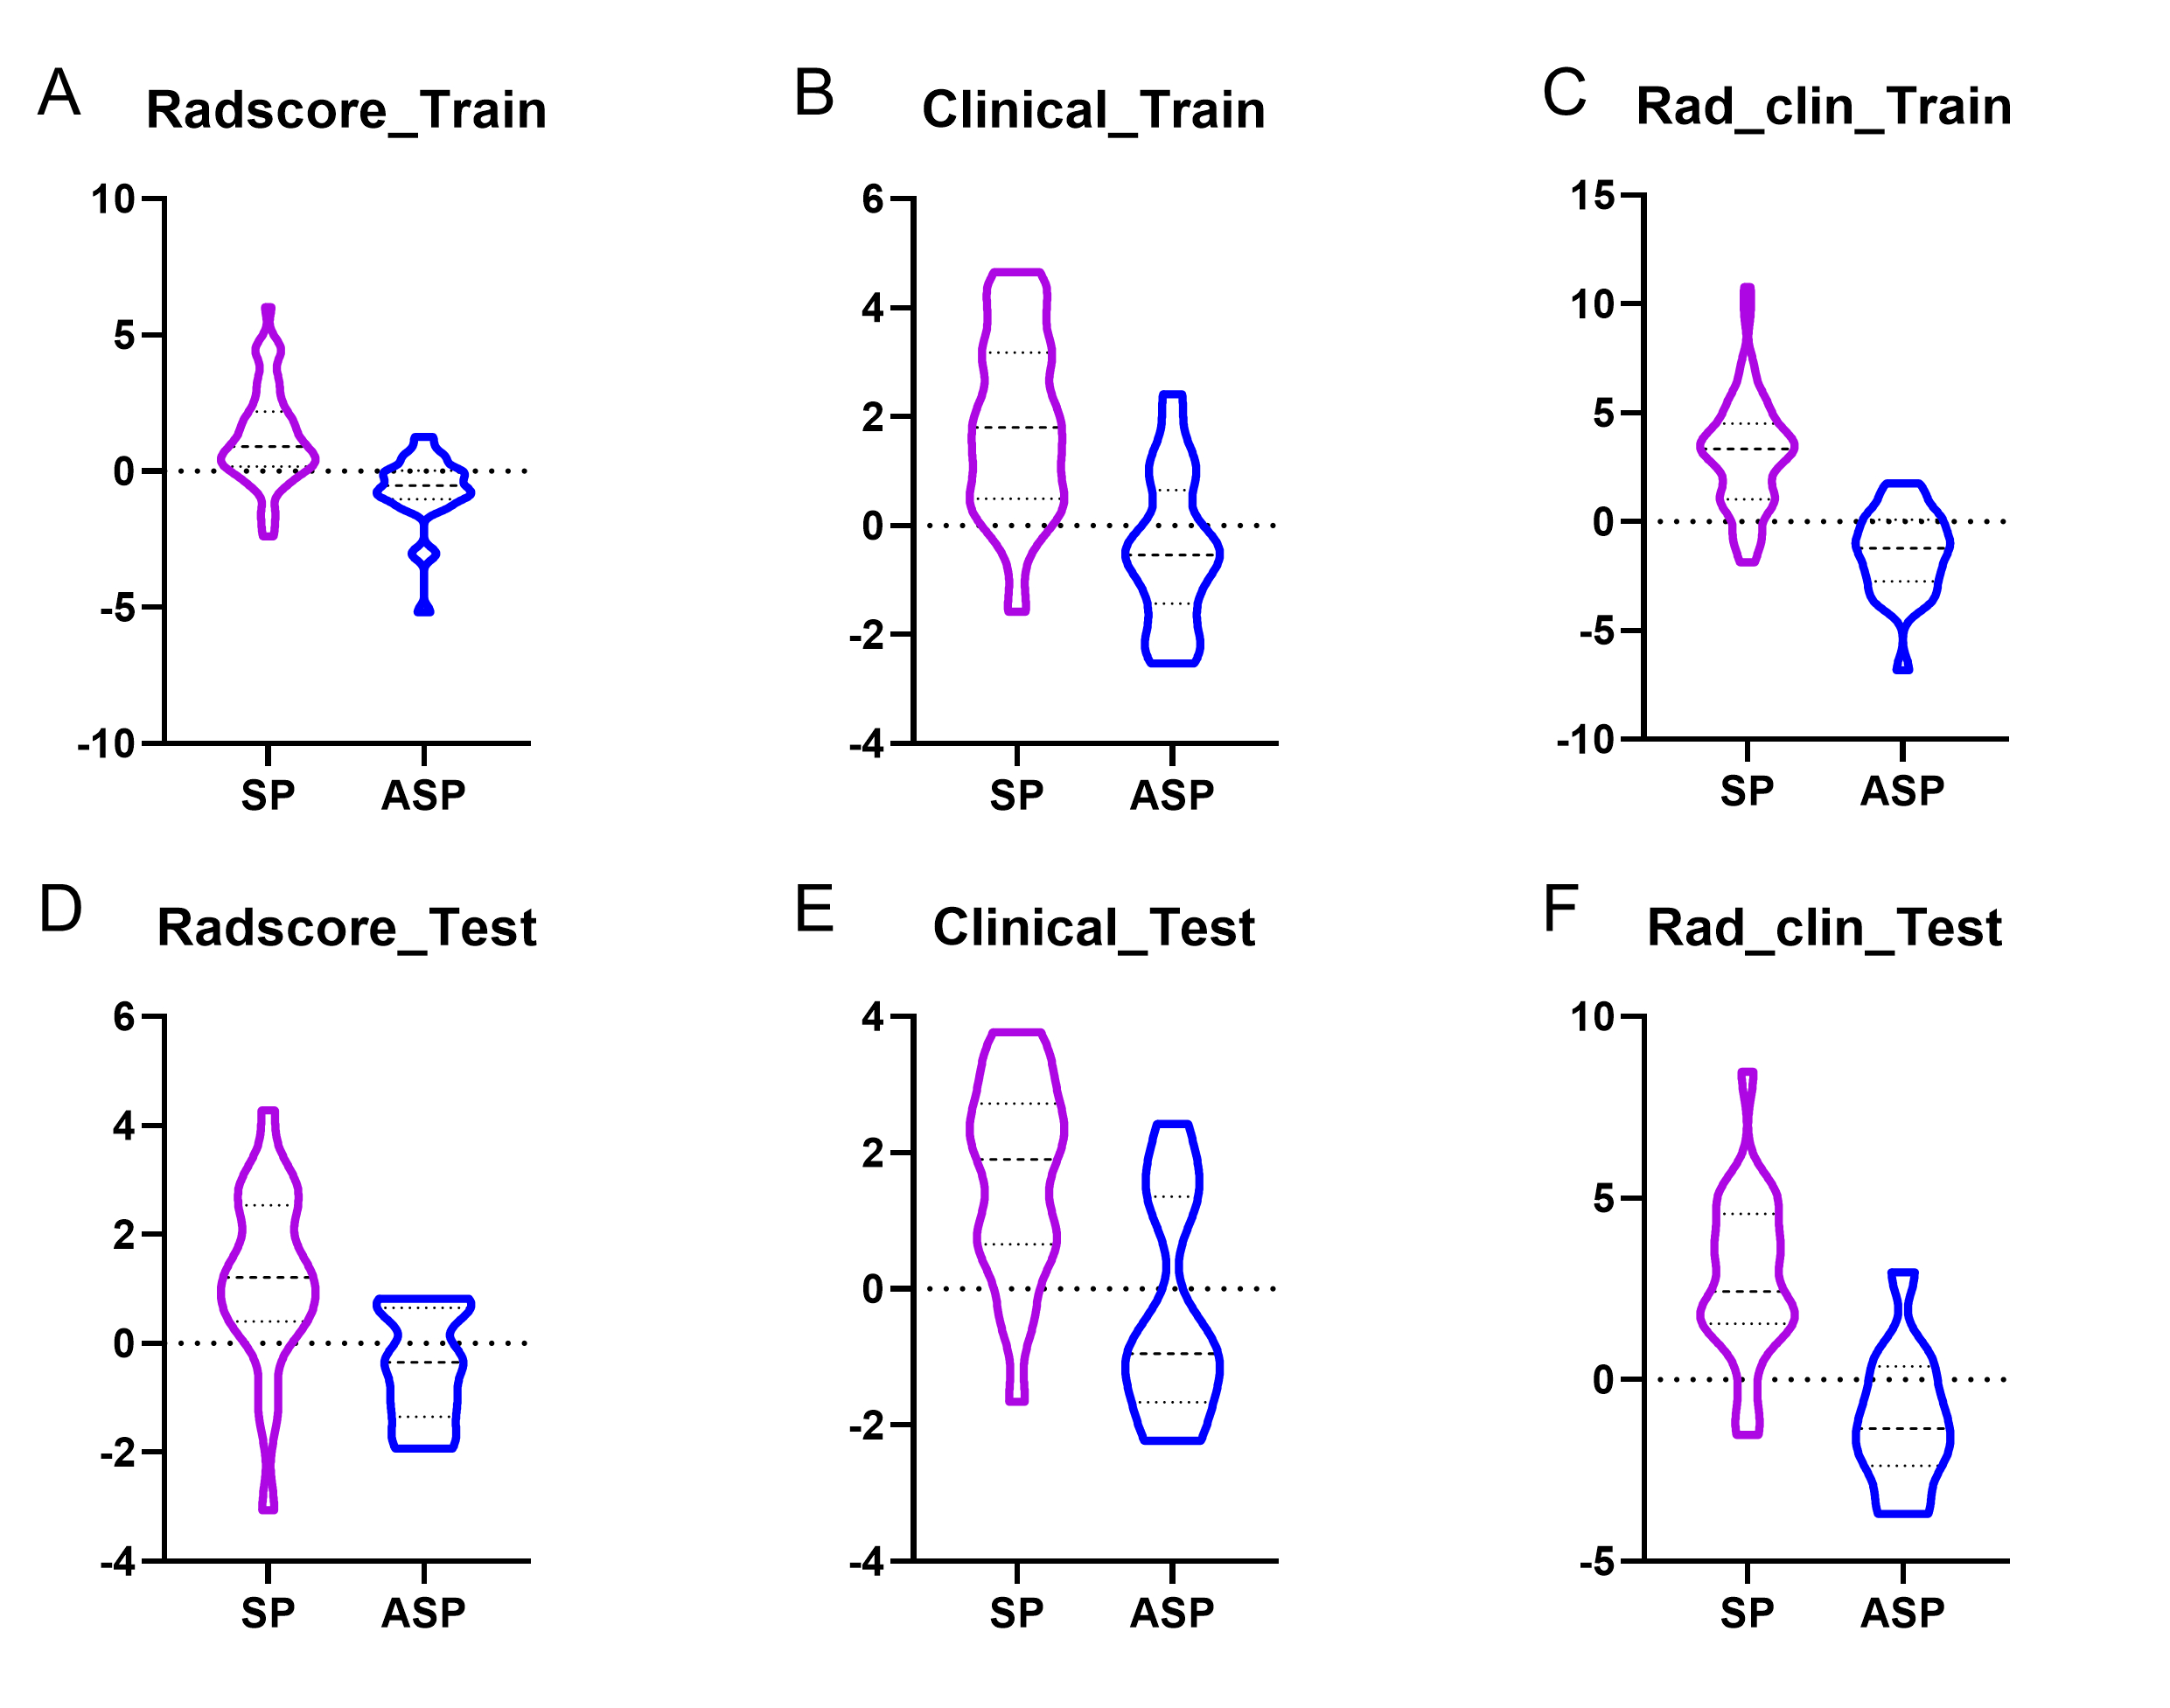
Fig. 3. Boxplots showed the Radscore,
clinical model, and Rad_clin model value of SPs and ASPs in the training and
testing groups. A & D, Radscore in training group and test group; B &
E, Radscore in training group and test group; C & F, Radscore in training
group and test group.
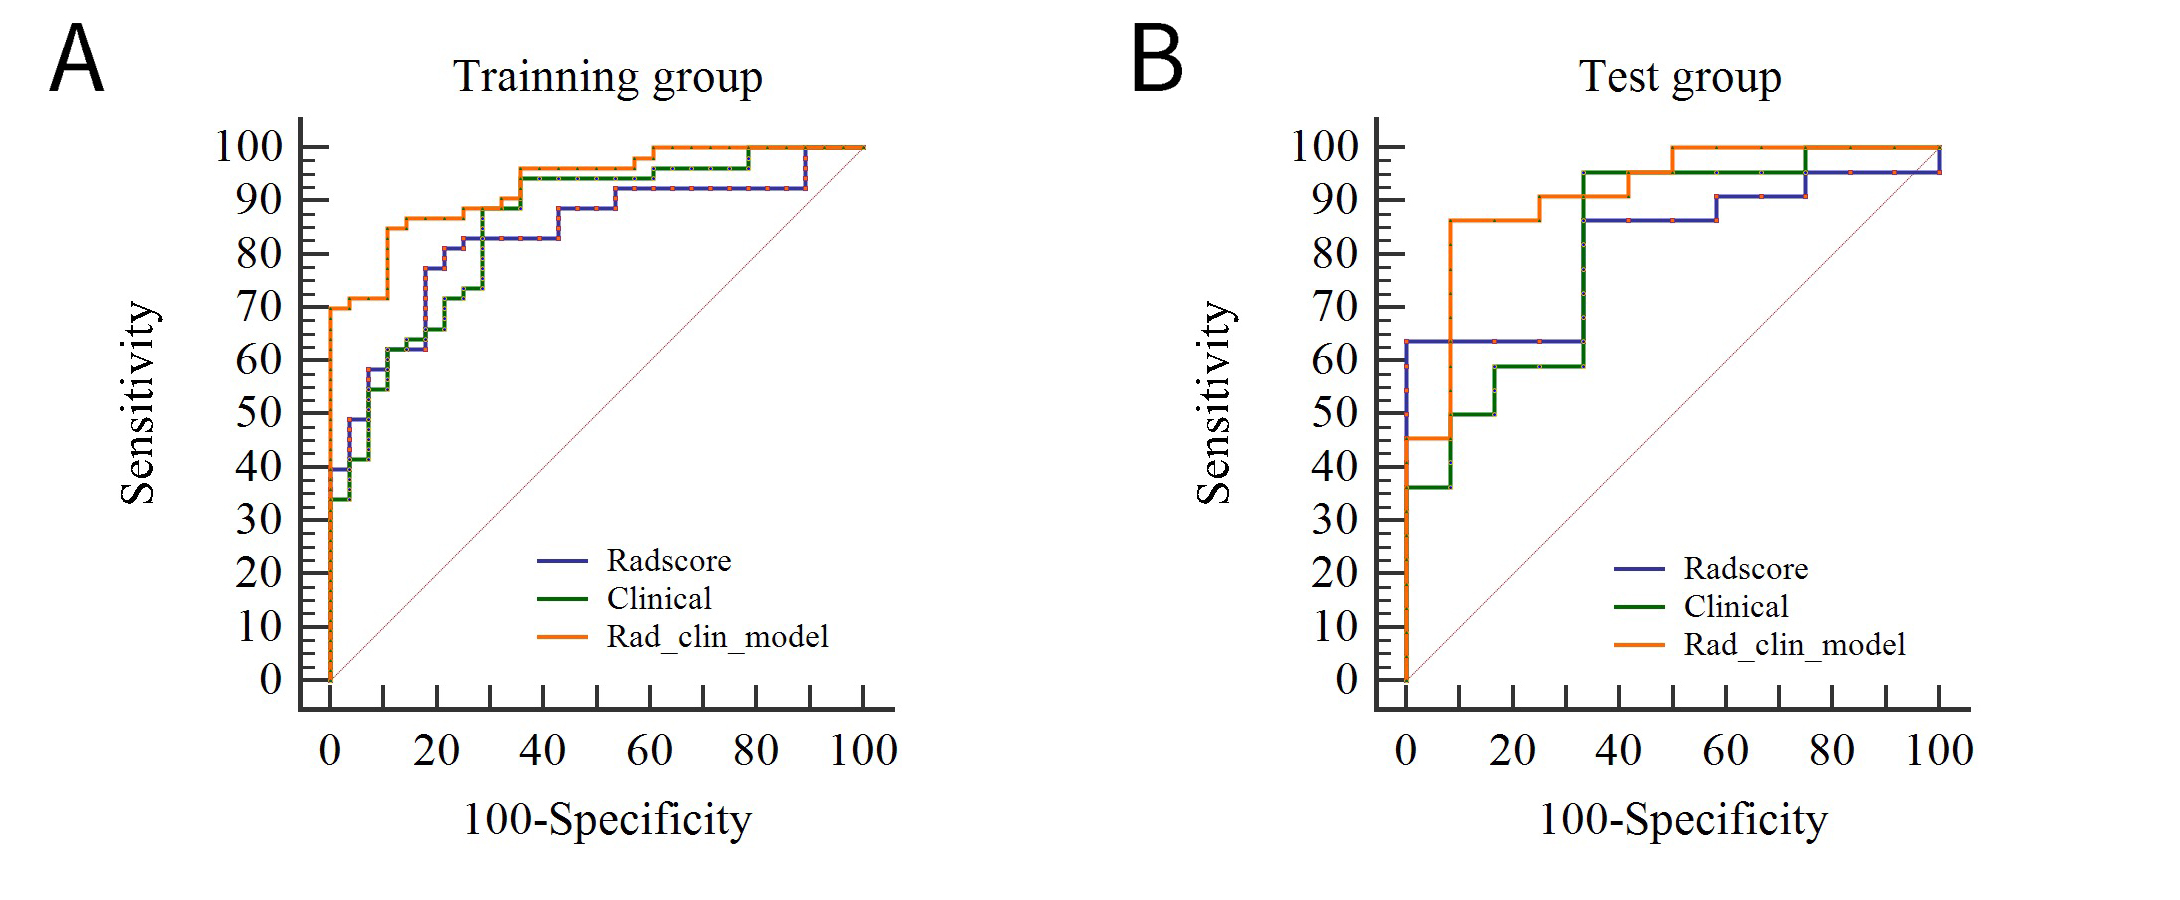
Fig. 3. Boxplots showed the Radscore,
clinical model, and Rad_clin model value of SPs and ASPs in the training and
testing groups. A & D, Radscore in training group and test group; B &
E, Radscore in training group and test group; C & F, Radscore in training
group and test group.
DOI: https://doi.org/10.58530/2022/1921