1919
A proposed method to objectively quantify hippocamapal dentation through midlayer AUC analysis1Neurology, University of Alabama at Birmingham, Birmingham, AL, United States, 2Neurology, Birmingham VA Medical Center, Birmingham, AL, United States
Synopsis
We present a novel method to objectively quantify a morphological feature known as hippocampal dentation from ultra high resolution 3D T2w images.
INTRODUCTION
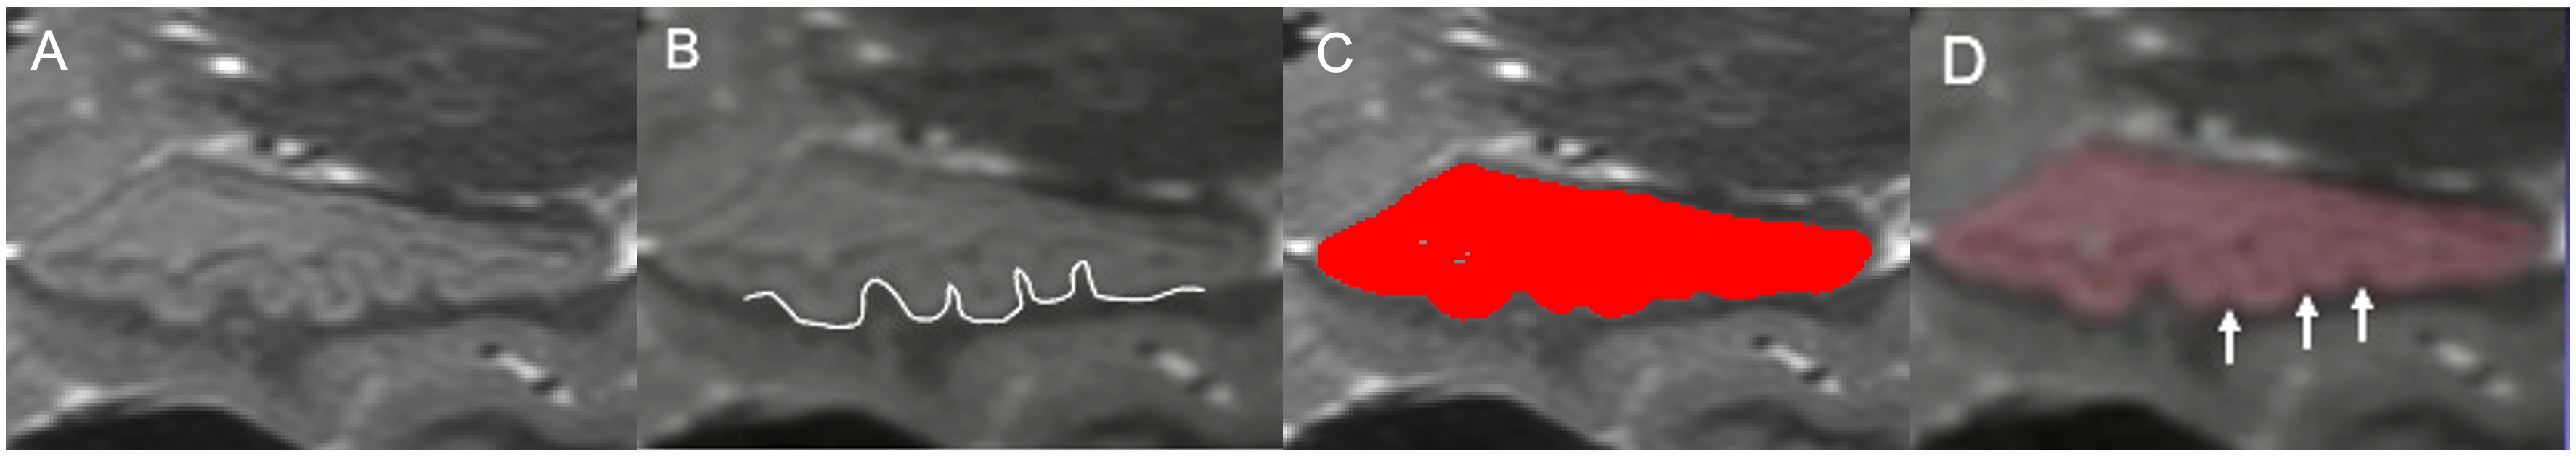
Hippocampal dentation (HD) is a feature of human hippocampal morphology that refers to surface convolutions seen in the CA1 region (Figure 1) of the inferior aspect of the hippocampus. The degree of HD is highly heterogenous, ranging from quite bumpy to smooth in the hippocampi of healthy individuals. We have previously quantified HD based on a subjective visual rating system and reported that HD is positively correlated with memory performance1. Recently, we have developed an objective method based on high resolution hippocampal segmentations to quantify HD by transforming a strip of a 3D surface mesh that captures the prominence of dentation into a dimensionally reduced 2D plot with the characteristic undulations of HD2. Then after filtering out the low frequency components, the area under the curve of the 2D plot is measured, yielding a quantity that reflects the degree of HD. We found that the AUC values were significantly correlated with subjective visual assessment of HD but did not significantly correlate with memory performance in initial analysis. The main limitation of this approach is that the segmentation under-estimates the depth of prominent dentes on the 3D surface rendering and does not closely match the complexity of the contour visible on 2D images (Figure 1C, D). Consequently, the AUC values don’t fully capture the visually salient prominence of dentation in many cases.METHODS
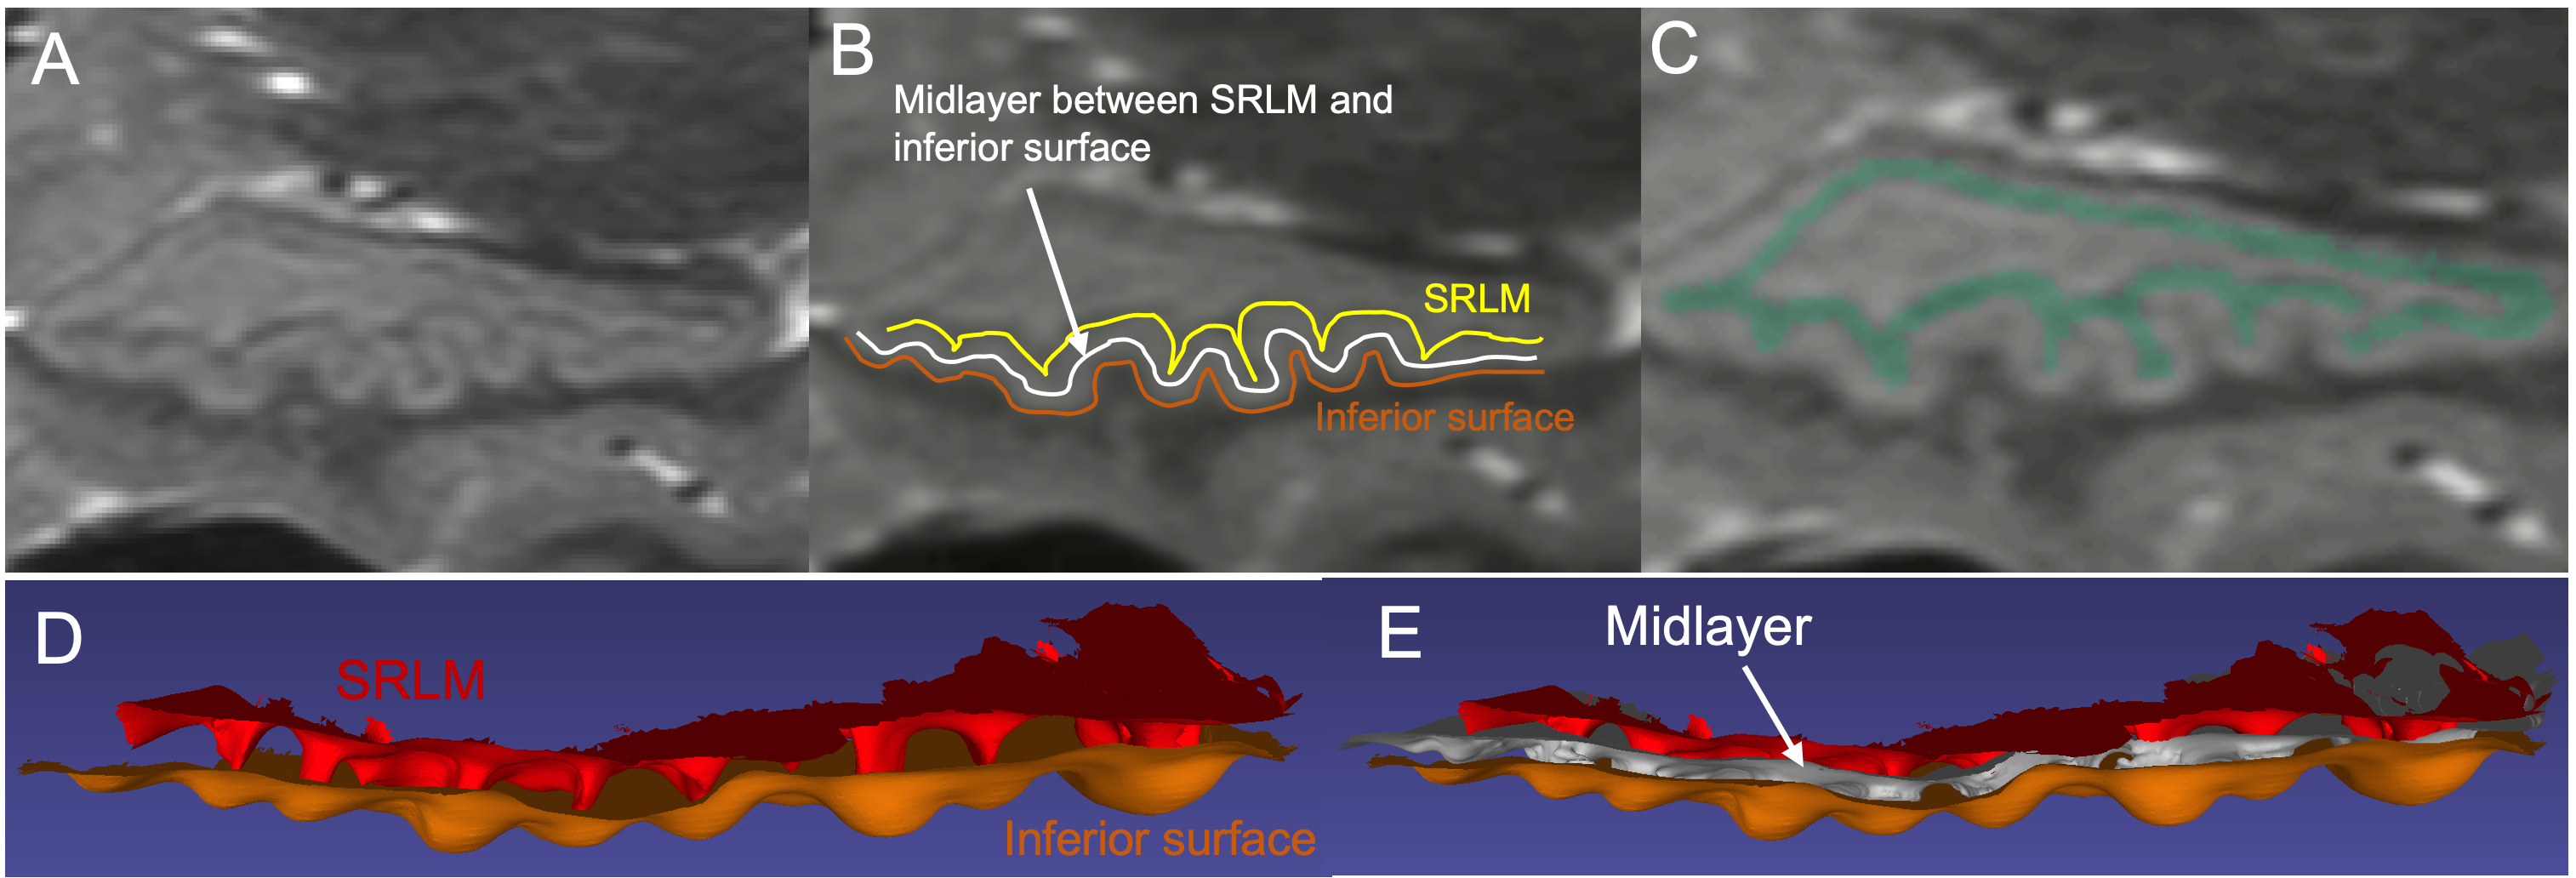
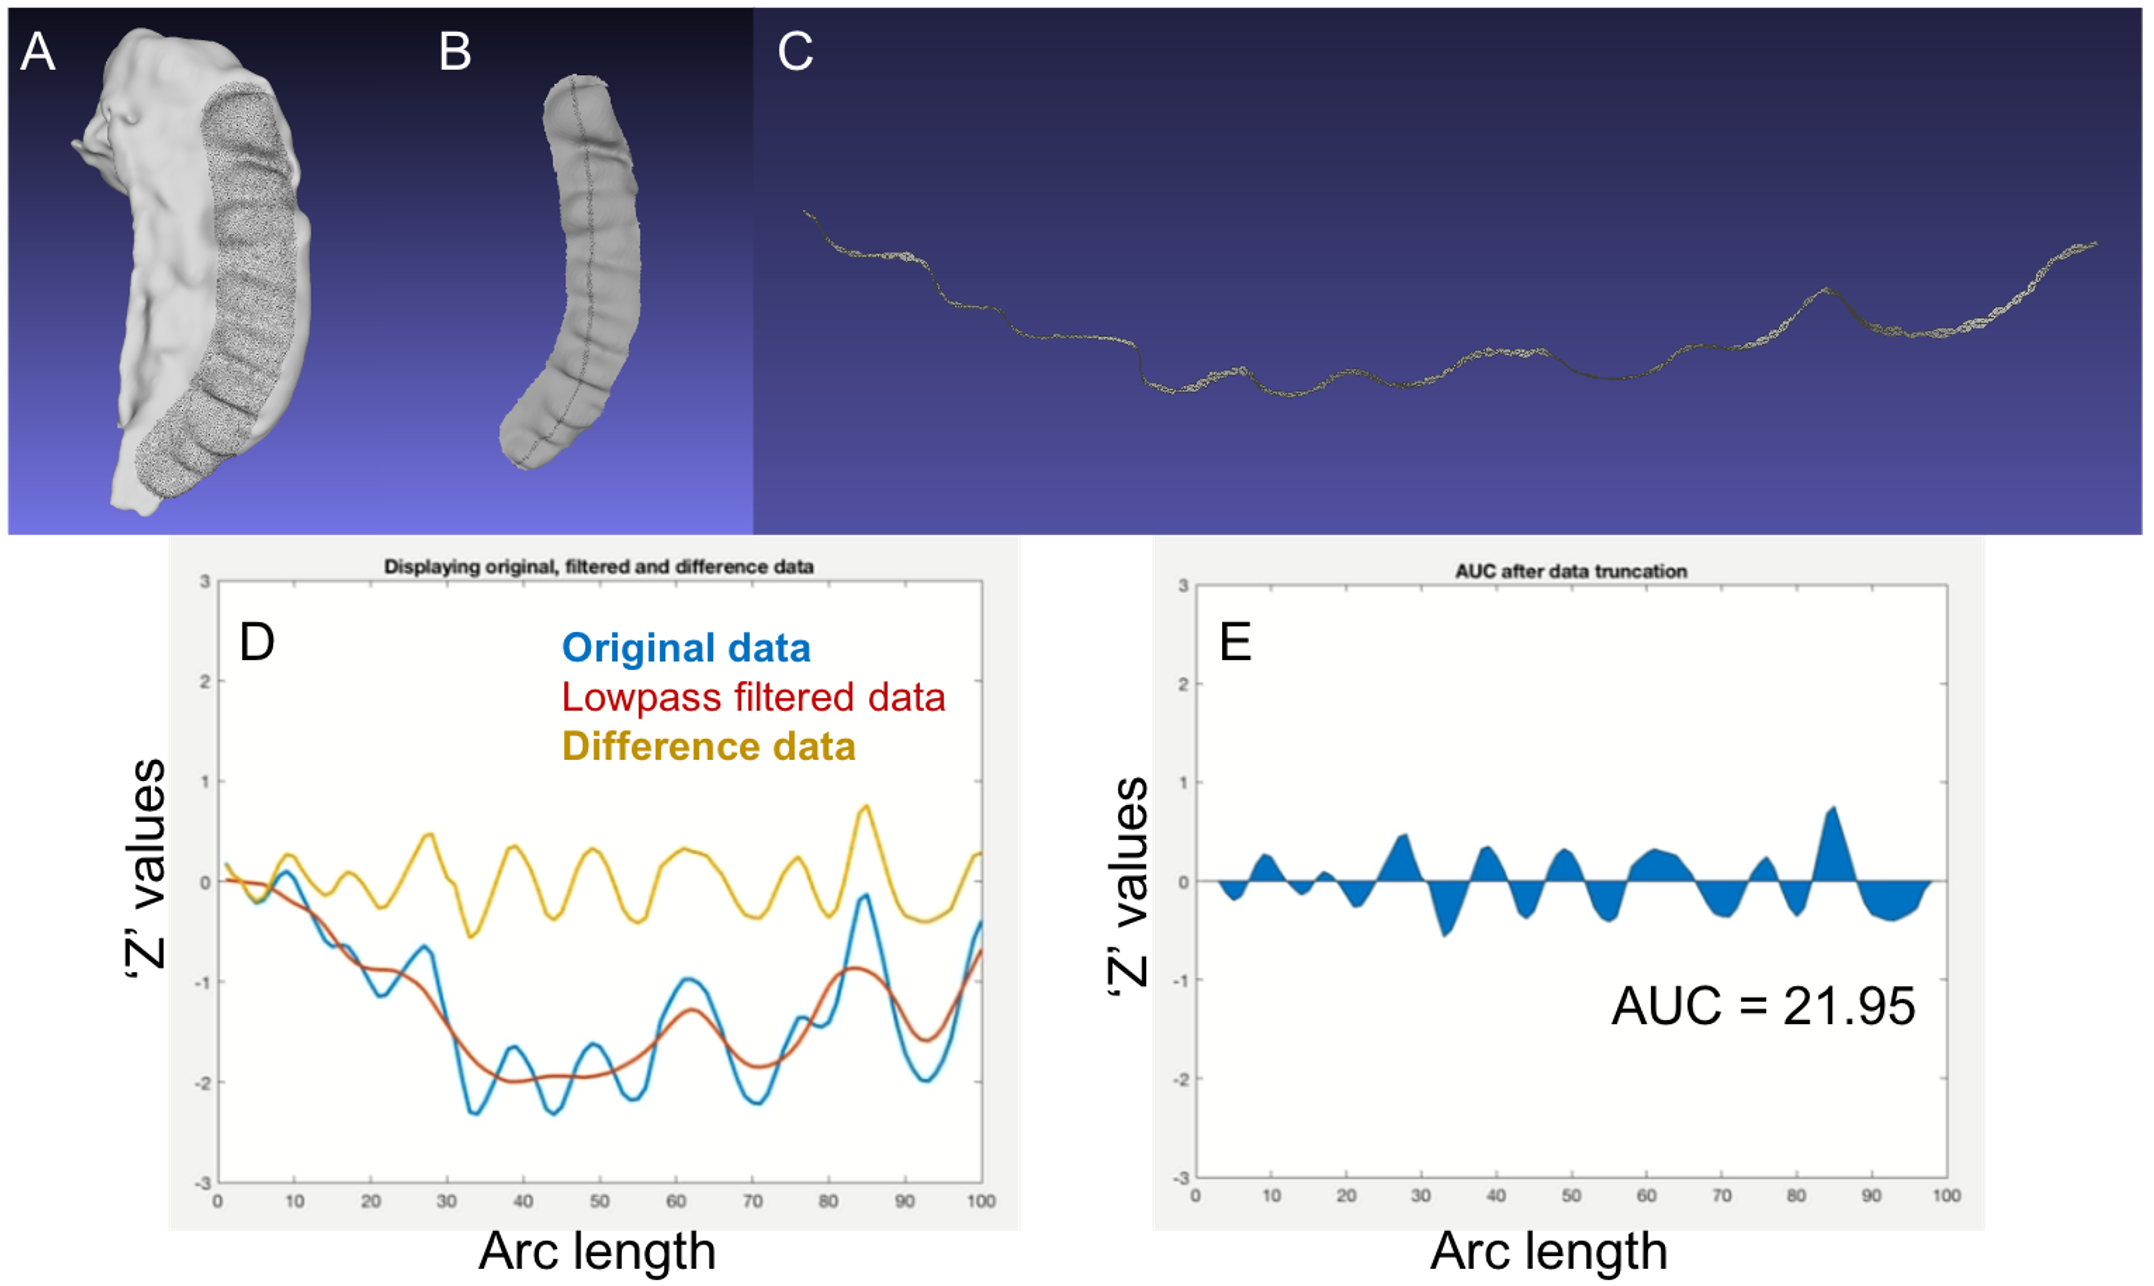
We hypothesize that performing AUC analysis on a surface representing the middle of CA1 layer (the “midlayer”) would capture HD more accurately than on the inferior surface of a volumetric segmentation of the whole hippocampus. To overcome this shortcoming, we generate a midlayer surface by finding the set of points half-way between the inferior surface of the CA1 and the inferior surface of the dark band of the SRLM (strata radiatum, lacunosum, and moleculare), which is the boundary between CA1 and the dentate gyrus (Figure 2). Visualizing the SRLM accurately requires use of T2w images acquired as a 3D volume with submillimeter resolution in all three directions, such as our HR-MICRA dataset3. This midlayer is used for AUC analysis. To demonstrate this method, a prominently dentated (bumpy) hippocampus was considered and SRLM was segmented manually in all the three planes (Figure 2C). The midlayer was obtained by finding the midpoint of the shortest line connecting each point of SRLM to the CA1 using a MATLAB script. This generates a point cloud dataset that can be converted into a midlayer surface mesh (Figure 2E), upon which our AUC method was applied. The AUC method consists of (1) drawing/selecting a narrow strip of vertices on the surface mesh along the most prominent portions of the dentes; (2) converting those points to a 3D curvilinear line; (3) dimensionally reducing the y component of the data to generate a 2D plot; (4) applying a Savitzky-Golay filter and removing the low frequency undulation that reflects the overall curvature of the hippocampus; and (5) calculating area under the curve as illustrated in Figure 3.RESULTS
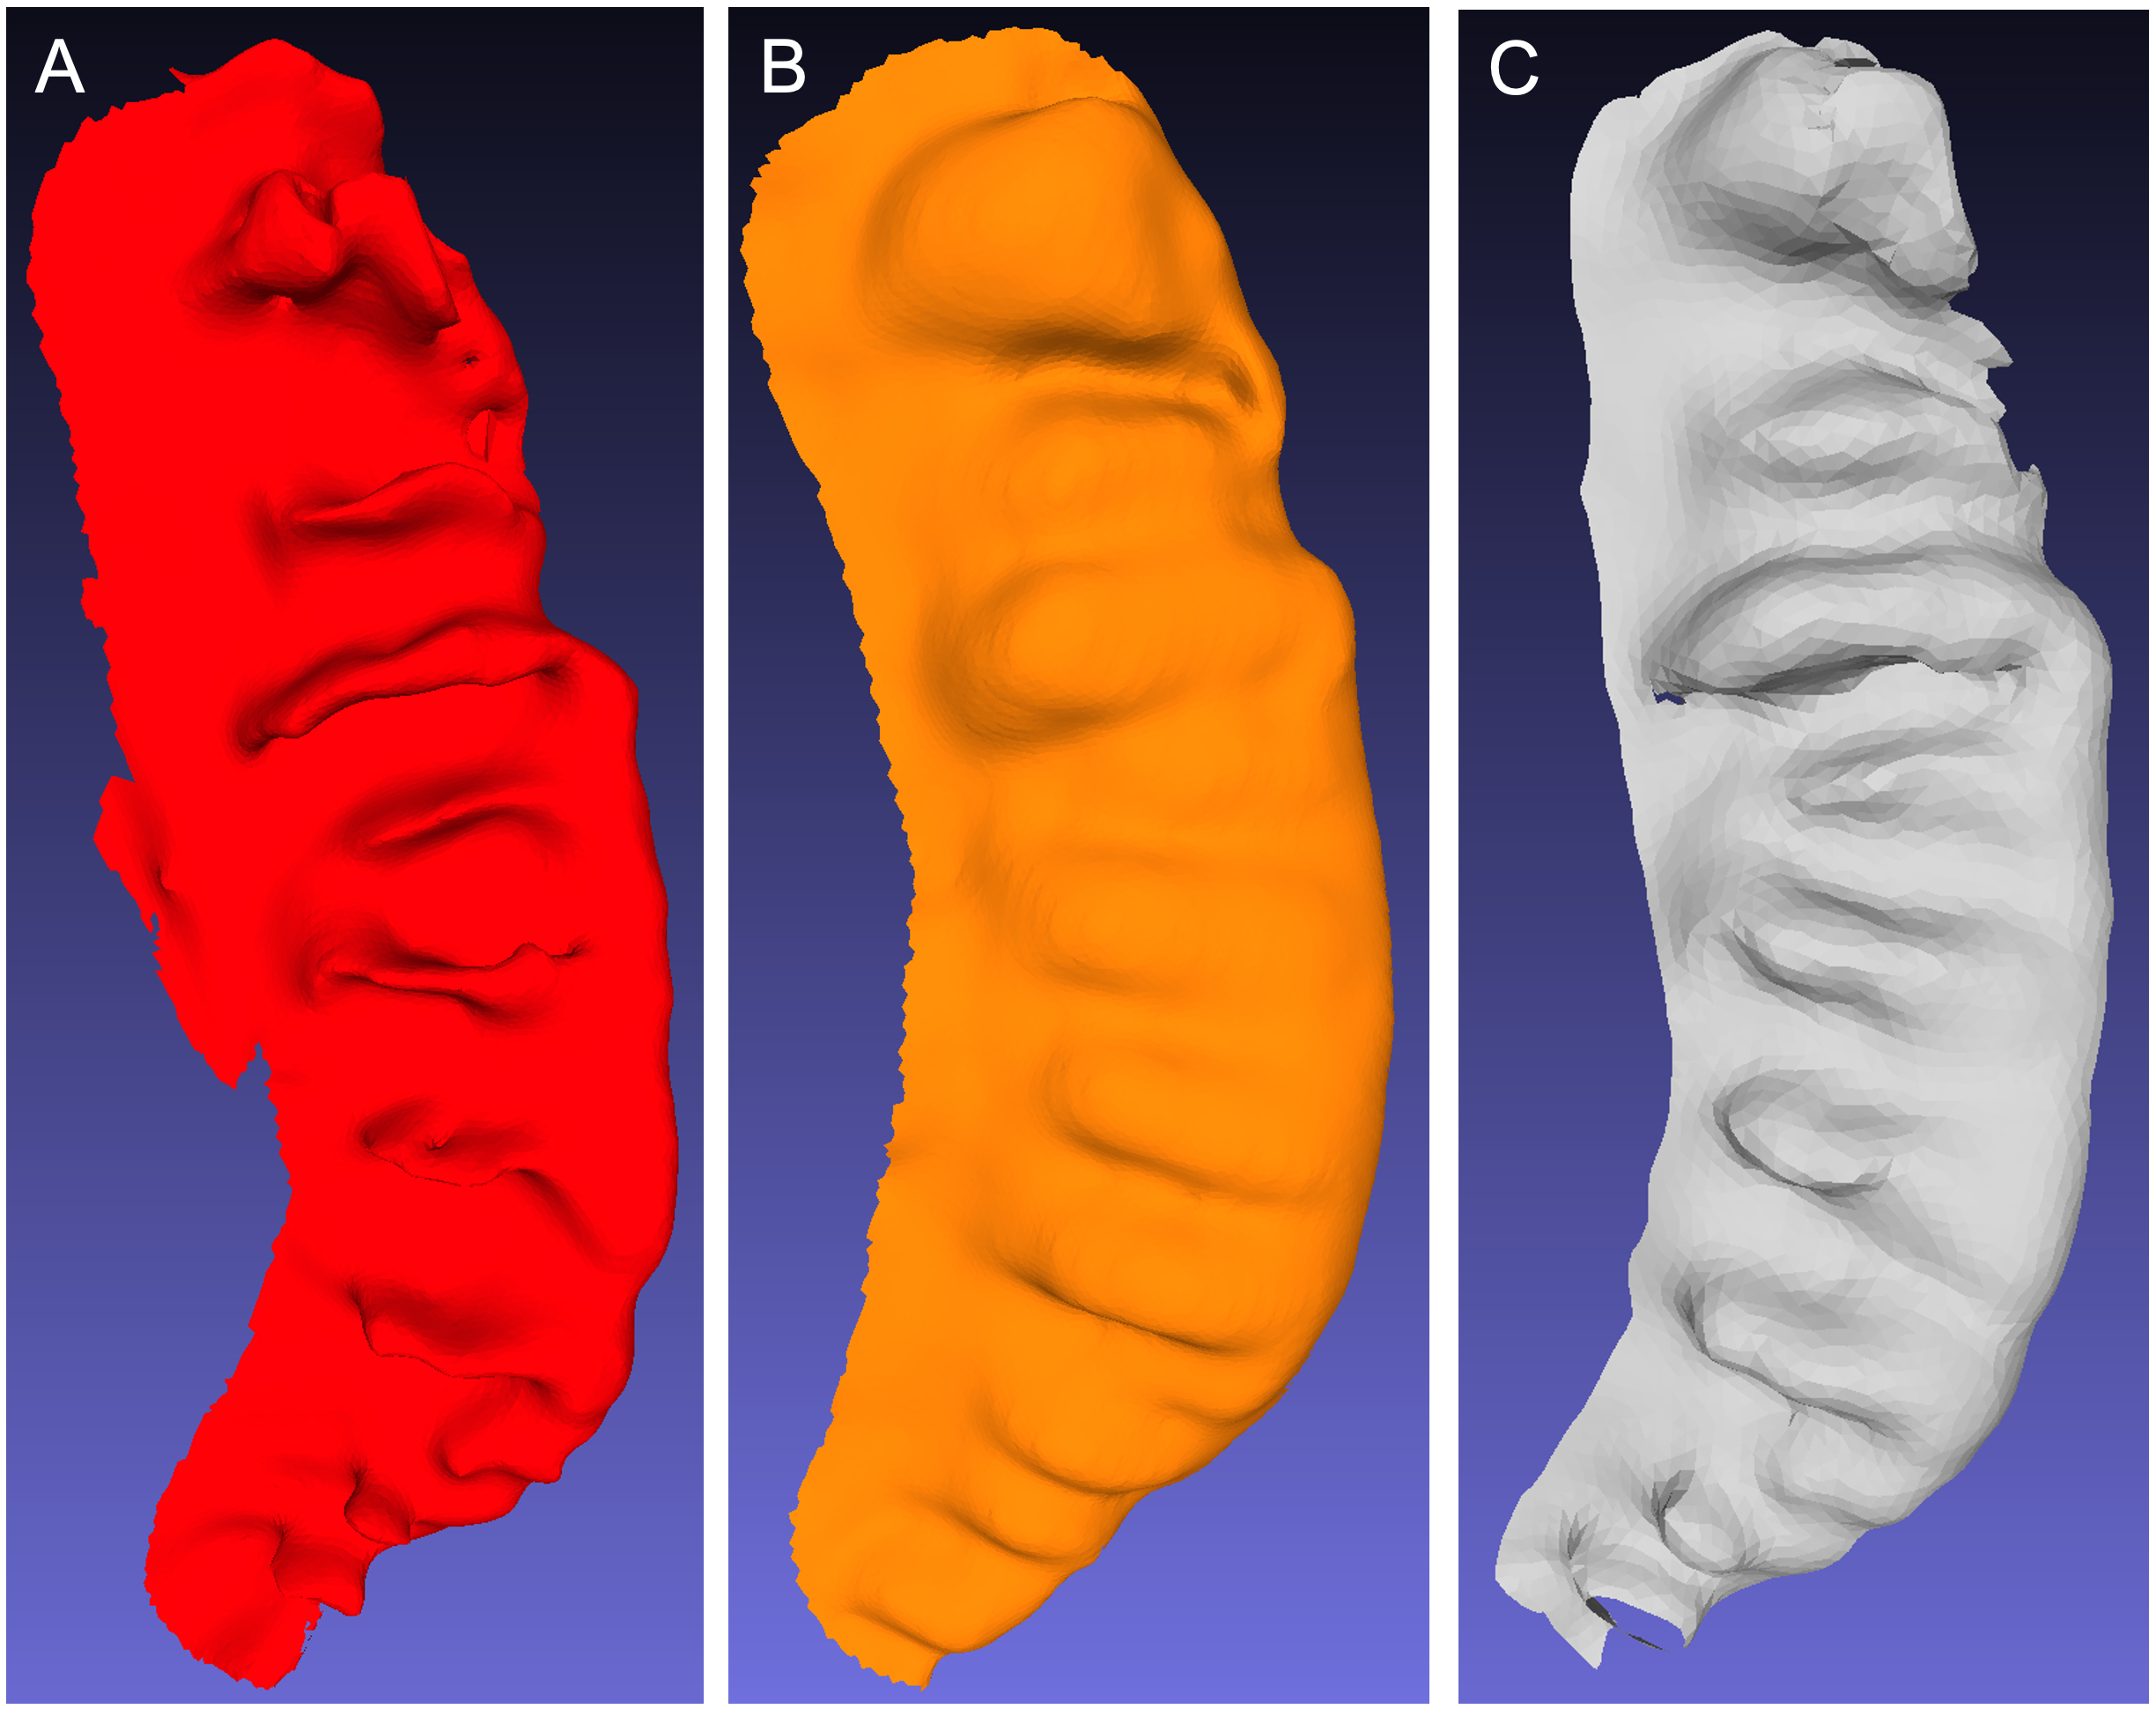
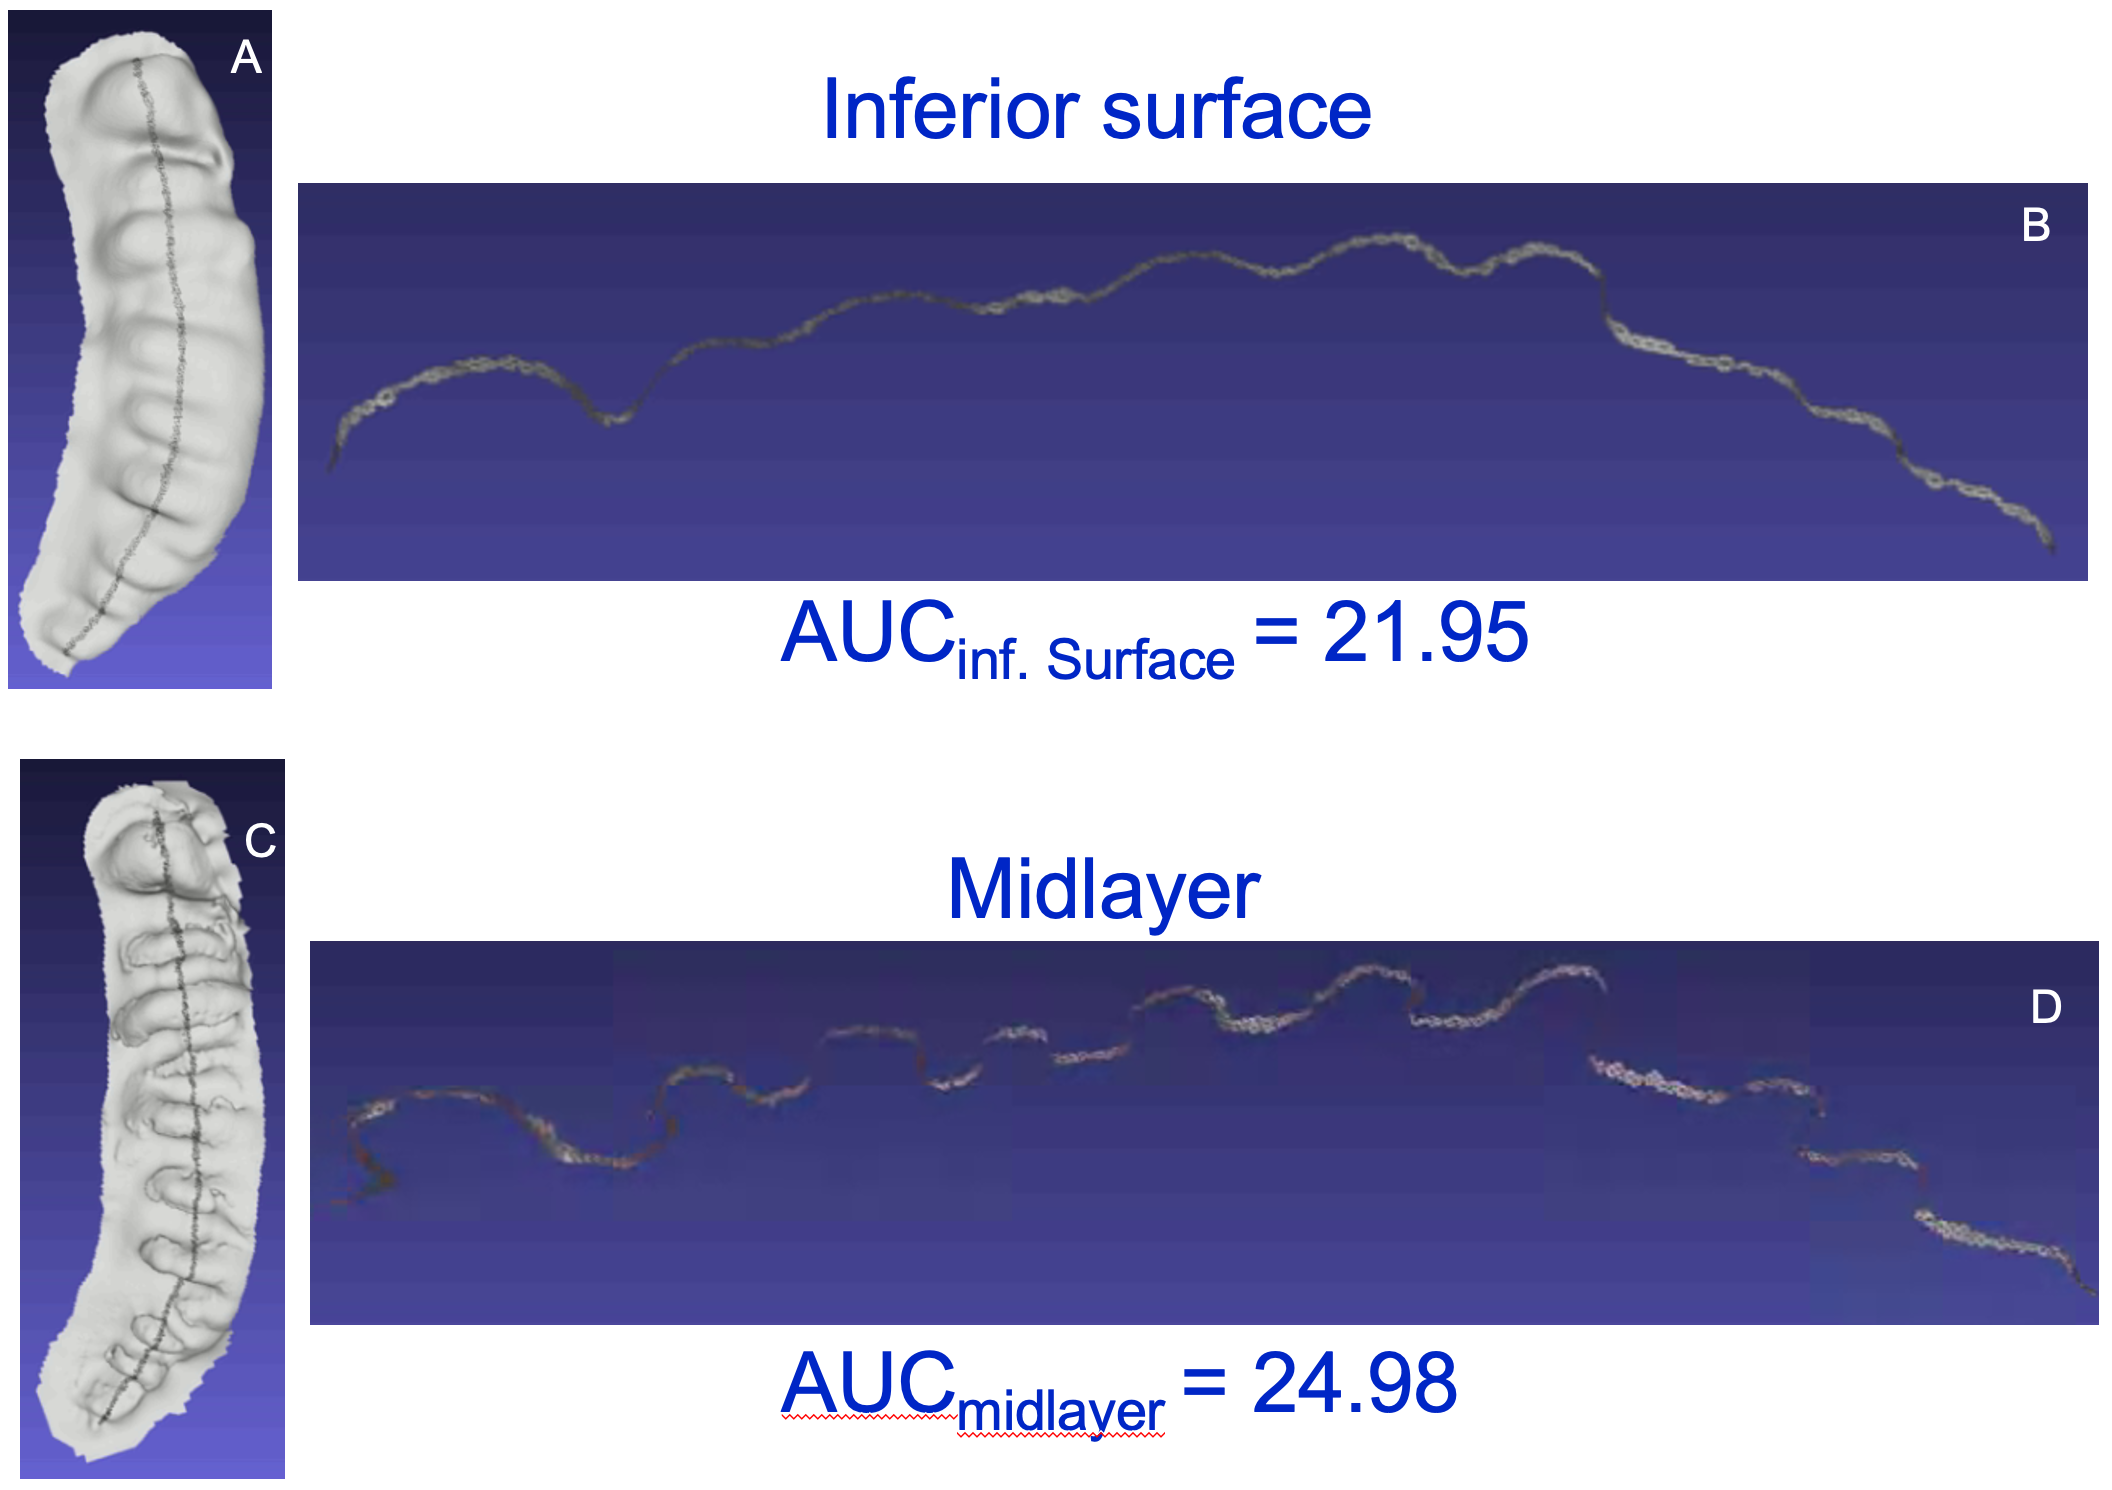
As seen in Figure 4, the topologic complexity of the surface contour due to HD is represented more prominently on the midlayer (4C) compared to the inferior hippocampal surface (4B). Comparison of the surfaces of the inferior hippocampus and midlayer show that the dentation was found to be more prominent on the midlayer than observed on the CA1 region (Figure 5) from the same hippocampus. Consequently, the modified AUC value obtained from the midlayer (AUCmidlayer=24.98) was greater than inferior surface (AUCinf. surface=21.95).DISCUSSION
Characterizing the morphology of a complex surface quantitatively with a single number is a difficult task. In considering several metrics, including total surface area, surface area to volume ratio, morphological closing, fractal dimensionality, absolute mean curvature maps, and projected surface area ratio, we found that none of these approaches were able to come close to correctly sorting a given set of hippocampi from least to most dentated using obvious visual assessment of dentation as the benchmark. The AUC approach applied to the inferior surface of the hippocampus was able to correctly sort hippocampi, but it had a harder time differentiating the full depth of deep dentes, which by contrast are quite visually salient on high resolution T2w images. In our previous work, we described these deep dentes as being “arciform”, which were weighted more heavily in dentation scoring than sinusoidal dentes, but both morphologies appear sinusoidal when only the inferior surface is used for AUC analysis. Analysis of the midlayer allows differentiation of arciform dentes from sinusoidal dentes. As such a prominently dentated hippocampus as shown in this proof-of-principle example has a greater AUC from the midlayer than the inferior surface, which would not be the case if the folds in the dentes were not deep.CONCLUSION
This method may have utility in quantitatively measuring the full range of dentation, allowing more sensitive detection of correlations between this morphologic feature and various neuropsychological factors. Future directions include replicating previously shown correlations between memory and dentation, and application to clinical populations diseases affecting the hippocampus such at temporal lobe epilepsy, Alzheimer’s disease, and Schizophrenia.Acknowledgements
This work was supported by NIH/NINDS R01NS094743References
1. Fleming Beattie, J., Martin, R. C., Kana, R. K., Deshpande, H., Lee, S., Cure, J. & Ver Hoef, L. 2017. Hippocampal dentation: Structural variation and its association with episodic memory in healthy adults. Neuropsychologia, 101, 65-75.
2. Ramaniharan AK, Selladurai G, Ver Hoef L. Hippocampal dentation-based differentiation of healthy controls and epileptic subjects using high resolution MR images. Society for Neuroscience. November 8-11, 2021.
3. Lawrence Ver Hoef; Hrishikesh Deshpande, MS; Joel Cure, MD; Goutham Selladurai, MD, MPH; Julia Beatte, PhD; Richard E. Kennedy, MD, PhD; Robert C. Knowlton, MD; Jerzy P Szaflarski, MD,PhD. Clear and Consistent Imaging of Hippocampal Internal Architecture with High Resolution Multiple Image Co-Registration and Averaging (HR-MICRA). Front. Neurosci., 11 February 2021
Figures