1918
The Feasibility of Meningeal Imaging using multi-echo gradient echo sequence mFFE with optimized scan parameters1Department of Radiology, Shengjing Hospital of China Medical University, Shenyang, China, 2Philips healthcare,Beijing,China, Beijing, China
Synopsis
At present, the detection of meningeal diseases is mainly based on MRI enhanced scan sequences, however, the poor image quality of affected the degree of meninges visualization due to the limited concentration of contrast agent staying in the meningeal after administration. In this study, the feasibility of meningeal imaging with multi-echo gradient echo MR sequence (Mffe) was explored, and optimized the main scan parameters. The optimal imaging parameters were obtained by analyzing the meninge-skull signal intensity ratio (SIR) and contrast-noise ratio (CNR) of healthy volunteers.
Introduction
Tissues with short T2 relaxation time, such as the normal morphological form of meninge[1, 2], is hard detected reliably by the traditional MRI pulse sequences due to the limitation of minimum echo time (TE). There were some studies had been reported to detect abnormal meningeal enhancement and morphological changes using contrast enhanced imaging sequences[3, 4]. However, the poor quality of the image quality and the degree of meninges visualization tend to be affected by the concentration of contrast agent and delay time after administration [5]. In addition, the contrast agent has certain renal toxicity, and it is impossible to test repeatedly by enhanced MRI.Therefore, this study aims to explore the feasibility of using the multi-echo gradient echo sequence (mFFE) in meningeal imaging.
Methods
25 healthy volunteers(age: 21~27; 11 male; 14 female)enrolled in this study were divided into two groups. All MR examinations were performed on a 3.0 T MR scanner (Ingenia CX, Philips Healthcare, the Netherlands) using 8 channel head coils. Axial multi-echo gradient echo (mFFE) sequences was used and some scan parameters, such as the number of acquisition (NSA), the second Echo Time (Sec_TE), Flip Angle (FA) and image subtraction weighting factor (ISWF), were optimal according to the image quality. The detailed parameters of the scanning sequence can be found in the Table 1, The post-processing process was as follows. Firstly, three layers of whole brain images with better visualization were selected from each sequence, rectangle ROImeninge was drawn according to the shape and the thickness of the brain convex meningeal, then meningeal mean signal intensity value was recorded (Figure 1). Secondly, the ROIskull of the same size and shape was copied to the skull near meninges and the mean signal intensity value was recorded. The sizes of ROIs of different sequences in the same layer of the same object were consistent. Finally, the Signal Intensity Ratio (SIR) and Contrast-Noise Ratio (CNR) between the meninges and the surrounding skull of different sequences from different objects were calculated, and the mean values of the three layers were used for the statistical analysis. IBM SPSS Statistics 26 software was used for data entry and statistical analysis. Data normality test and homogeneity of variance test were carried out by Explore and One-Way ANOVA. Logarithmic transformation was performed for data that did not conform to normal distribution. Quantitative data such as CNR and SIR were expressed as x±S (mean±standard deviation)and Two-Way ANOVA was conducted.Results
The signal intensity ratio (SIR) and contrast noise ratio (CNR) of meningeal and skull was no significant difference with variable Number of acquisitions (NSA) (Table 2, Table3). The CNR and SIR values of the images with echo time of 8ms, 10ms, 12ms and 15ms were significantly higher than those of the images with 5ms (CNR:P=0.029, 0.006, 0.002, <0.0001 for 8ms, 10ms, 12ms and 15ms; SIR:P<0.001 for all). The SIR results showed no significant difference with the echo time of 12ms and 15ms. The CNR obtained by FA of 5° is significantly better than those with FA of 10°, 20° and 30°(P<0.0005 for all, and the SIR with FA of 10° are significantly higher than those with FA of 5° and 30° (P<0.0001). The results of each group showed that the meningeal contrast was significantly best with ISWF of 1.55 than the others. The effects of weighting factors and other scanning parameters on SIR and CNR values of meninge-skull had no interactive effect.Conclusion
The continuous meninges form can be observed by mFFE MR imaging with optimized scan parameters. Considering the clinical scanning time, the best image quality was obtained with NSA of 3, the second echo time of 8-10ms and flip angle of 10°~20°.Acknowledgements
No acknowledgement found.References
[1] Dasgupta K, Jeong J. Developmental biology of the meninges[J]. Genesis, 2019,57(5):e23288.
[2] Weller R O, Sharp M M, Christodoulides M, et al. The meninges as barriers and facilitators for the movement of fluid, cells and pathogens related to the rodent and human CNS[J]. Acta Neuropathol, 2018,135(3):363-385.
[3] Kremer S, Abu E M, Bierry G, et al. Accuracy of delayed post-contrast FLAIR MR imaging for the diagnosis of leptomeningeal infectious or tumoral diseases[J]. J Neuroradiol, 2006,33(5):285-291.
[4] Sommer N N, Pons L R, Coppenrath E, et al. Contrast-enhanced modified 3D T1-weighted TSE black-blood imaging can improve detection of infectious and neoplastic meningitis[J]. Eur Radiol, 2020,30(2):866-876.
[5] Meltzer C C, Fukui M B, Kanal E, et al. MR imaging of the meninges. Part I. Normal anatomic features and nonneoplastic disease[J]. Radiology, 1996,201(2):297-308.
Figures
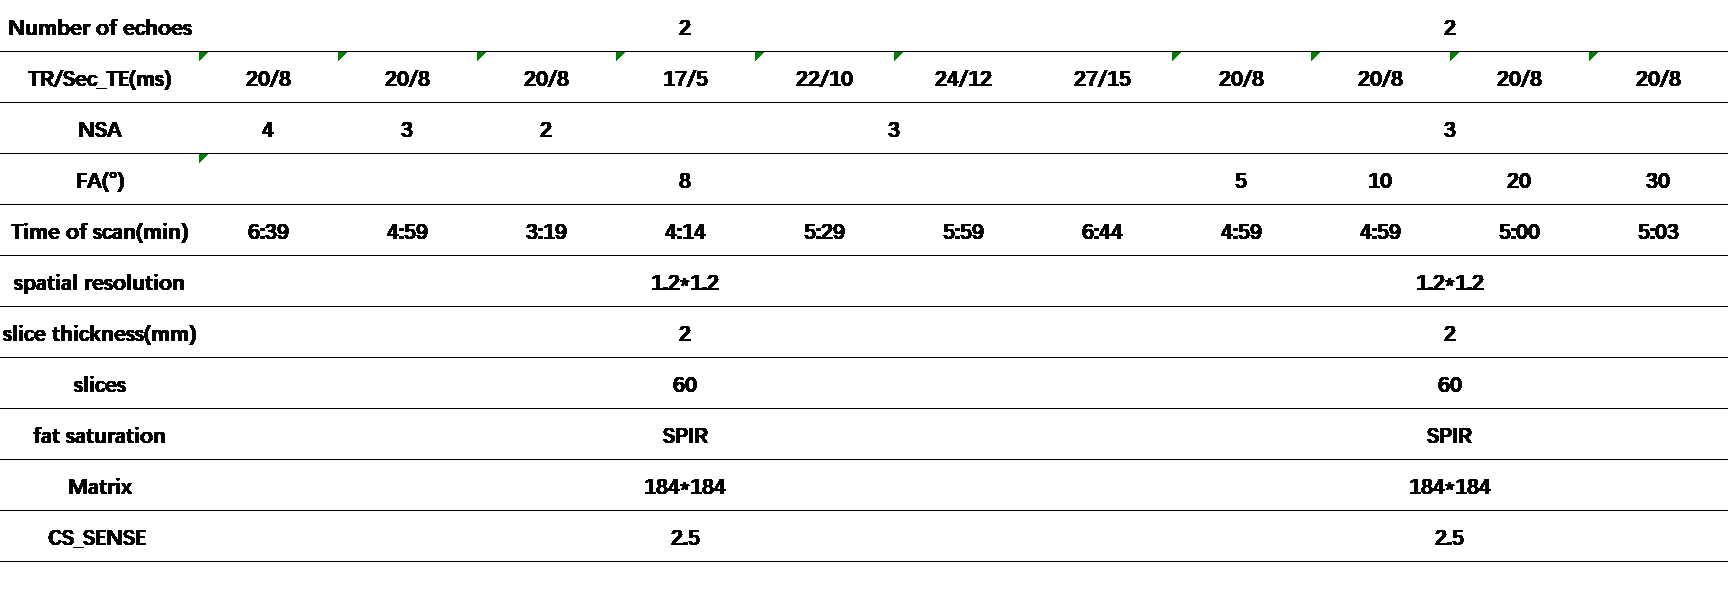
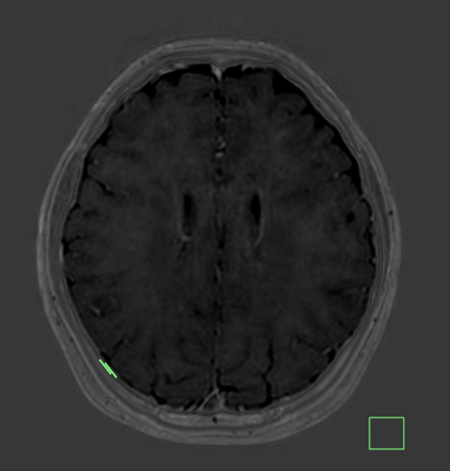
Figure1. ROIs in meningeal MR imaging with mFFE sequence in a healthy volunteer.
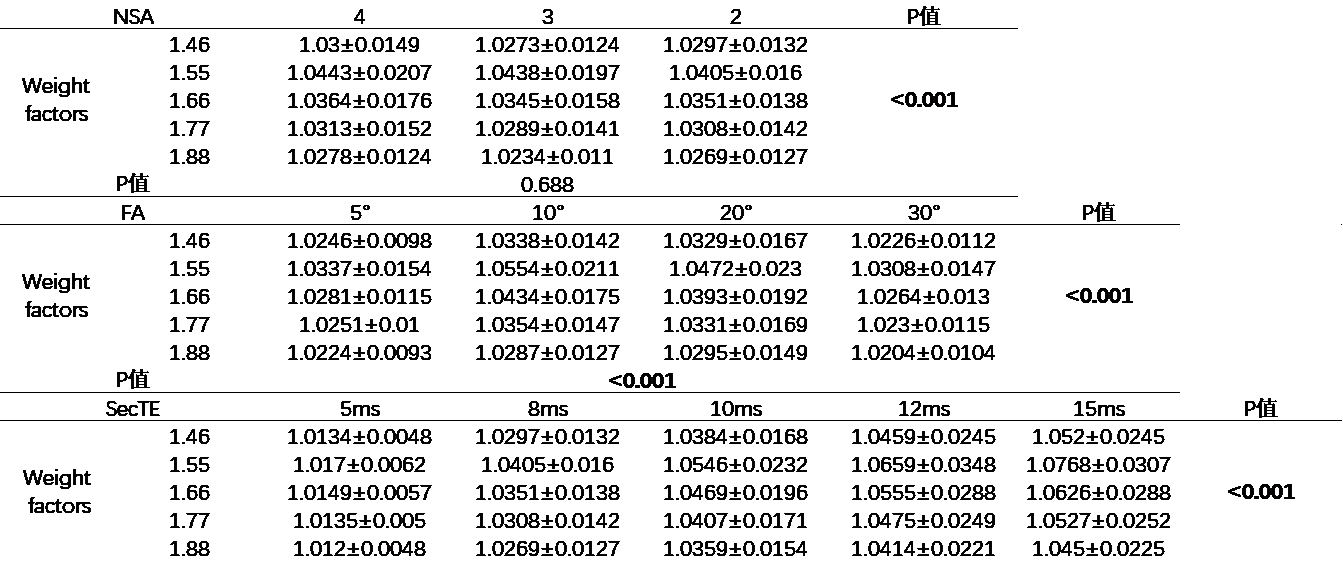
Table2.SIR of different parameters NSA, SecTE, FA.
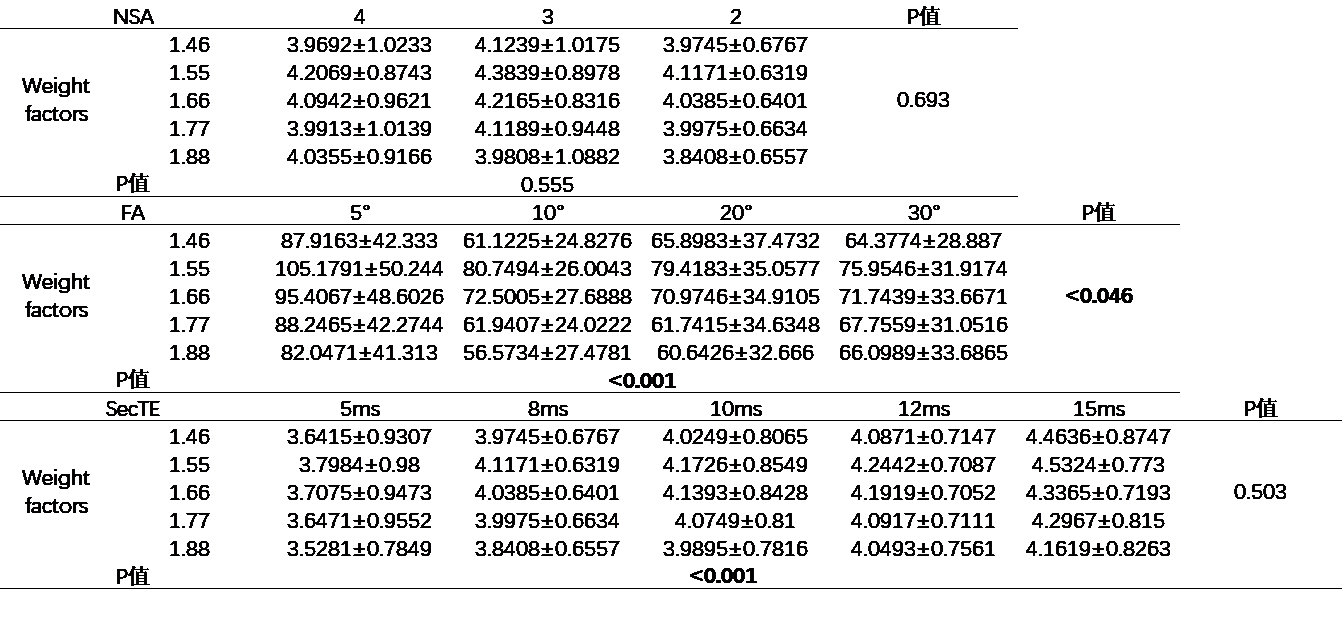
Table3.CNR of different parameters NSA, SecTE, FA. The data from NSA, SecTE were lnCNR.