1916
Comparison of ComBat harmonization methods for longitudinal magnetic resonance imaging data in a travelling subject cohort1Division of Anaesthesia, University of Cambridge, Cambridge, United Kingdom, 2BioMedIA Group, Department of Computing, Imperial College, London, United Kingdom, 3MRC Cognition and Brain Sciences Unit, University of Cambridge, Cambridge, United Kingdom, 4Diagnostic Radiology, Lund University, Lund, Sweden, 5Department of Neurosurgery and Turku Brain Injury Centre, Turku University Hospital and University of Turku, Turku, Finland, 6Wolfson Brain Imaging Centre, Department of Clinical Neurosciences, University of Cambridge, Cambridge, United Kingdom
Synopsis
The trend in neuroimaging towards multi-site studies requires validated harmonization approaches to eradicate scanner differences which mask the biological effect of interest. Here, the harmonization algorithm ComBat and its modification for longitudinal data (LongComBat) were compared on a large travelling subject sample (n=23 for structural MRI and n=31 for diffusion tensor MRI).
In structural data scanner difference are not apparent in unharmonized data but can be created by harmonization. For DTI data, scanner differences in unharmonized data are large and, both ComBat and LongComBat successfully diminished those in most regions of interest, with LongComBat achieving slightly lower false positive rates.
Background
There is a growing trend in longitudinal neuroimaging towards multi-site studies. This results in an urgent need for validated harmonization methods to eradicate scanner-induced noise which can mask the biological effect of interest. A popular approach is the ComBat algorithm,[1][2] which has recently been modified for longitudinal data (LongComBat).[3] However, LongComBat has not yet been validated in diffusion data or in a travelling subject cohort. We compare ComBat and LongComBat with respect to their power and false positive rate (FPR) in a large travelling subject cohort.Methods
Study populationSubjects were imaged between 10/11/2006 and 27/11/2019 in either Cambridge (UK) or Turku (Finland) as healthy controls for use across multiple studies. Subjects were eligible for the current analysis if they received at least two magnetic resonance scans within a maximum of 180 days on either the same scanner (within-scanner cohort) or on different scanners (across-scanner cohort). Scanner was defined as a composite of site, manufacturer model and acquisition settings. All scanners were 3T and all diffusion acquisitions single-shell. Acquired sequences included T1w for all, and diffusion tensor images (DTI) where possible
This yielded 156 serial scans from 73 subjects aged 19-85 (median 34) years, 37 (50%) of which were male. For structural data there were 60 scan pairs from 5 scanners imaged within 2-180 (median 22) days in the within-scanner cohort, and 23 scan pairs from 5 scanners imaged within 0-160 (median 7) days in the across-scanner cohort. For DTI data there were 37 scan pairs from 4 scanners imaged within 2-180 (median 20) days in the within-scanner cohort and 31 scan pairs from 9 scanners imaged within 0-160 (median 13) days in the across scanner cohort.
Image processing
Images were processed on a common pipeline[4] to extract two structural metrics (volume and mean cortical thickness) and two diffusion metrics (means of fractional anisotropy (FA) and mean diffusivity (MD)) in seven regions of interest (ROIs): ventricles, cortical gray matter, supratentorial white matter, supratentorial deep gray matter, cerebellar gray matter, cerebellar white matter, brainstem; or for cortical thickness: frontal, insular, parietal, occipital, temporal, hippocampal and whole cortex. All images were neck cropped and corrected for scanner field inhomogeneities.
Diffusion tensor images were corrected for noise, Gibbs ringing, eddy current and motion artefacts and field inhomogeneities. T1w images were parcellated using MALP-EM(6) and projected to DTI-space via rigid co-registration. All processed images were visually inspected.
Comparing the power of different harmonization methods
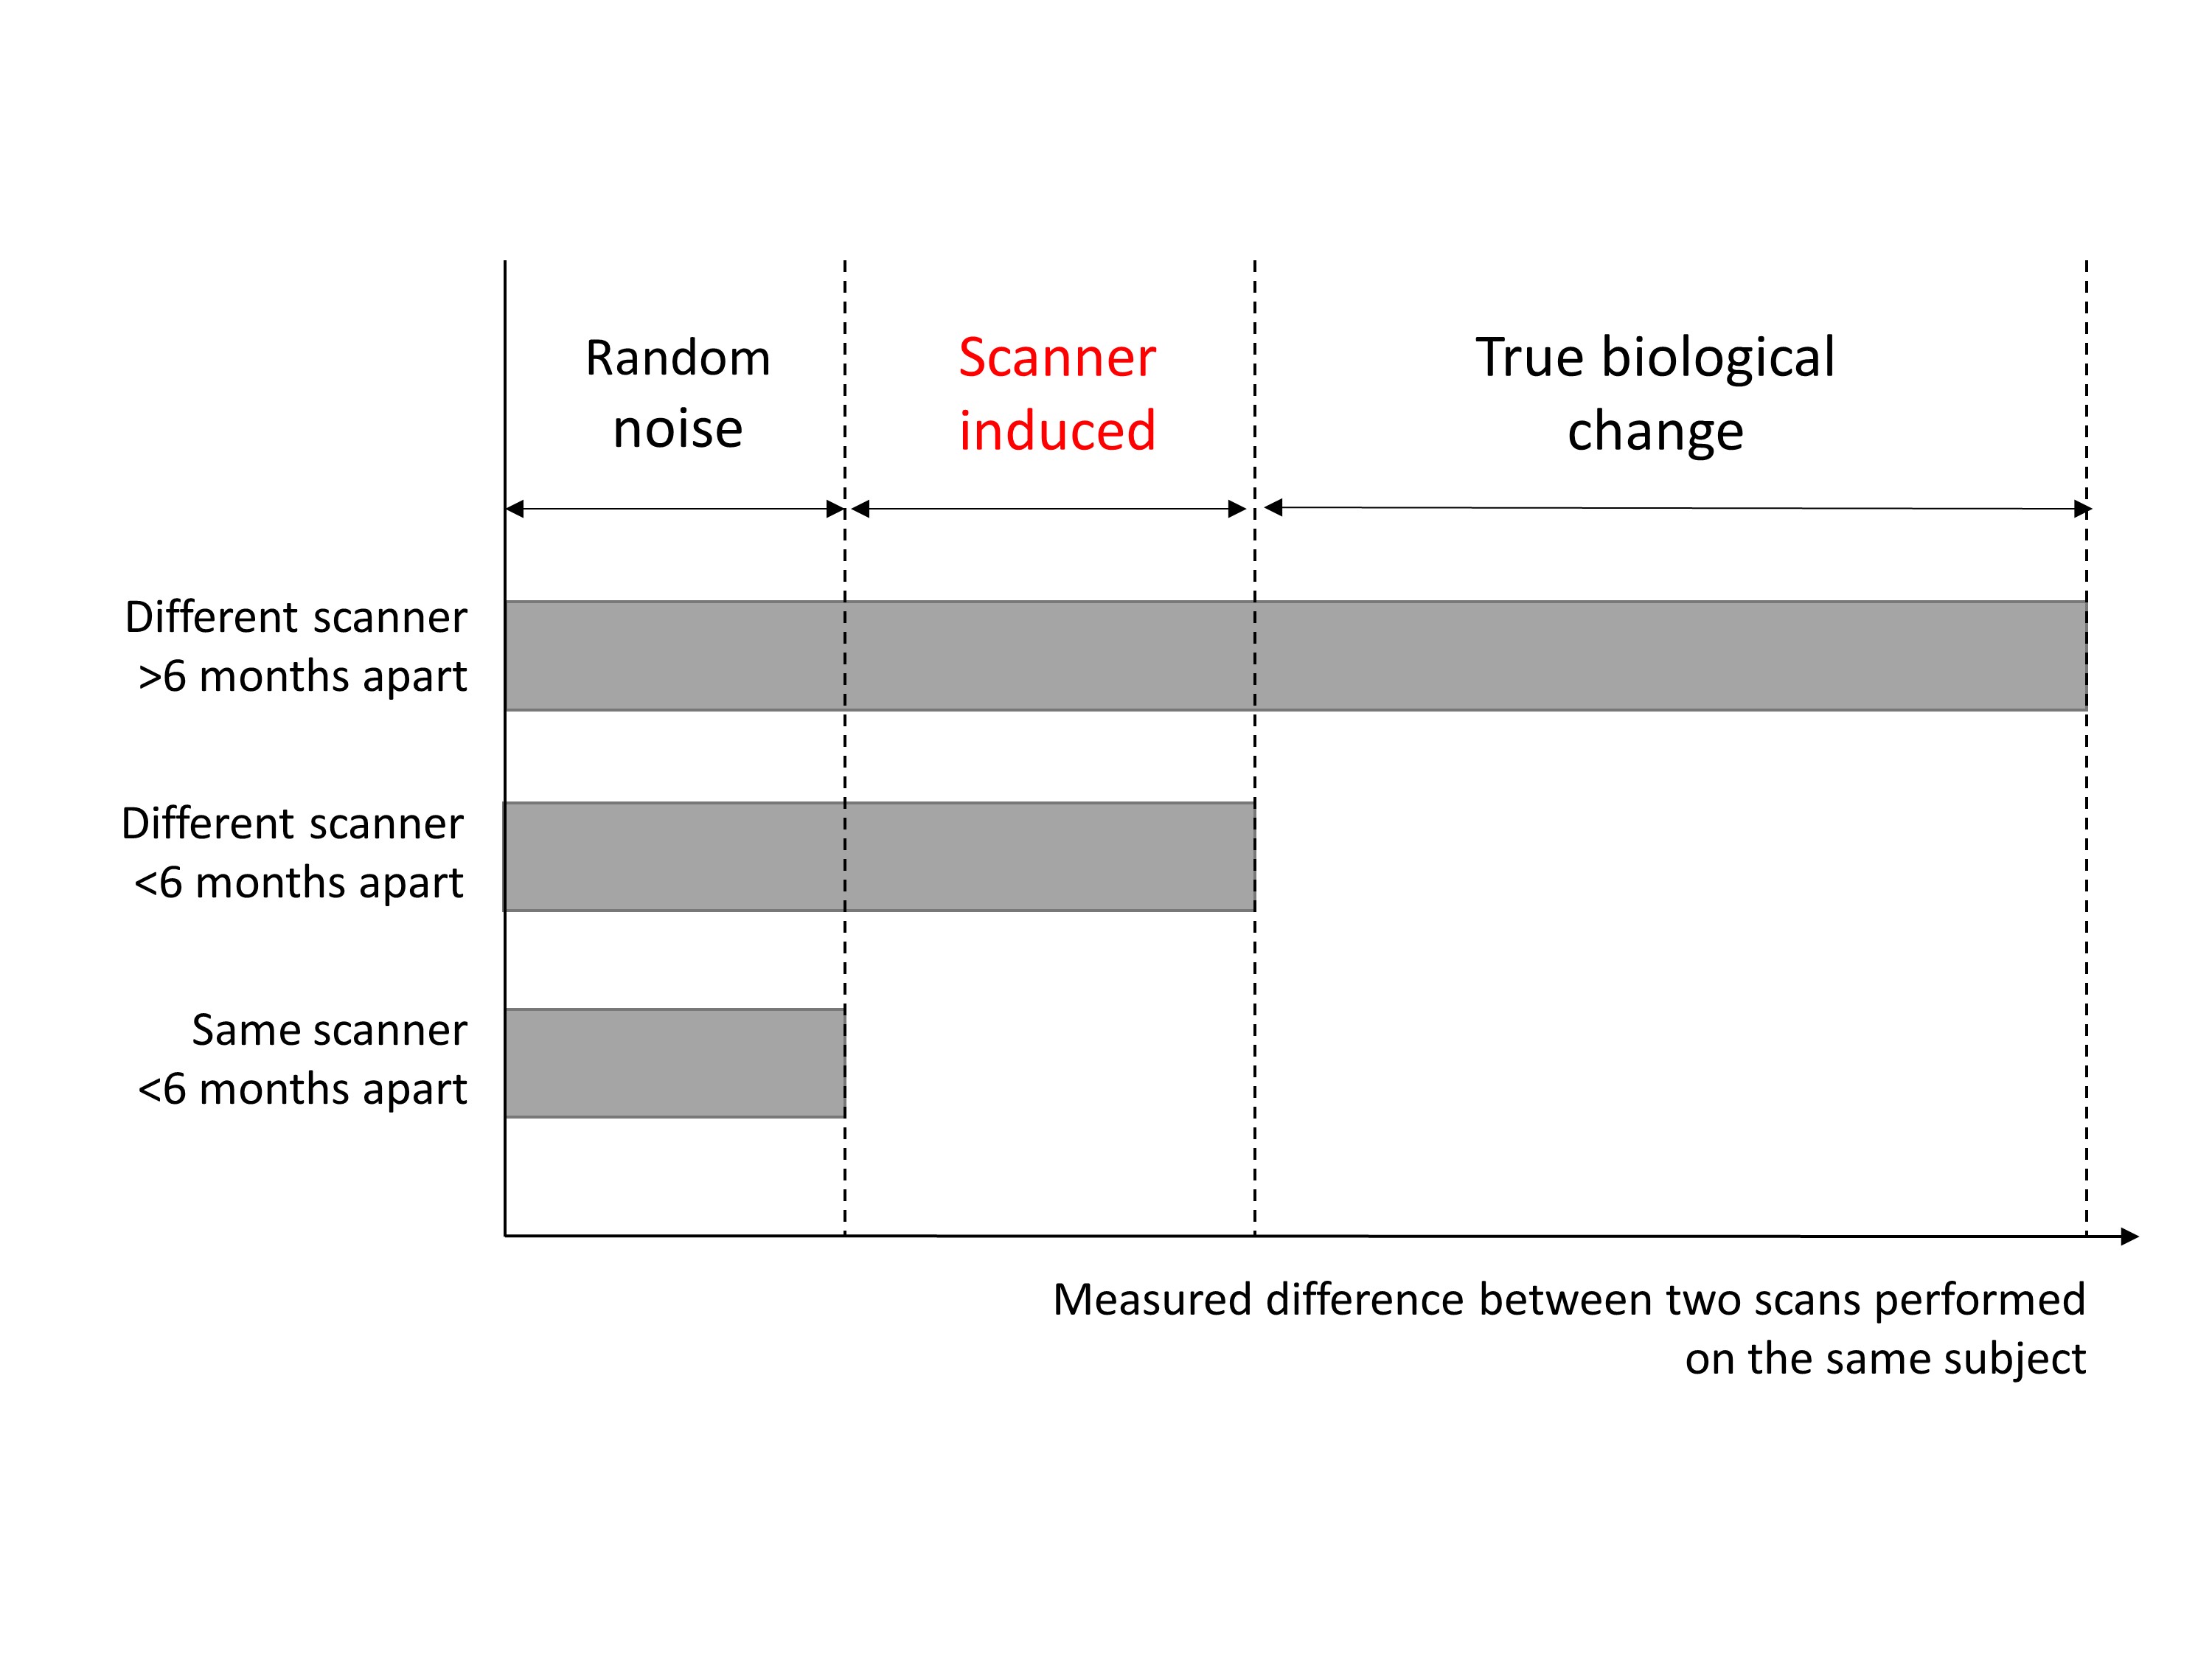
Serial scans obtained on the same scanner were used to estimate the magnitude of scan-rescan noise not amenable to harmonization i.e. random noise (Fig. 1). Serial scans obtained on two different scanners were used to estimate the magnitude of random noise plus scanner induced variation. By subtracting the within-scanner difference from the across-scanner difference we calculate the scanner induced variation i.e. the component amenable to harmonsation. We compared the magnitude of scanner induced variations between unharmonized, ComBat-harmonized and LongComBat-harmonized data as a percentage of the first scan, and as a Field’s standardized effect size.
Comparing the FPR of different harmonization methods
Each subject was randomly assigned to either group A or group B. Mixed models were fitted to test for a difference between group A and B with respect to the metric of interest (volume, cortical thickness, MD or FA) in the form: metric ~ age + sex + time*group + (1| subject). Theoretically this random assignment should not produce any significant difference between groups. The FPR was calculated by repeating this simulation 1000 times and counting the number of unadjusted p-values <0.05. This was performed for each of the seven ROIs for the original and both harmonized datasets (ComBat and LongComBat). The FPRs of all three datasets were then compared using the Friedman test.
All statistical analysis was performed in R (version 4.1.1)[5]. P-values were adjusted for multiple comparisons using Holm’s method.
Results
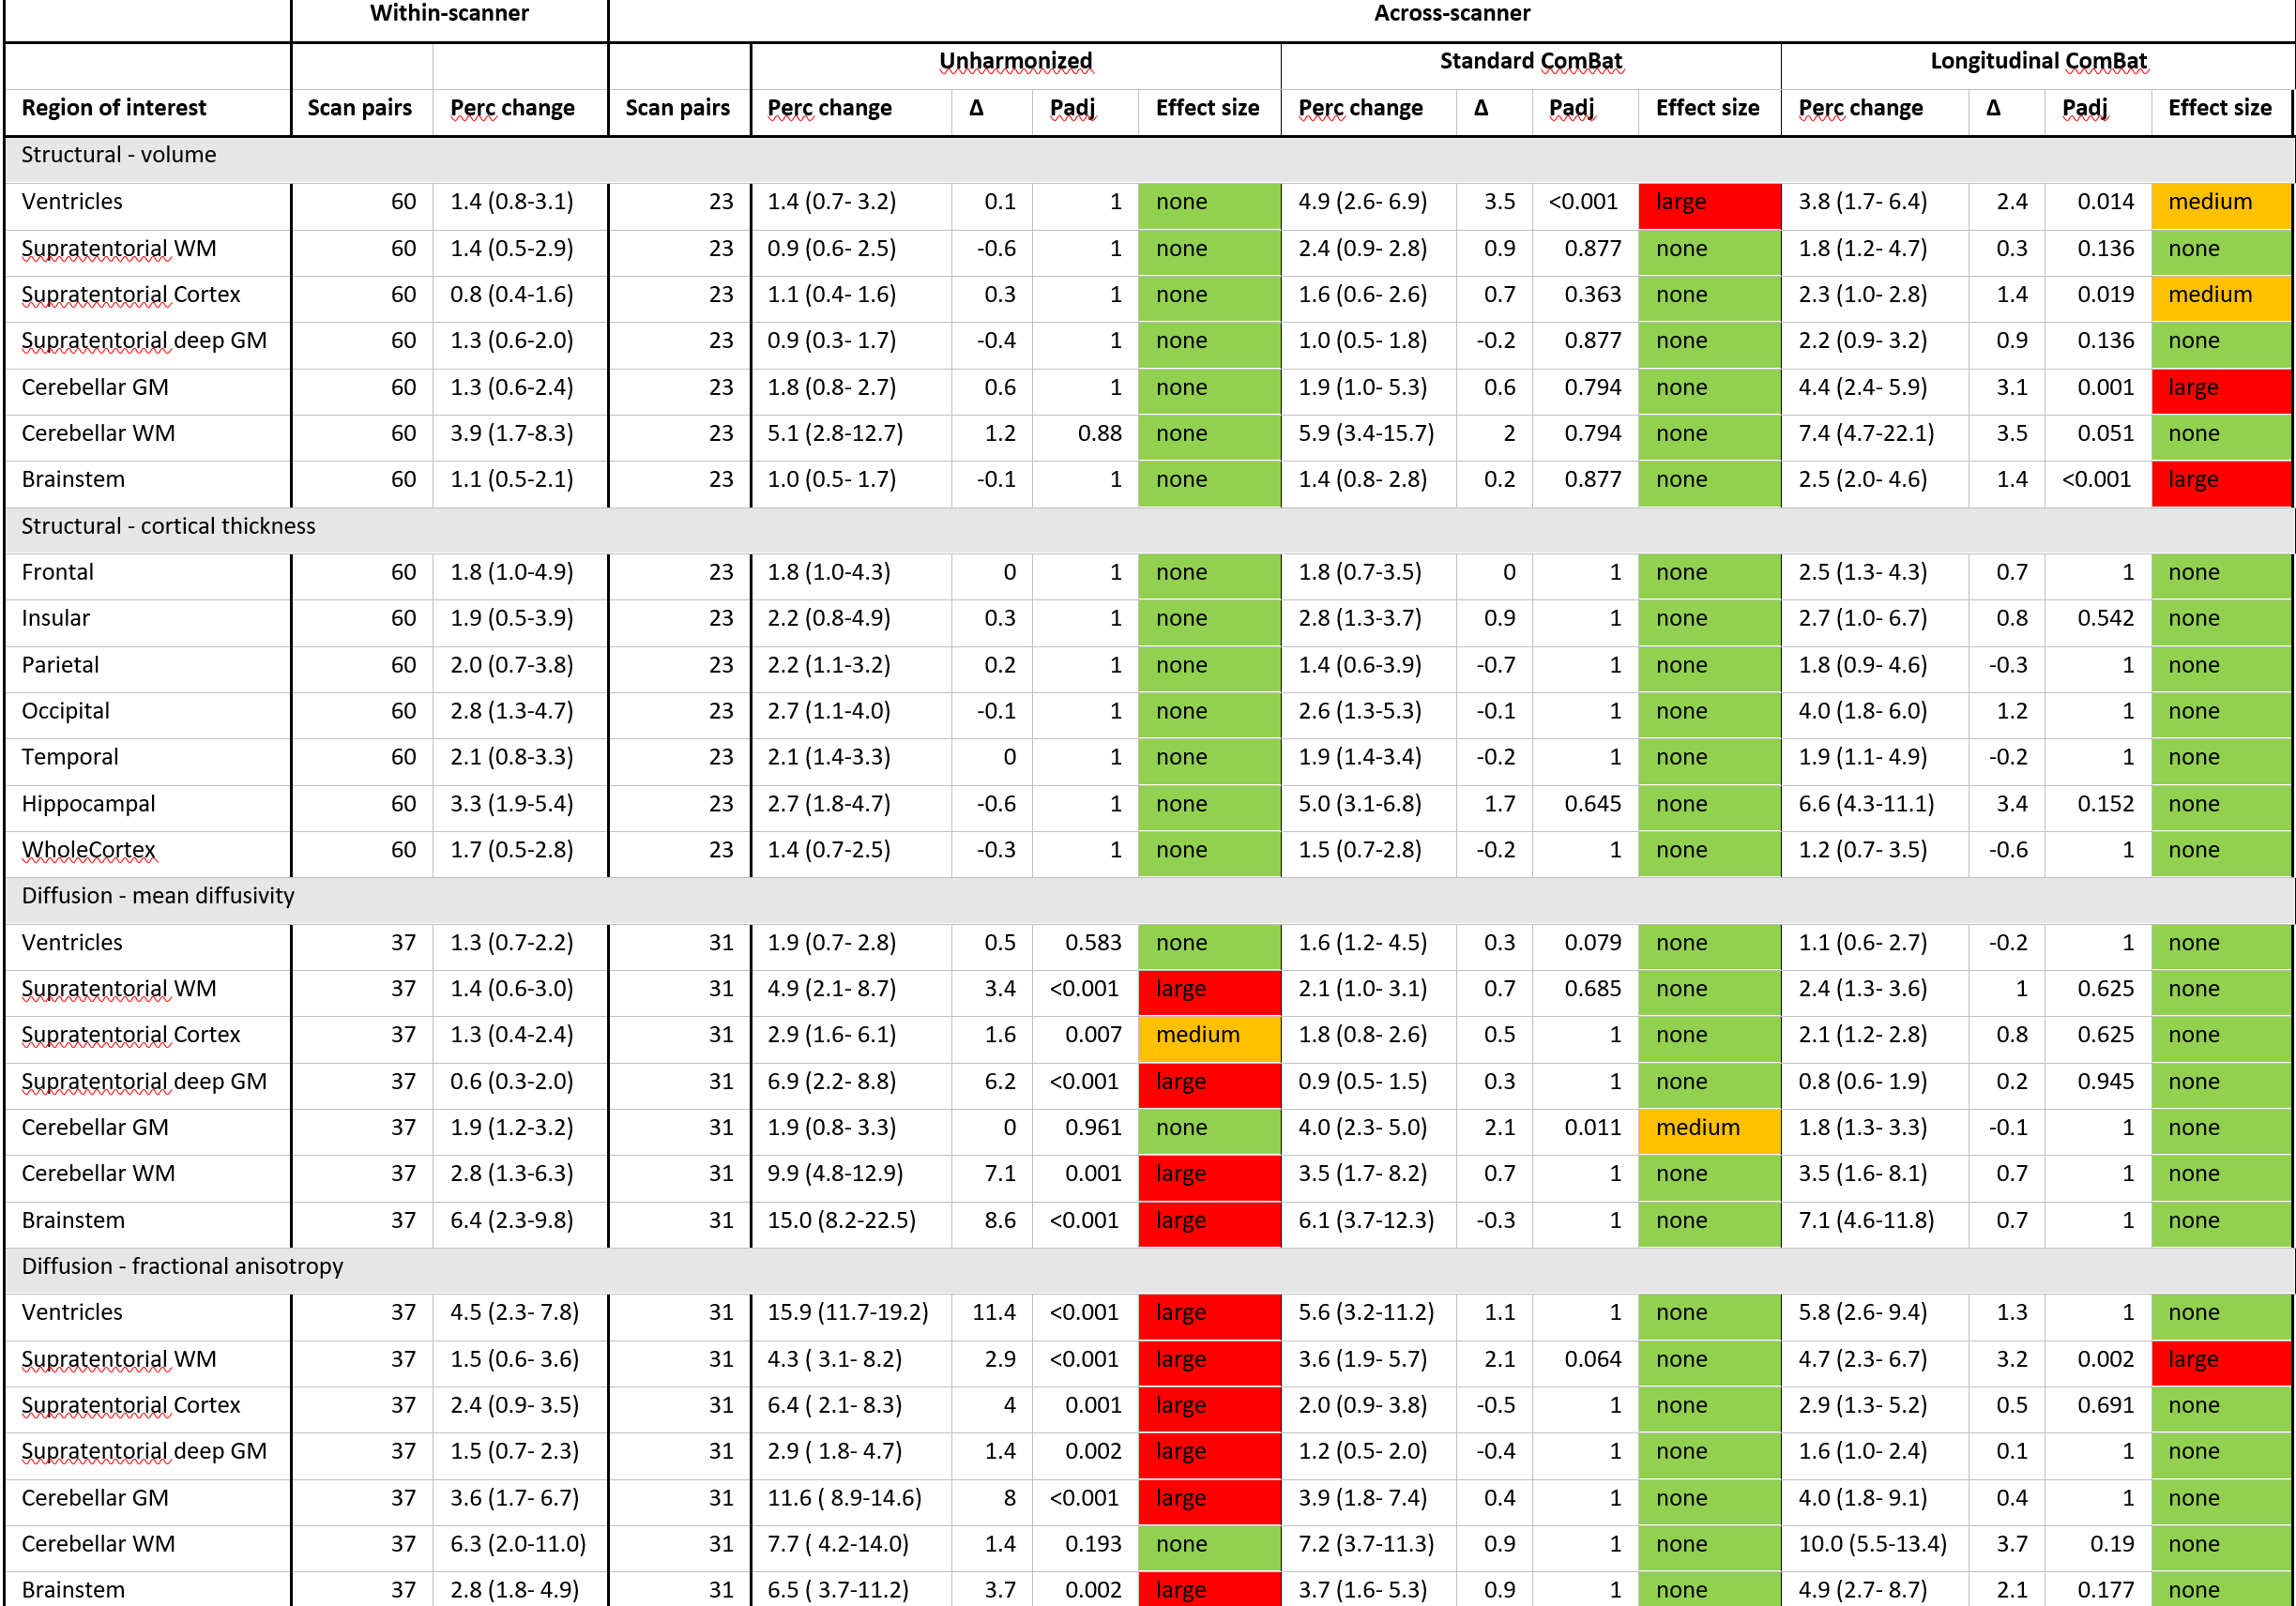
In structural data the within-scanner variation ranged from 0.8-3.9% for the different ROIs. The across-scanner variation in unharmonized data was no higher than the within-scanner variation (delta -0.6 to + 1.2%, p > 0.05). Harmonizing volumetric data introduced scanner difference that did not exist in the unharmonized data, especially using LongComBat (Table 1).In DTI data, the within-scanner variability ranged from 0.6-6.4% for the different ROIs. The across-scanner variation in unharmonized data was significantly higher than the within-scanner variation, yielding a “large” effect size for most ROIs (Table 1). Applying either ComBat or LongComBat eliminated the scanner induced variation in almost all ROIs except for the cerebellar gray matter (ComBat) and the supratentorial white matter (LongComBat).
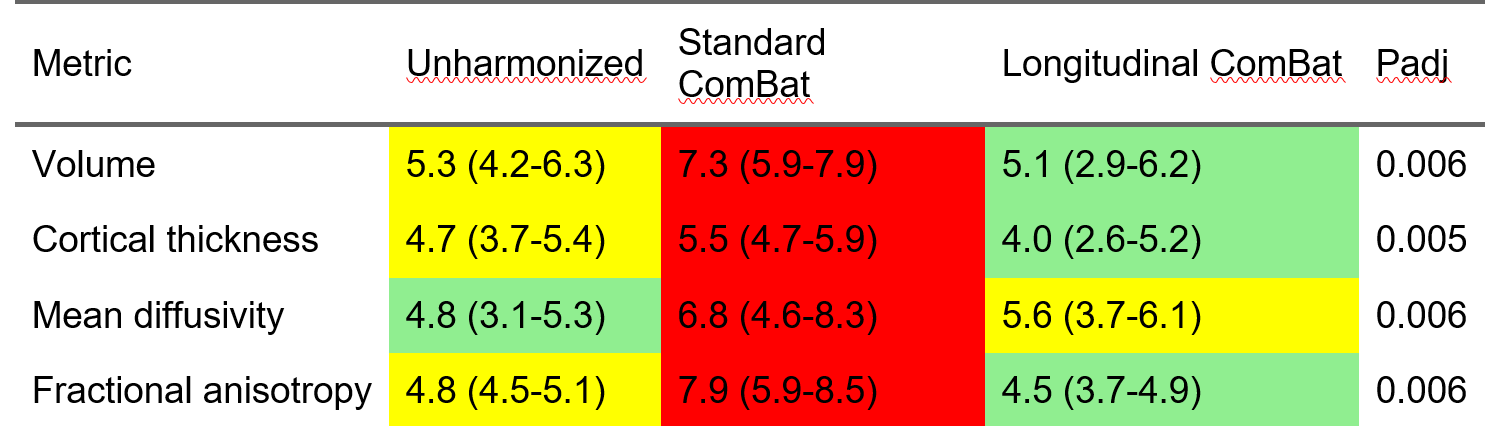
Regarding the detection of group differences, the FPR ranged from 3.1-8.5%, with ComBat consistently generating the highest rates (Table 2).
Conclusion
Harmonizing structural data with (Long)ComBat is not recommendable, as scanner difference are not apparent in unharmonized data but were introduced by harmonization. For DTI data, scanner difference in unharmonized data are large and, both ComBat and LongComBat, successfully mitigated those in the majority of ROIs, with LongComBat achieving slightly lower FPRs.Acknowledgements
No acknowledgement found.References
[1] J. P. Fortin et al., “Harmonization of multi-site diffusion tensor imaging data,” Neuroimage, vol. 161, pp. 149–170, Nov. 2017, doi: 10.1016/J.NEUROIMAGE.2017.08.047.
[2] J. P. Fortin et al., “Harmonization of cortical thickness measurements across scanners and sites,” Neuroimage, vol. 167, pp. 104–120, Feb. 2018, doi: 10.1016/J.NEUROIMAGE.2017.11.024.
[3] J. C. Beer et al., “Longitudinal ComBat: A method for harmonizing longitudinal multi-scanner imaging data,” Neuroimage, vol. 220, p. 117129, Oct. 2020, doi: 10.1016/J.NEUROIMAGE.2020.117129.
[4] S. Winzeck, “Methods for Data Management in Multi-Centre MRI Studies and Applications to Traumatic Brain Injury.,” University of Cambridge, 2021.
[5] R Core Team, R: A language and environment for statistical computing. R Foundation for Statistical Computing. Vienna, Austria, 2021.
Figures