1913
CNN denoising of FGATIR MRI improves direct visualization of subcortical anatomy1Center for Advanced Imaging Innovation and Research (CAI2R), Department of Radiology, New York University, school of medicine, New York, NY, United States, 2Electrical and computer engineering, New York University, Tandon school of engineering, Brooklyn, NY, United States, 3Radiology, University of Pennsylviania, Philadelphia, PA, United States
Synopsis
The basal ganglia, thalamus and brainstem are affected by movement disorders and contain key targets for functional neurosurgery. Targeting however is based on indirect coordinates originally derived from pneumoencephalograms! 3D Fast Gray Matter Acquisition T1 Inversion Recovery (FGATIR) can directly visualize potential targeted structures (e.g. dentatorubrothalamic tract), but is signal-starved in clinically-feasible acquisitions. We developed a convolutional neural network to improve FGATIR quality. Expert rater assessment suggested this CNN improved contrast resolution of individual structures and overall clinical image quality of 1-average data to the level of 4-averages. This could further enable investigations of functional neurosurgery for movement disorders.
Introduction
Specific subcortical structures are affected by common neurological diseases and can be targeted by functional neurosurgery. Diffusion or susceptibility-weighted MRI improve visualization of these structures, but are too noisy at the resolutions required, degraded by skull base artifacts, and contrast is lost with disease or treatment. 3D Fast Gray Matter Acquisition T1 Inversion Recovery (FGATIR) provides direct visualization of subcortical anatomy1,2, but requires long acquisitions. We improved FGATIR image quality using modified CNN architecture based on DnCNN3 and FFDnet4 with a loss function that regularizes the power spectrum of residuals (“PS-CNN”). We used quantitative analysis and expert assessment to compare model performance to other denoising methods and pure signal averaging.Materials and Methods
In this IRB-approved study, we created a training dataset from 12 healthy adult subjects (6 female, age 29+/-4.2 years) scanned over two 1-hr sessions with 8 individual averages of an 0.8-mm isotropic resolution FGATIR sequence (TR/TE/TI = 3000/2.11/410ms, nonselective 180-degree inversion pulse, FA = 6°, time ~12 min per average). Individual magnitude images were co-registered and averaged as previously described2.Network training
The CNN architecture used a 20-layer feed-forward residual learning model to predict the optimal noise field $$$\epsilon=\epsilon (x)$$$, where 3D 50x50x50 patches of 8-average FGATIR images provided noise-free ground-truth, to which uncorrelated Gaussian noise $$$\epsilon\sim\mathcal{N}(0,\sigma^2)$$$ was added. Training was performed over a total of $$$N=235,200$$$ training samples after data augmentation. Within each layer, we computed 64 filters (size $$$3\times3\times3$$$) using 3Dconv, batchnorm and ReLU. We computed the mean-squared error loss
$$ L(\theta) = \frac{1}{2N}\sum_{i=1}^{N} ||R(y_i,\sigma_i;\theta)-\epsilon_i||^2 + \lambda|\Gamma(R_i,\sigma_i)-1| $$
where the first term minimizes the distance between an estimated residual $$$R(y_i,\sigma_i;\theta)=noisy-denoised$$$ and the added noise $$$\epsilon (x)$$$. The second term enforces a penalty for spatially-correlated residuals, requiring the residual’s power spectrum
$$ \Gamma(R_i, \sigma_i) = \frac{1}{A} Fourier \left\{\frac{R(y_i,\sigma_i;\theta)}{\sigma_i}\right\}^2 $$
to be constant for all spatial frequencies for image scross sectional area $$$A$$$.
We trained two models, one using a single input channel consisting of the noisy sample (PS-CNN-1c), and another using two input channels consisting of both noisy input and tunable noise level map $$$\sigma$$$, to make the denoising model more flexible to varying noise levels (PS-CNN-2c). Both models were optimized using ADAM5. The network was trained for 20 total epochs, learning rate was set to 10-3, and decayed to 10-4 after 10 epochs, and minibatch size=64 training examples. All models were trained using pytorch on a NVIDIA Tesla V100 GPU. Training time per model was 10 hours.
Model evaluation
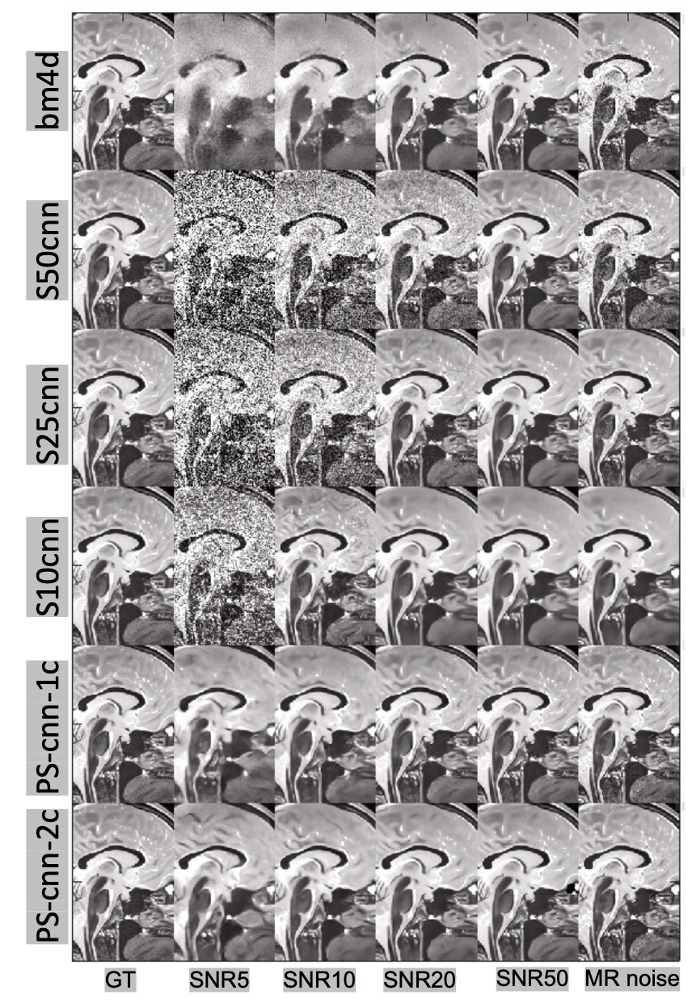
We evaluated the performance of the network on FGATIR MRI data by adding either white Gaussian noise or Rician noise6 at SNR 5, 10, 20, and 50. The single channel network was trained with and without regularization to compare the effect of the power spectrum term, along with training at single noise levels and with blind noise. We report the pSNR improvement relative to ground truth 8 average data. We also compared the network performance to a state-of-the-art model-based denoising approach, bm4d7.
Rater study
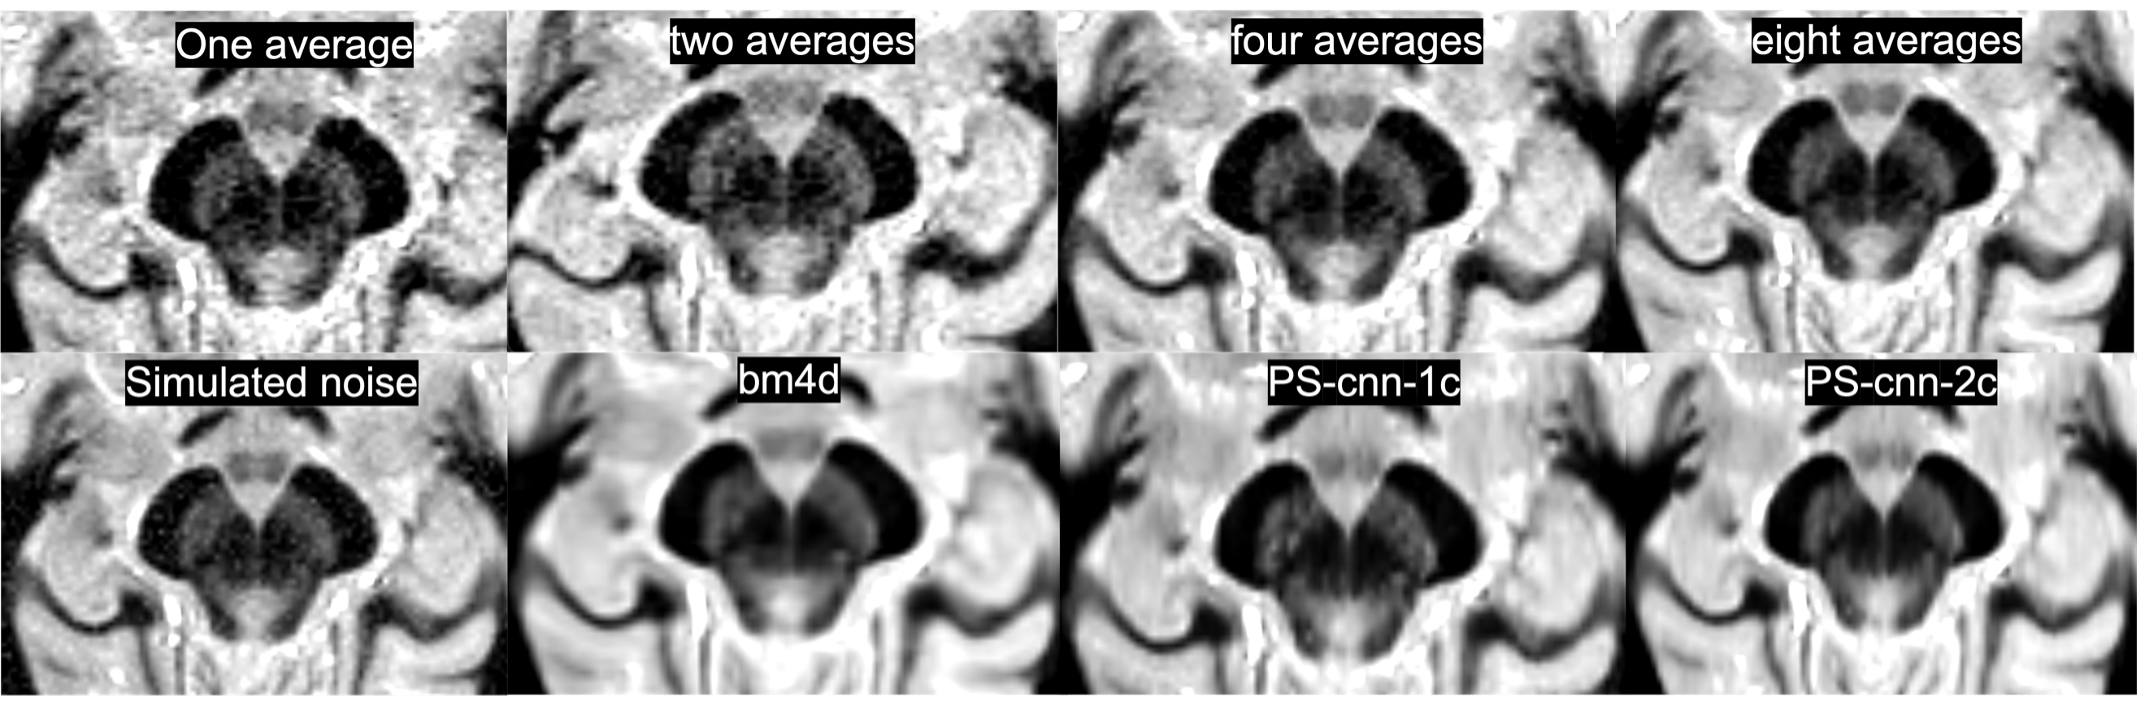
For each subject, two board-certified neuroradiologists blindly and independently evaluated axial FGATIR images of the midbrain parallel to the commissural plane through the red nucleus (Figure 1). Images were derived with 1, 2, 4 & 8 averages, the same 4-average image with superimposed simulated Rician bias, and 3 randomly selected single average images each processed with PS-CNN-1c, PS-CNN-2c and bm4d. This resulted in 14 images per subject or 168 images total. Raters assessed a) contrast resolution (sharpness of transitions between specific adjacent structures), b) Signal quality (voxel-to-voxel signal variation within individual structures), c) artificiality (perceived deviations from normal MRI images or “fakeness”) on ordinal scale 1-3. Raters assessed overall quality for clinical decision-making on ordinal scale 1-4. Higher scores reflected better quality for each scale.
Results
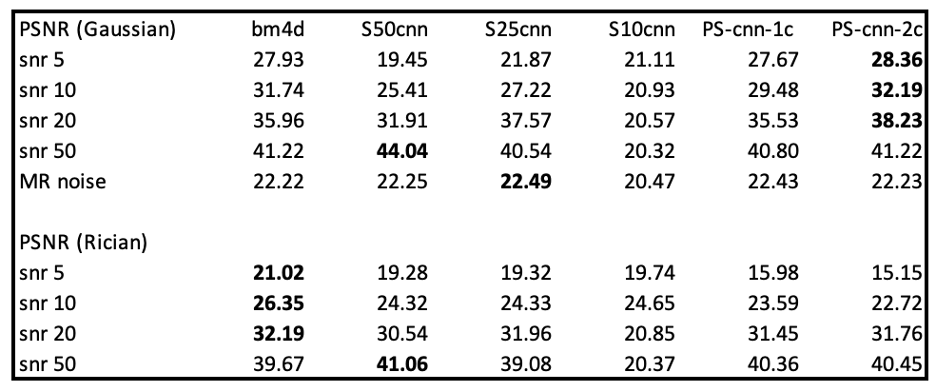
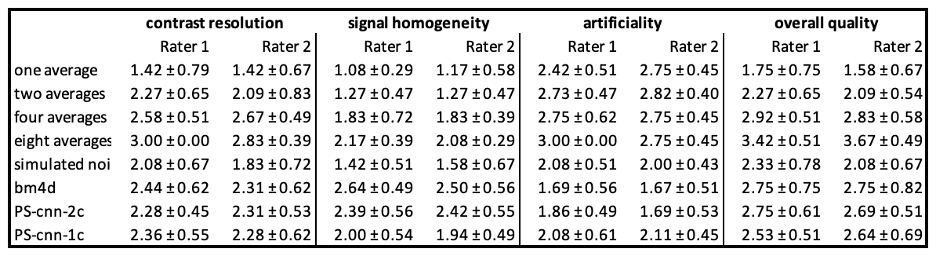
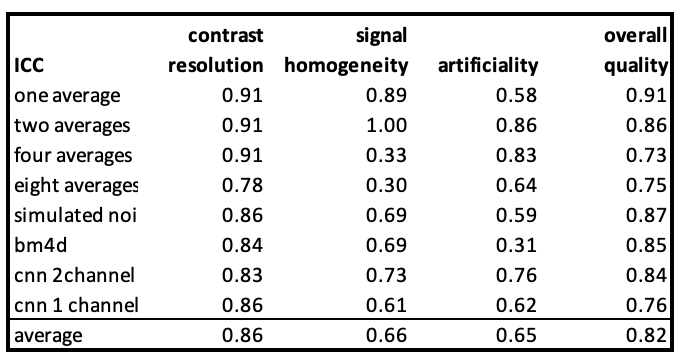
We first evaluated the performance of our method on synthetic noise at varying SNR. Table 1 shows PSNR results for each trained model: At low SNR, PS-CNN-2c outperformed other methods with an increase in PSNR in all noise regimes for simulated Gaussian noise. For PS-CNN-2c, PSNR increased by 2.5% at SNR 5, 9.12% at SNR 10, 7.57% at SNR 20, and 1.05% at SNR 50.Table 2 shows that increasing averages increased rater assessments for all scales. Raters preferred 8-average data, but this required 2 hours of scanning. PS-CNN-2c was rated modestly better than PS-CNN-1c for signal and overall quality. PS-CNN-2c and bm4d appeared relatively equivalent – both improved single average data to ratings near equivalent to true 4 average data. Both raters consistently recognized artificial data. Raters agreed most when the data quality was low (ICC=0.91) and tended to disagree more when rating artificiality (Table 3).
Discussion and Conclusion
CNN denoising made a 1-average FGATIR image look like 4-averages in both model simulations and expert neuroradiologist evaluations. The PS-CNN-2c (with tunable noise map) performed slightly better and may be more externally valid for clinical situations. The PS-CNN-2c appeared equivalent to bm4d, but processes data faster – a future study could look at combining them. This PS-CNN-2c also may be effective using undersampled data (e.g. compressed sensing). Effective denoising should increase the value of FGATIR for future clinical investigations of pathology and functional neurosurgery targeting in subcortical structures.Acknowledgements
Research was supported by the National Institute of Neurological Disorders and Stroke of the NIH under awards R01 NS088040 and R21 NS081230, by the National Institute of Biomedical Imaging under award R01 EB027075, by the Hirschl foundation, and was performed at the Center of Advanced Imaging Innovation and Research (CAI2R, www.cai2r.net), a Biomedical Technology Resource Center supported by NIBIB with the award P41 EB017183References
1. Sudhyadhom A, Haq IU, Foote KD, et al. A high resolution and high contrast MRI for differentiation of subcortical structures for DBS targeting: the fast gray matter acquisition t1 inversion recovery (FGATIR). Neuroimage 2009;47(Suppl 2);T44–522. Shepherd, T. M., Ades-Aron, B., Bruno, M., Schambra, H. M., & Hoch, M. J. (2020). Direct In Vivo MRI Discrimination of Brain Stem Nuclei and Pathways. American Journal of Neuroradiology, 41(5), 777-784.
3. Zhang K, Zuo W, Chen Y, Meng D, Zhang L. Beyond a gaussian denoiser: Residual learning of deep cnn for image denoising. Ieee T Image Process 2017;26(7):3142-3155.
4. Zhang K, Zuo W, Zhang L. FFDNet: Toward a fast and flexible solution for CNN-based image denoising. Ieee T Image Process 2018;27(9):4608-4622.
5. Diederik P. Kingma and Jimmy Lei Ba. Adam : A method for stochastic optimization. 2014. arXiv:1412.6980v9
6. Gudbjartsson, H., & Patz, S. (1995). The Rician distribution of noisy MRI data. Magnetic resonance in medicine, 34(6), 910-914.
7. Maggioni, M., Katkovnik, V., Egiazarian, K., & Foi, A. (2012). Nonlocal transform-domain filter for volumetric data denoising and reconstruction. IEEE transactions on image processing, 22(1), 119-133.
Figures