1912
A resource for development and comparison of harmonisation methods for multi-modal brain MRI data1Sir Peter Mansfield Imaging Centre, School of Medicine, University of Nottingham, Nottingham, United Kingdom, 2Sir Peter Mansfield Imaging Centre, School of Physics, University of Nottingham, Nottingham, United Kingdom, 3Wellcome Centre for Integrative Neuroimaging (WIN - FMRIB), University of Oxford, Oxford, United Kingdom, 4Australian Institute for Machine Learning, University of Adelaide, Adelaide, Australia
Synopsis
A key challenge in robustly extracting quantitative information from MRI data is the dependence of derived features on nuisance factors, such as the scanning protocol, hardware and software, which are different between vendors and vary with site. While there exist several harmonisation approaches, what’s missing is objective ways and datasets to compare them. Here we present a novel multi-modal neuroimaging data resource for evaluating and comparing harmonisation approaches based on a “travelling heads” paradigm. We further demonstrate how such a resource can be used to a) map the need for harmonisation for different imaging-derived features, b) evaluate existing harmonisation approaches.
Introduction
A key challenge in robustly extracting quantitative information from MRI data is the dependence of derived features on nuisance factors, such as the scanning protocol, hardware and software, which are different between vendors and vary with site[1][2]. This further limits the potential of combining multi-site neuroimaging datasets and allowing studies of larger scale. Even in cases where scans have been acquired with a rigid acquisition protocol or calibrated with phantoms, quantitative measurements can still show variance arising from non-biological causes. Harmonisation approaches [3][4]attempt to remove such non-biological variance while still preserving variance in imaging features associated with variability of interest. Harmonisation algorithms fall into two main categories, depending on whether they harmonise imaging-derived features directly[3][5][6]or the raw MRI signal[4][7][8]. Nevertheless, what is missing are objective ways and datasets to evaluate and compare such approaches. Different studies have relied so far on a range of indirect metrics, from using population distributions as a reference[6]to subject matching by attributes such as age, sex, gender, race and handedness[9]. Here we present a novel multi-modal neuroimaging data resource, matched to the UK Biobank acquisitions, for evaluating and comparing harmonisation approaches. This is based on a “travelling heads” paradigm with subjects scanned repeatedly across different sites and scanners. Our resource is unique in including five brain MRI modalities, acquired in six scanners from all three major vendors. We further demonstrate how such a resource can be used to a) map the need for harmonisation for a large range of multi-modal neuroimaging-derived features, b) evaluate existing harmonisation approaches.Methods
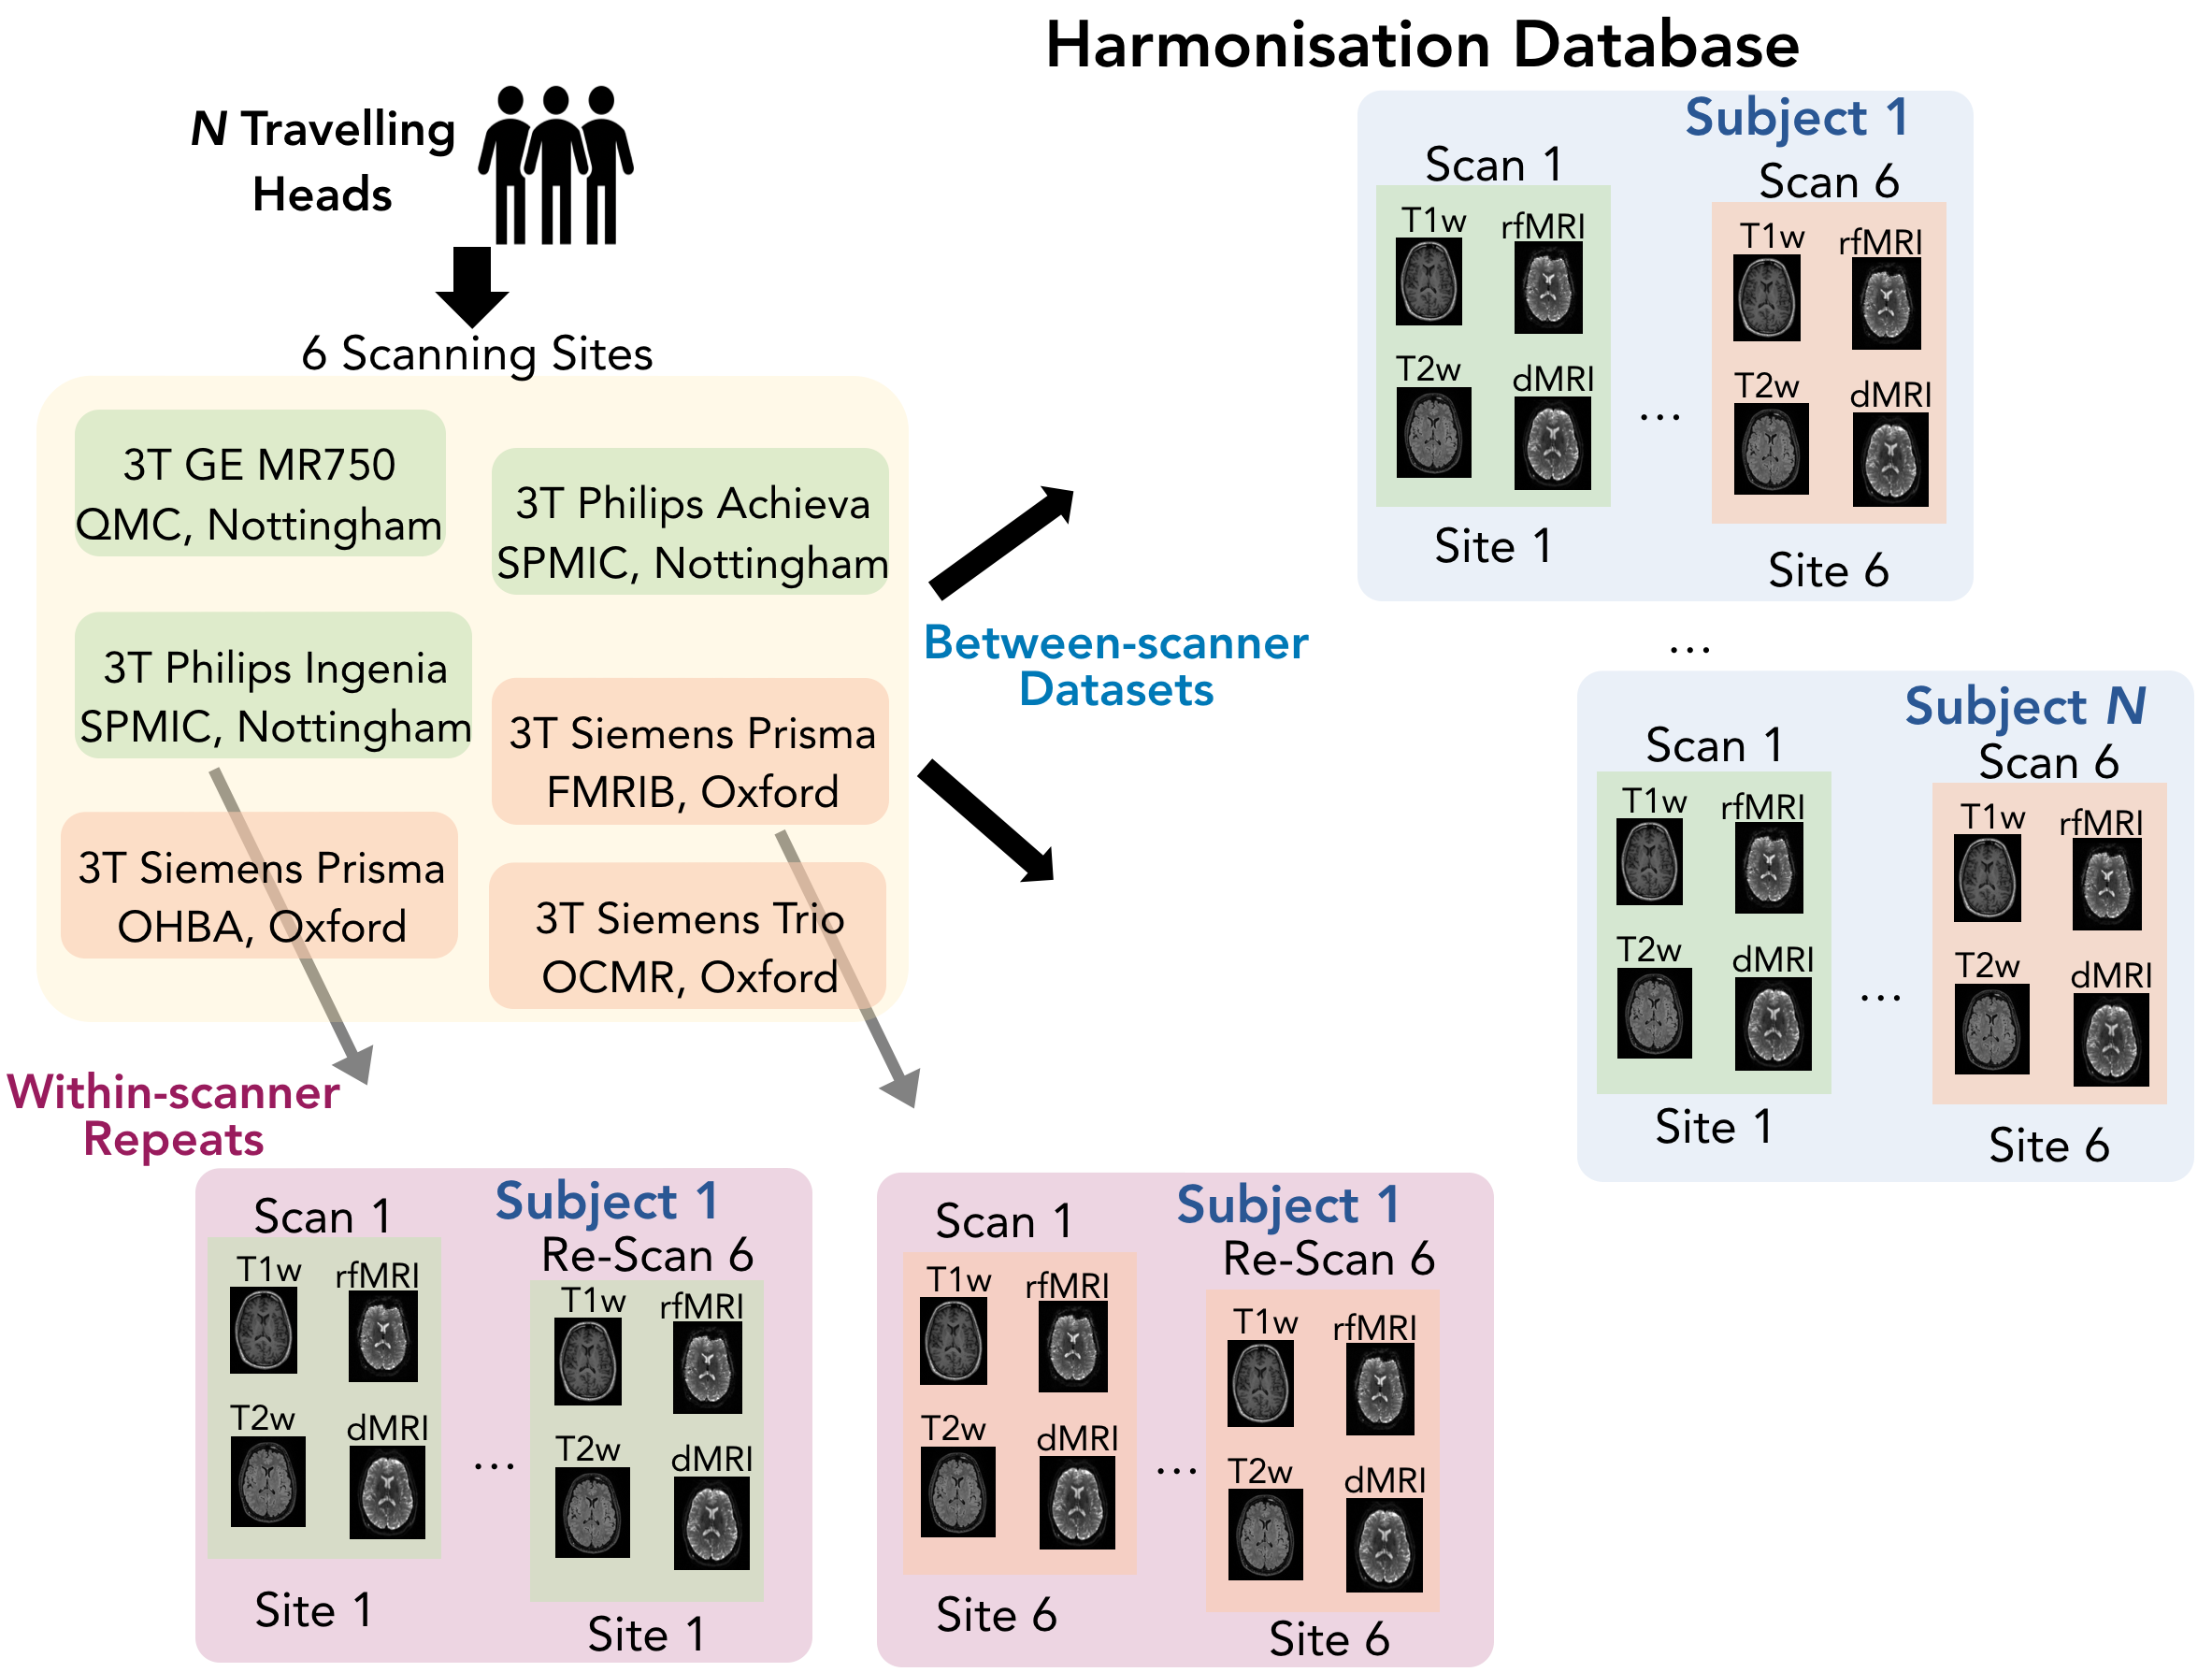
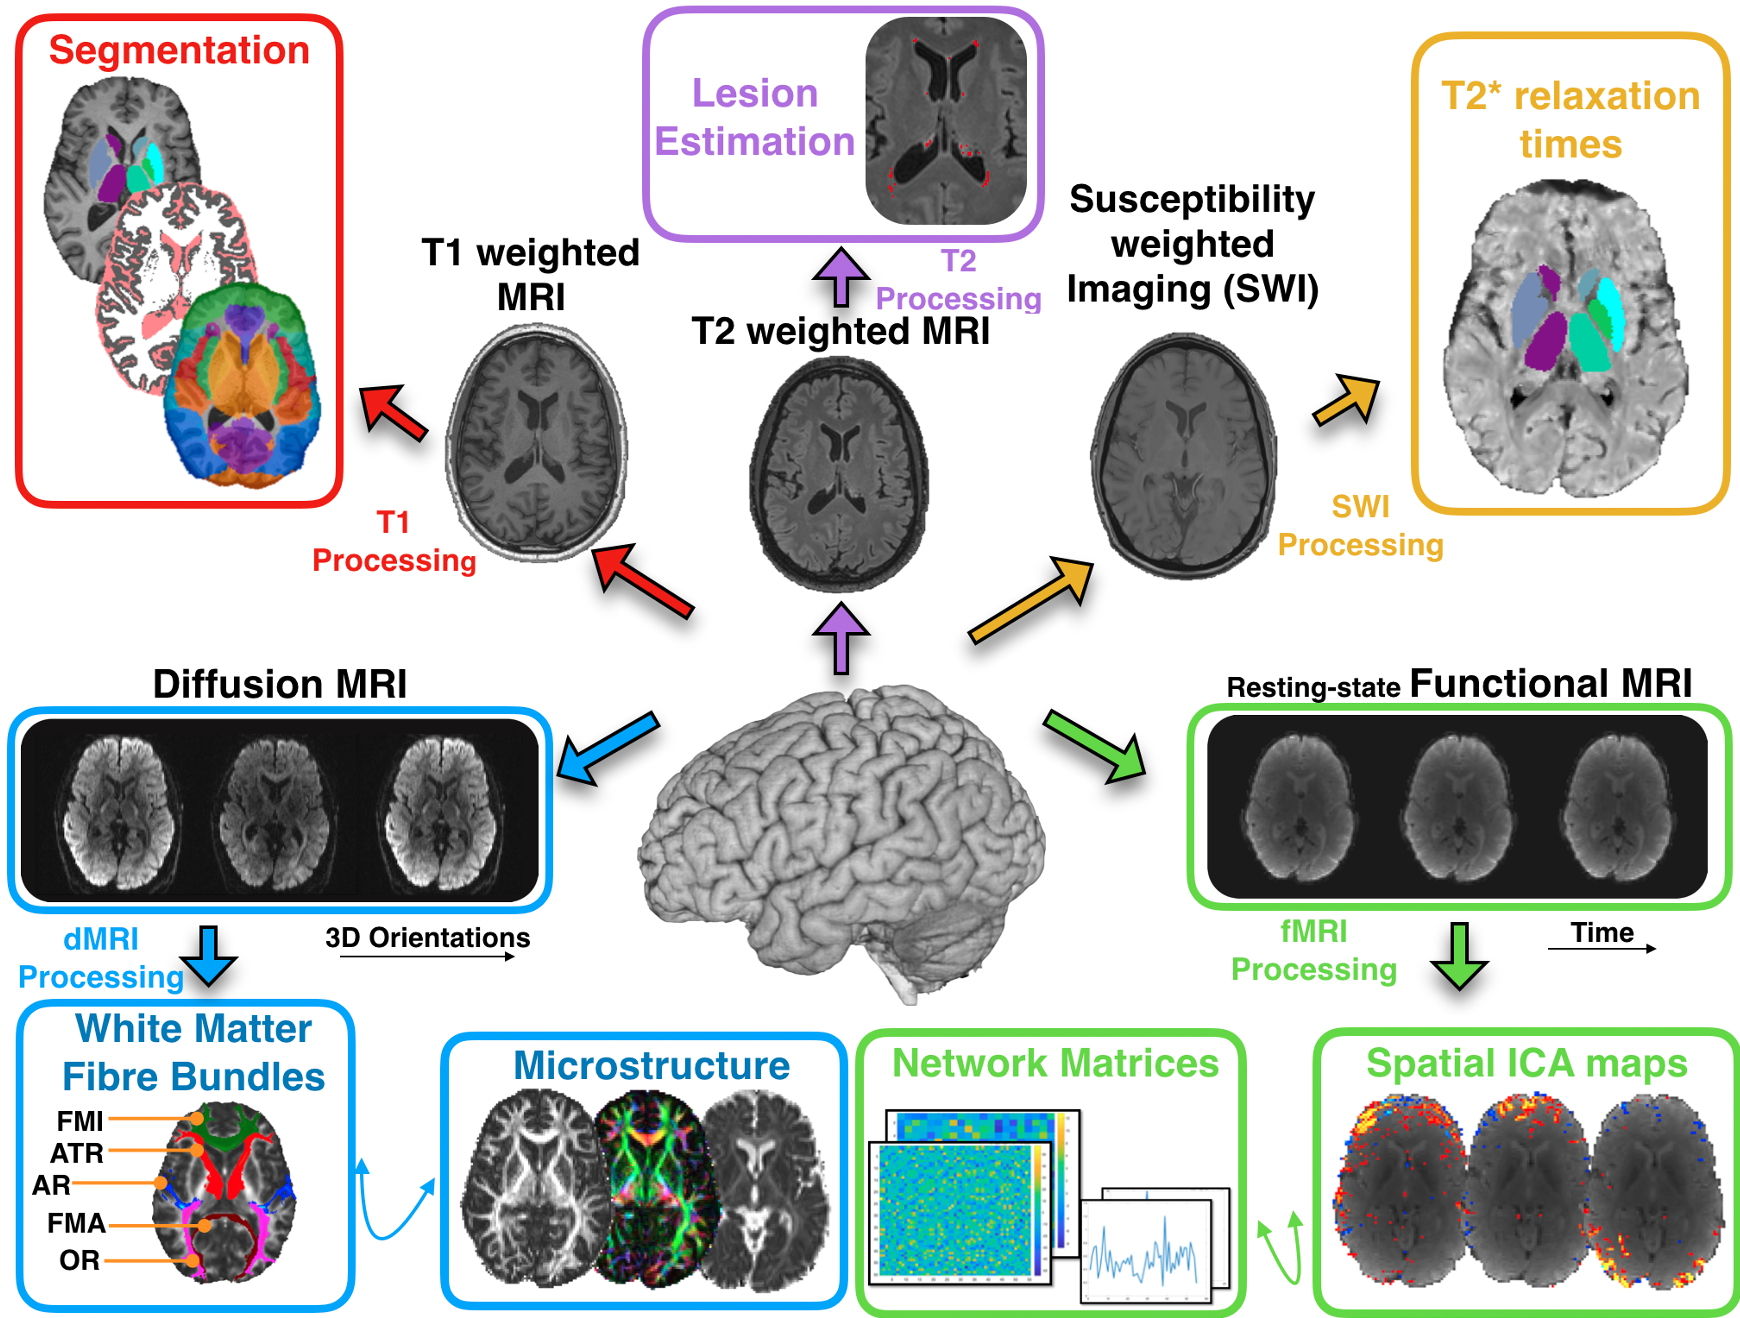
We have acquired brain MRI scans of N=10 healthy subjects (mean age 34±9.4 years), each scanned on six 3T clinical scanners at six different sites. Furthermore, we have acquired scan-rescan datasets (6 repeats of a subject in the same scanner) for M=4 subjects. The scanners cover all 3 major vendors (Siemens/Phillips/GE) and a range of hardware features. Figure 1A shows an overview of all 84, in total, scanning sessions.We acquired data from five neuroimaging modalities: T1w, T2w, diffusion MRI (dMRI), resting-state functional MRI (rfMRI) and susceptibility-weighted imaging (SWI). We were guided by the UK Biobank protocols[10]as a guide, aiming to match them as close as possible across scanners, while respecting best practice for each scanner. Figure 1B shows the main acquisition parameters. To ensure consistent data quality across the scans and sites, we performed extensive quality control, using existing frameworks: MRIQC (for T1w and fMRI) [11]and eddyqc (for dMRI) [12]. The data were then processed with a slightly modified version of the UK biobank pipeline[13]which derives multi-modal neuroimaging features, ranging from volumes of brain regions (derived from structural MRI), to microstructural measures in white matter (from dMRI) and functional connectivity metrics (from rfMRI). An overview of the extracted features is shown in Figure 2. Using these derived features, we computed different variability measures reflecting, for each feature and subject, the within-scanner scan-rescan variability and the between-scanner variability. Finally, we used the acquired data to directly compare existing harmonisation approaches, ComBat and Neuroharmony[6]. ComBatuses an empirical Bayes approach to perform corrections on the data to eliminate differences caused by confounding variables, whereas Neuroharmony uses data from 15,000 subjects to train a model that learns a mapping from Image quality metrics to ComBat-prescribed corrections. Both of these approaches can harmonise Freesurfer-derived cortical regional volumes, extracted from T1w images. For each subject, the between-scanner variability of these features, pre- and post-harmonisation, is compared to the same subject’s within-scanner scan-rescan variability values.Results and Discussion
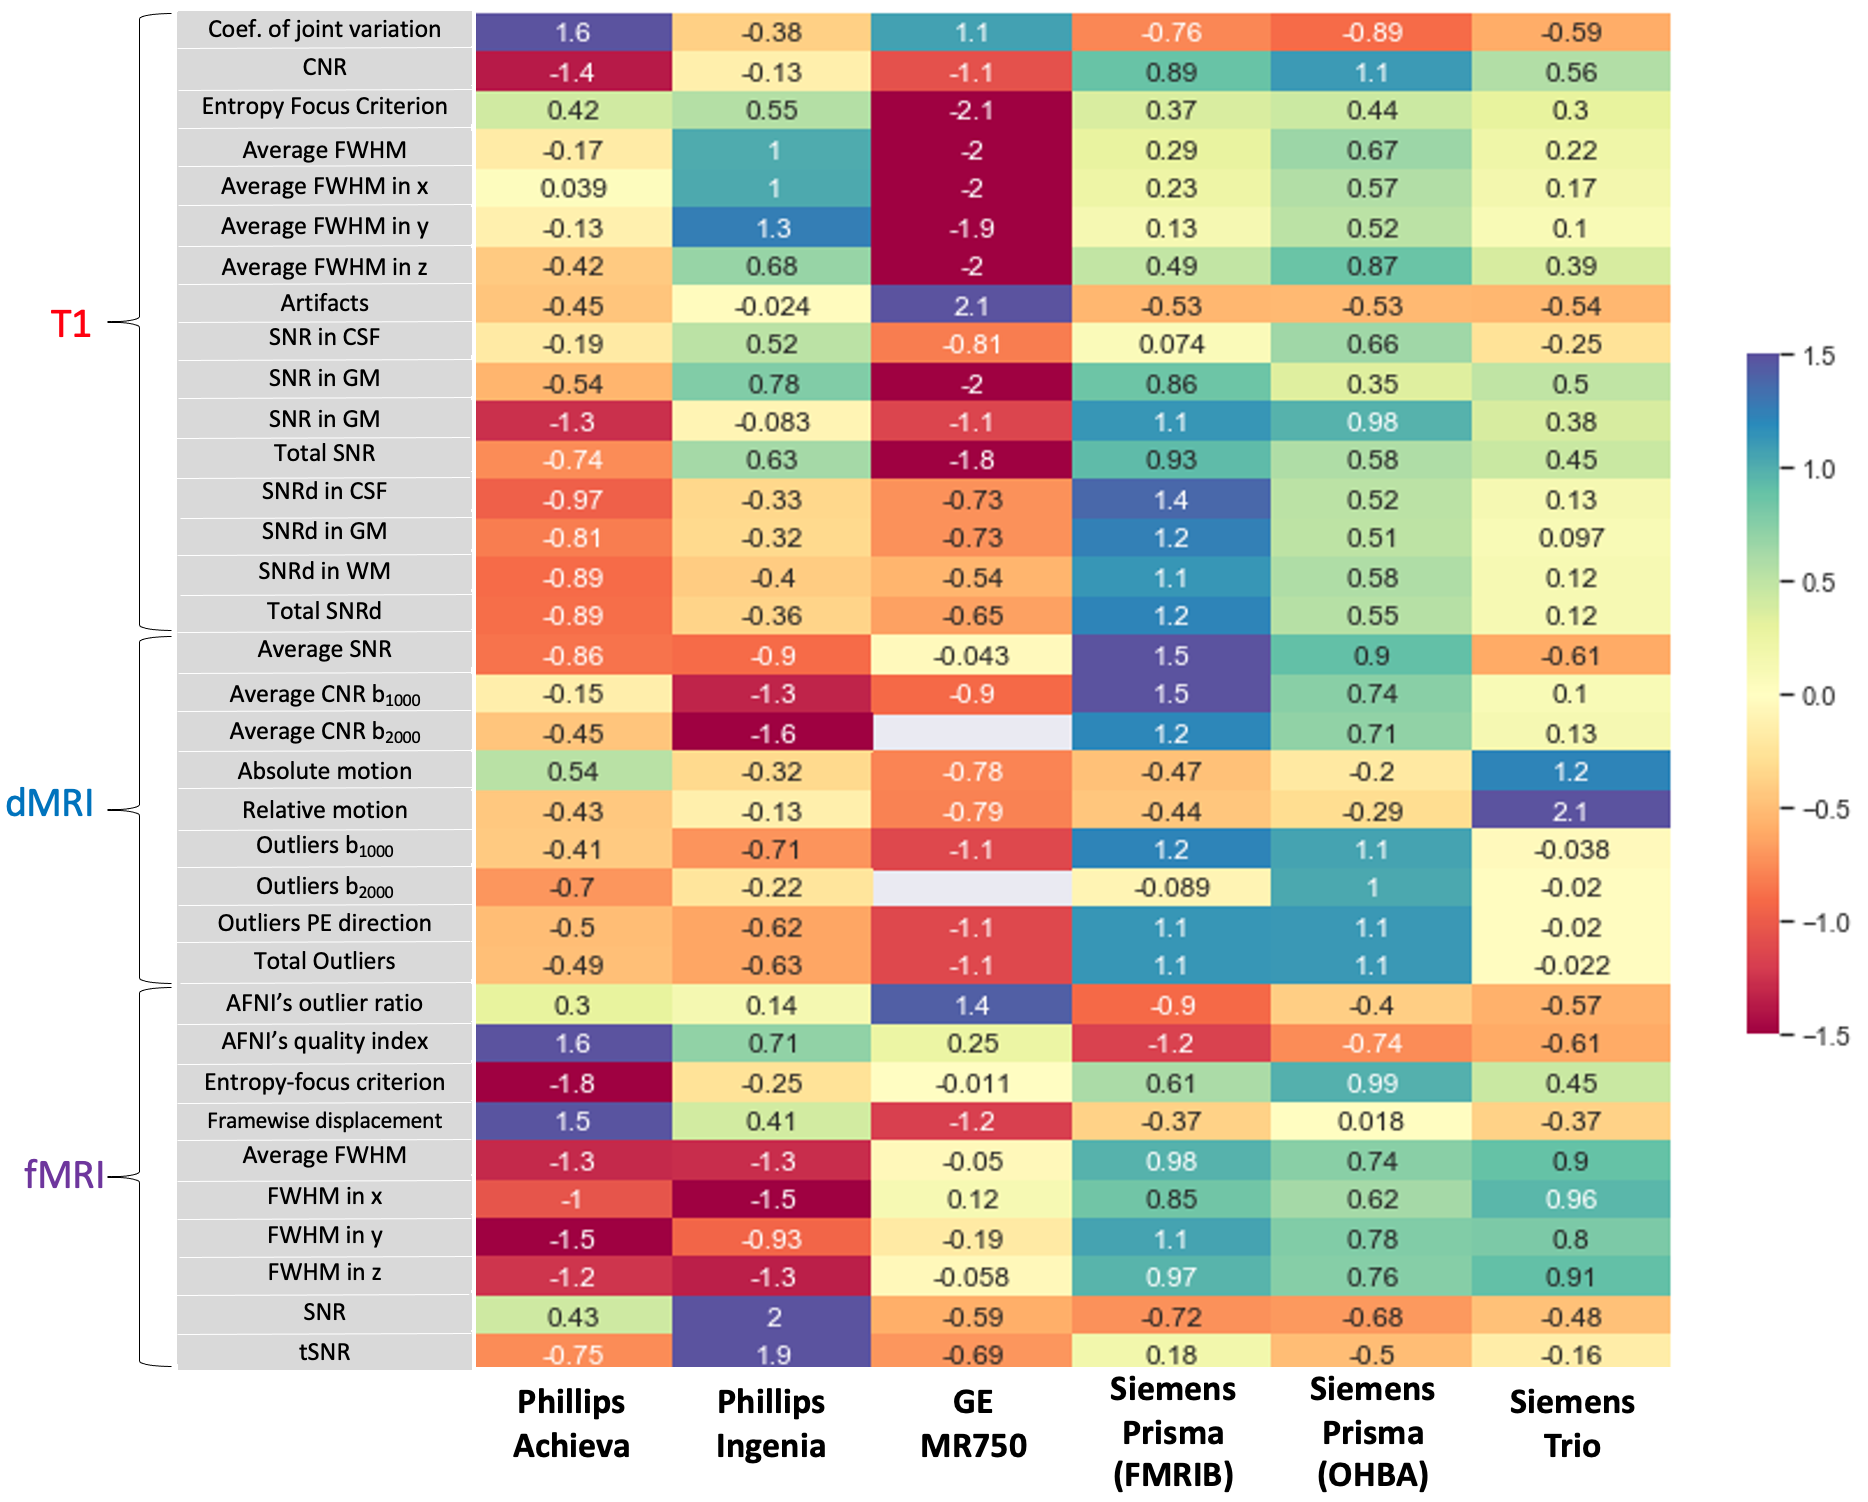
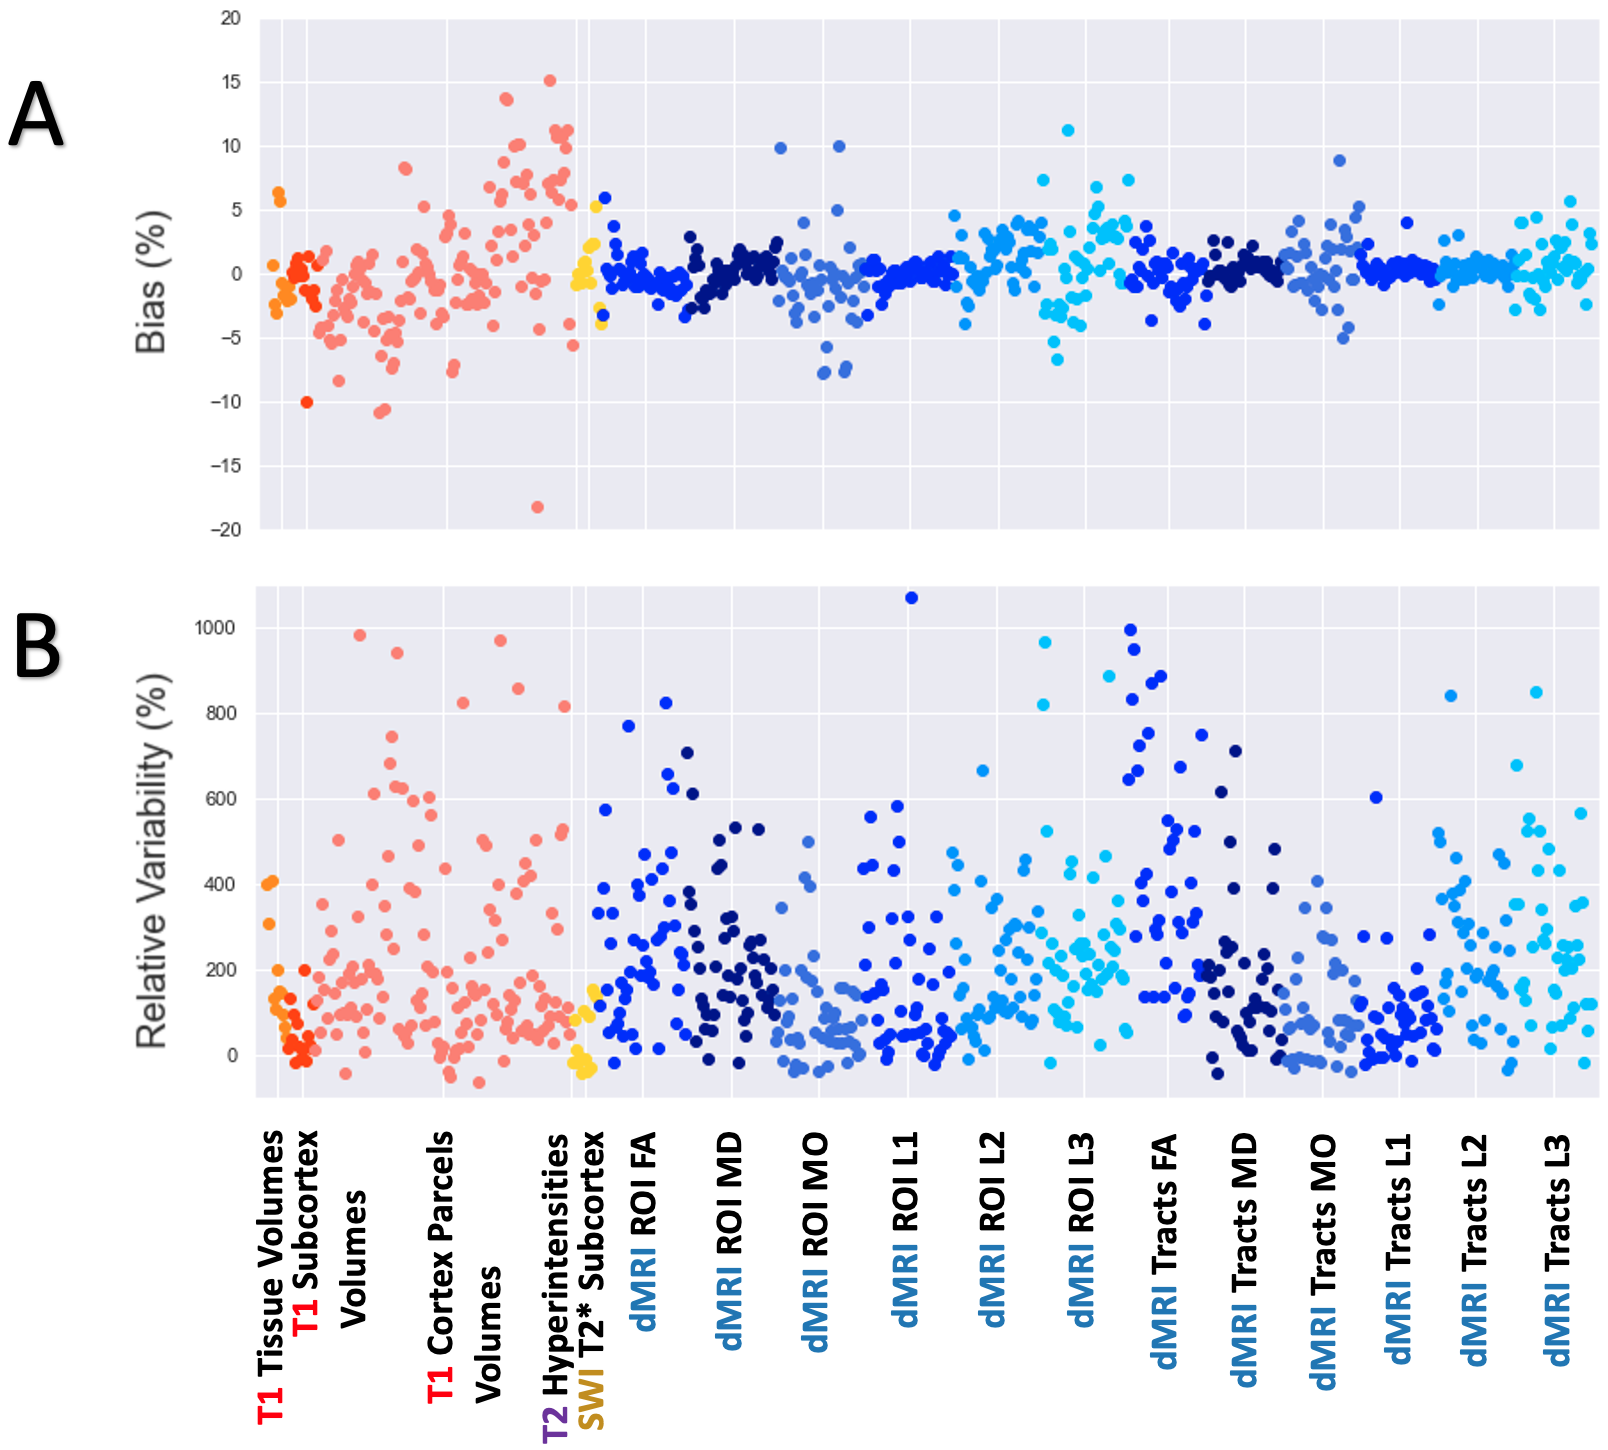
The QC results, grouped by scanner, are displayed in Figure 3. Specifically, QC metrics obtained for each subject were averaged across the 10 subjects within-scanner, and then z-scored, across the 6 scanners. While there is some variability in quality metrics across scanners, there are no extreme outliers, suggesting consistent image quality.We then assessed bias and variability in imaging-derived features from between-scanner measurements (across 6 scanners) and within-scanner measurements (across 6 repeats) each within the same subjects. For each feature, we calculated bias and relative variability of between-scanner with respect to within-scanner measures (Figure 4) using:$$ \text{Bias} = \frac{\text{Median}_{between-scanner}-\text{Median}_{within-scanner}}{\text{Median}_{within-scanner}} \times 100 $$
$$ \text{Relative Variability} = \frac{\text{IQR}_{between-scanner}-\text{IQR}_{within-scanner}}{\text{IQR}_{within-scanner}} \times 100 $$
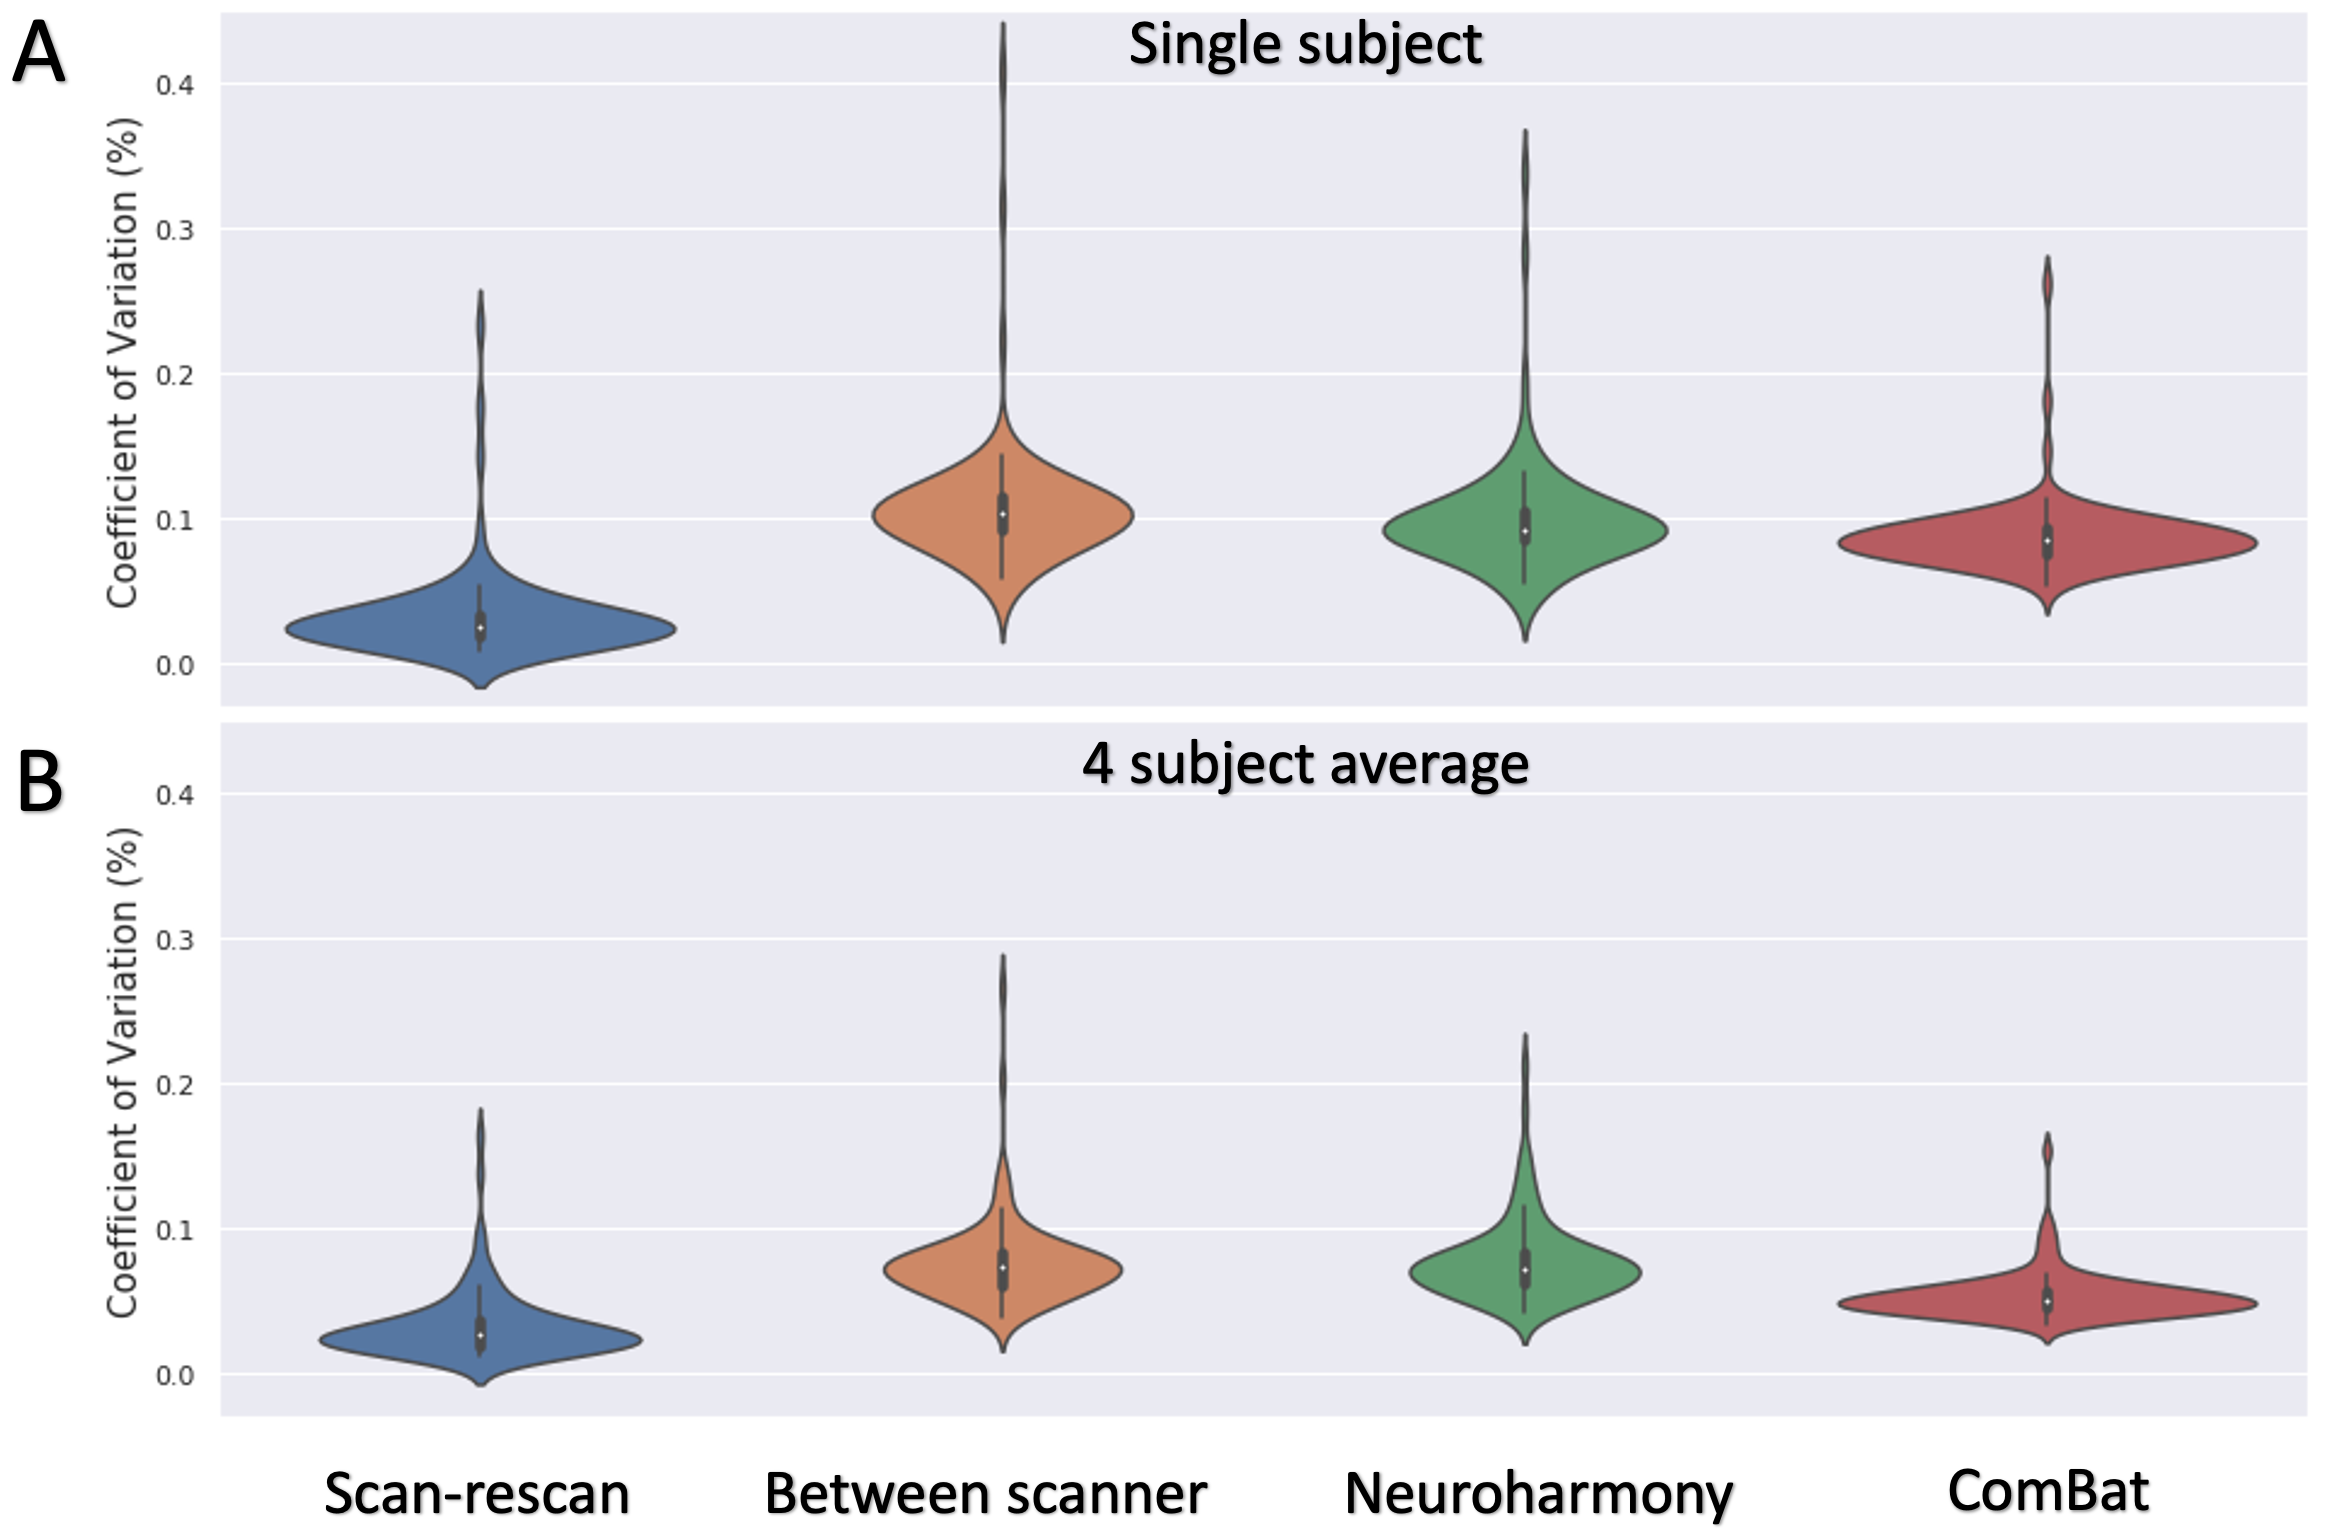
Bias values are typically within 10% (apart from the rfMRI features), but a number of features have the between-scanner variability 5-6 times more than the within-scanner variability (note that rfMRI connectivities exhibited bias in the range 15%-275% and are off-scale in these plots, and therefore omitted). Subsequently, we used the data to evaluate existing harmonisation approaches, using the within-scanner variability as a baseline. Figure 5 shows how variability from Freesurfer-derived cortical regional volumes,harmonised by Neuroharmony and ComBat, compare to unharmonised between-scanner variability and within-scanner repeats for the same subjects. Both harmonisation approaches reduce the initial between-scanner variability (median=0.074) in the considered features, with ComBat (median=0.051) more than Neuroharmony (median=0.073). Even so, they are still considerably higher than within-scanner variability (median=0.027).
Conclusion
We have presented a unique resource, based on a travelling-heads paradigm, aimed at multi-modal neuroimaging data harmonisation. This can map the extent of the between-scanner non-biological variability for various neuroimaging features and assess different harmonisation methods.Acknowledgements
A.N. is supported by funding from the Engineering and Physical Sciences Research Council (EPSRC) and Medical Research Council (MRC) [ONBI CDT, EP/L016052/1]. S.S. is supported by an ERC Consolidator grant (101000969). Scans were partially funded by the NIHR Nottingham Biomedical Research Centre and WIN (Wellcome Trust Center grant -203139/Z/16/Z). The computations were performed using the University of Nottingham’s Augusta HPC service and the Precision Imaging Beacon Cluster.References
[1] X. Han et al., “Reliability of MRI-derived measurements of human cerebral cortical thickness: The effects of field strength, scanner upgrade and manufacturer,” Neuroimage, 2006, doi: 10.1016/j.neuroimage.2006.02.051.
[2] T. Zhu et al., “Quantification of accuracy and precision of multi-center DTI measurements: A diffusion phantom and human brain study,” Neuroimage, vol. 56, no. 3, pp. 1398–1411, 2011, doi: 10.1016/j.neuroimage.2011.02.010.
[3] J. P. Fortin et al., “Harmonization of cortical thickness measurements across scanners and sites,” Neuroimage, 2018, doi: 10.1016/j.neuroimage.2017.11.024.
[4] S. Cetin Karayumak et al., “Retrospective harmonization of multi-site diffusion MRI data acquired with different acquisition parameters HHS Public Access,” Neuroimage, vol. 184, pp. 180–200, 2019, doi: 10.1016/j.neuroimage.2018.08.073.
[5] A. Yamashita et al., Harmonization of resting-state functional MRI data across multiple imaging sites via the separation of site differences into sampling bias and measurement bias, vol. 17, no. 4. 2019.
[6] R. Garcia-dias et al., “Neuroharmony: A new tool for harmonizing volumetric MRI data from unseen scanners,” Neuroimage, p. 117127, 2020, doi: 10.1016/j.neuroimage.2020.117127.
[7] C. M. Tax et al., “Cross-scanner and cross-protocol diffusion MRI data harmonisation: A benchmark database and evaluation of algorithms,” Neuroimage, vol. 195, no. February, pp. 285–299, 2019, doi: 10.1016/j.neuroimage.2019.01.077.
[8] H. Mirzaalian et al., “Inter-site and inter-scanner diffusion MRI data harmonization,” Neuroimage, 2016, doi: 10.1016/j.neuroimage.2016.04.041.
[9] J. P. Fortin et al., “Harmonization of multi-site diffusion tensor imaging data,” Neuroimage, 2017, doi: 10.1016/j.neuroimage.2017.08.047.
[10] K. L. Miller et al., “Multimodal population brain imaging in the UK Biobank prospective epidemiological study.,”Nat. Neurosci., vol. 19, no. 11, pp. 1523–1536, 2016, doi: 10.1038/nn.4393.
[11] O. Esteban, D. Birman, M. Schaer, O. O. Koyejo, R. A. Poldrack, and K. J. Gorgolewski, “MRIQC: Advancing the automatic prediction of image quality in MRI from unseen sites,” PLoS One, vol. 12, no. 9, pp. 1–21, 2017, doi: 10.1371/journal.pone.0184661.
[12] M. Bastiani et al., “Automated quality control for within and between studies diffusion MRI data using a non-parametric framework for movement and distortion correction,” Neuroimage, vol. 184, no. May 2018, pp. 801–812, 2019, doi: 10.1016/j.neuroimage.2018.09.073.
[13] F. Alfaro-Almagro et al., “Image processing and Quality Control for the first 10,000 brain imaging datasets from UK Biobank,” Neuroimage, p. applMNIccleyes, 2018, doi: 10.1016/j.neuroimage.2017.10.034.
Figures