1911
Imaging grey and white matter microstructure simultaneously on a clinical scanner is now possible1Department of Neuroscience, Rehabilitation, Ophthalmology, Genetics, Maternal and Child Health (DINOGMI), University of Genoa, Genoa, Italy, 2Centre for Medical Image Computing (CMIC), Department of Computer Science, University College London, London, United Kingdom, 3Cardiff University Brain Research Imaging Centre (CUBRIC), School of Psychology, Cardiff University, Cardiff, United Kingdom, 4School of Computer Science and Informatics, Cardiff University, Cardiff, United Kingdom, 5Siemens Healthcare s.r.l, Milan, Italy, Milan, Italy, 6HNSR, IRRCS Ospedale Policlinico San Martino, Genoa, Italy, 7Department of Neuroradiology, IRCCS Ospedale Policlinico San Martino, Genoa, Italy, 8IRCCS Ospedale Policlinico San Martino, Genoa, Italy
Synopsis
Diffusion MRI is a powerful technique that, thanks to advanced signal modelling like the Soma And Neurite Density Image (SANDI) can probe microstrucutral information of both grey and white matter. However, this model requires multishell acquisitions including b-values that are at least 6 times higher than those used in clinical practice. Here we propose a 10-minute acquisition protocol that enables to acquire such images on a clinical 3T scanner. We show the reproducibility of our approach on five healthy subjects as well as potential clinical impact on two subjects affected by multiple sclerosis.
Introduction
Diffusion MRI (dMRI) is a powerful technique to quantify brain microstructure1. With the establishment of multishell sequences, different microstructural models and signal representations have been proposed2–4. However, most of them are based on assumptions that are specific to white matter (WM) and very few can be reliably applied to study grey matter (GM). Moreover, despite the many efforts in the field, the clinical usage of multishell sequences to fit multicomparment models is far from established and especially the GM microstructure is mostly studied only on “super scanners” (e.g., Connectom or 7T)5 or on preclinical scanners6. Consequently, in most of the clinical practice only diffusion tensor imaging (DTI)7 is employed.Here we propose a clinically feasible 10-minute multishell acquisition suitable for clinical scanners that allows the characterization of GM and WM microstructure through the Soma And Neurite Density Image (SANDI) model8. We assess its reproducibility on healthy subjects (HS) and potential clinical impact in multiple sclerosis (MS) patients.
Methods
Previous work9 demonstrated that measures of soma (fsoma) and neurite (fneurite) signal fractions and apparent soma radius (Rsoma) from SANDI were highly reliable across multiple GM regions using images acquired on a Connectom scanner10 with maximum b-value=6000s/mm2. We implemented a protocol based on a spin-echo sequence11–13 for multishell dMRI acquisition on a 3T Siemens MAGNETOM Prisma (Siemens Healthcare, Erlangen, Germany) with 64CH coil and the following parameters: TE/TE/δ/Δ=2600/80/24.66/39.07ms, resolution=2×2×2mm3, 72 slices, axial orientation, FOV=200×200, GRAPPA=2, multi-band=4, Partial Fourier=6/8, with b-values=0/500/1000/2000/3000/4000/6000s/mm2 with 15/6/32/40/40/40/40 measurements per shell in anterior-posterior phase encoding (TA=10’01”) as well as one b-value=0s/mm2 with reversed phase encoding (TA=47”).Five HS (2 females, 3 males ages 25-32yrs) were scanned twice with bed repositioning to reset scanner settings and test the repeatability of both acquisition protocol and microstructural metrics. Additional 3D sagittal MPRAGE image (TR/TI/TE=2300/919/2.96ms; resolution=1×1×1mm3) was acquired for segmenting GM and WM regions of interest (ROIs) according to Desikan-Killany14 atlas using FreeSurfer 6.0.
dMRIs were preprocessed with denoise15,16, degibbs17, Rician bias correction18, movement artifacts and susceptibility induced distortions removal19–22, N4-bias correction23. Using appropriate shells, we fit the following models recovering the relative microstrucutral metrics: fractional anisotropy (FA), mean, radial and axial diffusivities (MD, RD, AD) for DTI using FSL19; intra-cellular and isotropic signal fractions (ICVF and ISOVF) and orientation dispersion index (OD) for the neurites orientation dispersion and density image (NODDI)24,25; fneurite, fsoma, extracellular density (fextra), Rsoma and intra and extra neurites diffusivities (Din, De) for SANDI using AMICO25. We rigidly co-registered26,27 in dMRI space the 84 GM ROIs and grouped those, and the corresponding WM ones, to form the major lobes: temporal, cingulate, occipital, frontal, parietal, insula, subcortical and cerebellum. We then extracted the mean value of every microstructural map in each mask. Finally, we evaluated the reliability of each diffusion metric per subject and per tract using the test–retest variability (TRV), the intraclass correlation coefficient (ICC), Pearson’s r and derived R2 as in28,29.
As a proof-of-concept for the clinical utility of this protocol, two MS subjects were also acquired adding a 3D sagittal T2-FLAIR (TR/TI/TE=5000/1800/393ms; resolution=0.4×0.4×1mm3) for lesions’ segmentation.
Results and Discussion
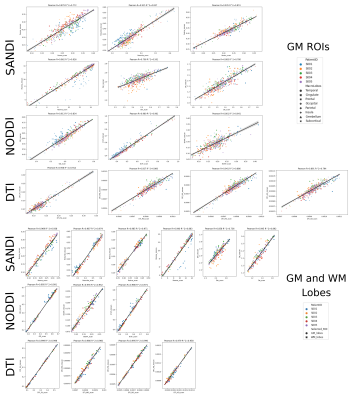
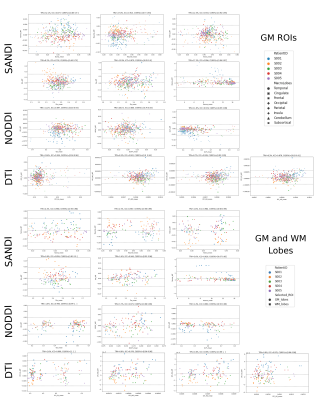
Fig.1 reports sample images of the proposed protocol for one HS and relative SANDI-derived metrics and compare them with those obtained in one subject acquired with Connectom scanner10. Overall, the quality of the raw images is good, and the pattern of the estimated maps coincides with those of the Connectom.Fig.2 and 3 report respectively the scatter and Bland-Altman plots with overlayed r, R2 and TRV, ICC, 95% confidence interval of scan-rescan diffusion metrics values in the 84 GM ROIs as well as GM/WM lobes. These plots and indices show that the repeatability and reproducibility of SANDI is comparable with those of DTI and NODDI (ICC> 0.7 and R2>0.7). Moreover, in addition to the information obtained with DTI and NODDI, SANDI provides new indices of fsoma and Rsoma. However, our implementation on a clinical scanner used slightly longer gradient pulses and diffusion times, hence the SANDI estimates, especially fneurite and Rsoma, may be biased by unaccounted inter-compartmental exchange30.
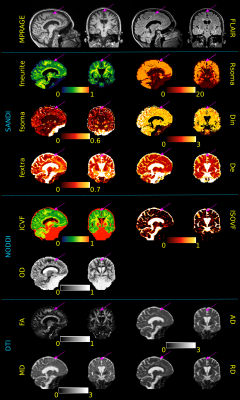
Fig.4 reports metrics estimated in one MS patient. Arrows indicate a GM lesion. We appreciate that although DTI and NODDI metrics appear altered, SANDI provides a deeper characterization of cellular damage showing a decrease in fsoma, Rsoma and fneurite coupled by an increase of fextra. This might indicate a decrease in neuronal density and size, resulting in a depletion of dendritic processes and in an increase in the free water content as previously observed in histopathological studies31.
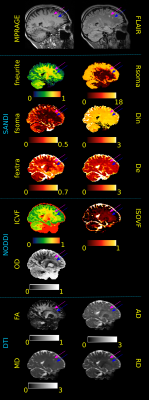
Fig.5 reports metrics estimated in another MS patient. The arrows indicate two WM lesions.
Here, DTI-metrics show the same alterations in both lesions, while NODDI-ISOVF results increased only in one. Instead, SANDI depicts an increase of fextra in both lesions, but fsoma results increased only in one. This may suggest an infiltration of blood-derived monocytes, microglia and T cells diffusely throughout the lesion area32.
Conclusions
We derived a clinically feasible dMRI protocol for 3T scanners that can reliably assess GM and WM microstructure. Making such a tool available on clinical scanners will provide the opportunity to study simultaneously GM and WM alterations and better capture the progression of neurological disease as well as characterize brain development.Acknowledgements
The authors acknowledge that Software from the University of Minnesota Center for Magnetic Resonance Research was used in this work. MP is supported by UKRI Future Leaders Fellowship (MR/T020296/1).
References
1. Basser PJ, Mattiello J, LeBihan D. MR diffusion tensor spectroscopy and imaging. Biophys J. 1994;66(1):259-267. http://www.sciencedirect.com/science/article/B94RW-4V8RX5Y-12/2/36ce2e0578f0d9aa71694d152b118e56.
2. Novikov DS, Kiselev VG, Jespersen SN. On modeling. Magn Reson Med. 2018;79(6):3172-3193. doi:10.1002/mrm.27101
3. Alexander DC, Dyrby TB, Nilsson M, Zhang H. Imaging brain microstructure with diffusion MRI: practicality and applications. NMR Biomed. 2019;32(4):e3841. doi:10.1002/nbm.3841
4. Jelescu IO, Budde MD. Design and Validation of Diffusion MRI Models of White Matter. Front Phys. 2017;5:61. doi:10.3389/fphy.2017.00061
5. Jones DK, Alexander DC, Bowtell R, et al. Microstructural imaging of the human brain with a ‘super-scanner’: 10 key advantages of ultra-strong gradients for diffusion MRI. Neuroimage. 2018. doi:10.1016/j.neuroimage.2018.05.047
6. Jelescu IO, Palombo M, Bagnato F, Schilling KG. Challenges for biophysical modeling of microstructure. J Neurosci Methods. 2020. doi:10.1016/j.jneumeth.2020.108861
7. Le Bihan D, Mangin J-F, Poupon C, et al. Diffusion tensor imaging: concepts and applications. J Magn Reson imaging. 2001;13(4):534-546. http://onlinelibrary.wiley.com/doi/10.1002/jmri.1076/full.
8. Palombo M, Ianus A, Guerreri M, et al. SANDI: A compartment-based model for non-invasive apparent soma and neurite imaging by diffusion MRI. Neuroimage. 2020;215:116835. doi:https://doi.org/10.1016/j.neuroimage.2020.116835
9. Genc S, Chamberland M, Koller K, et al. Repeatability of soma and neurite metrics in cortical and subcortical grey matter. bioRxiv. 2020.
10. Koller K, Rudrapatna U, Chamberland M, et al. MICRA: Microstructural image compilation with repeated acquisitions. Neuroimage. 2021;225:117406. doi:https://doi.org/10.1016/j.neuroimage.2020.117406
11. Xu J, Moeller S, Auerbach EJ, et al. Evaluation of slice accelerations using multiband echo planar imaging at 3T. Neuroimage. 2013. doi:10.1016/j.neuroimage.2013.07.055
12. Feinberg DA, Moeller S, Smith SM, et al. Multiplexed echo planar imaging for sub-second whole brain fmri and fast diffusion imaging. PLoS One. 2010. doi:10.1371/journal.pone.0015710
13. Moeller S, Yacoub E, Olman CA, et al. Multiband multislice GE-EPI at 7 tesla, with 16-fold acceleration using partial parallel imaging with application to high spatial and temporal whole-brain FMRI. Magn Reson Med. 2010. doi:10.1002/mrm.22361
14. Desikan RS, Ségonne F, Fischl B, et al. An automated labeling system for subdividing the human cerebral cortex on MRI scans into gyral based regions of interest. Neuroimage. 2006;31(3):968-980. doi:10.1016/J.NEUROIMAGE.2006.01.021
15. Tournier J-D, Smith R, Raffelt D, et al. MRtrix3: A fast, flexible and open software framework for medical image processing and visualisation. Neuroimage. 2019;202:116137. doi:https://doi.org/10.1016/j.neuroimage.2019.116137
16. Cordero-Grande L, Christiaens D, Hutter J, Price AN, Hajnal J V. Complex diffusion-weighted image estimation via matrix recovery under general noise models. Neuroimage. 2019. doi:10.1016/j.neuroimage.2019.06.039
17. Kellner E, Dhital B, Kiselev VG, Reisert M. Gibbs-ringing artifact removal based on local subvoxel-shifts. Magn Reson Med. 2016. doi:10.1002/mrm.26054
18. Ades-Aron B, Veraart J, Kochunov P, et al. Evaluation of the accuracy and precision of the diffusion parameter EStImation with Gibbs and NoisE removal pipeline. Neuroimage. 2018. doi:10.1016/j.neuroimage.2018.07.066
19. Smith SM, Jenkinson M, Woolrich MW, et al. Advances in functional and structural MR image analysis and implementation as FSL. In: NeuroImage. ; 2004. doi:10.1016/j.neuroimage.2004.07.051
20. Andersson JLR, Graham MS, Zsoldos E, Sotiropoulos SN. Incorporating outlier detection and replacement into a non-parametric framework for movement and distortion correction of diffusion MR images. Neuroimage. 2016;141:556-572. doi:https://doi.org/10.1016/j.neuroimage.2016.06.058
21. Andersson JLR, Sotiropoulos SN. An integrated approach to correction for off-resonance effects and subject movement in diffusion MR imaging. Neuroimage. 2016;125:1063-1078. doi:10.1016/J.NEUROIMAGE.2015.10.019
22. Andersson JLR, Skare S, Ashburner J. How to correct susceptibility distortions in spin-echo echo-planar images: application to diffusion tensor imaging. Neuroimage. 2003;20(2):870-888. doi:https://doi.org/10.1016/S1053-8119(03)00336-7
23. Tustison NJ, Avants BB, Cook PA, et al. N4ITK: improved N3 bias correction. IEEE Trans Med Imaging. 2010;29(6):1310-1320. doi:10.1109/TMI.2010.2046908
24. Zhang H, Schneider T, Wheeler-Kingshott CA, Alexander DC. {NODDI}: {P}ractical in vivo neurite orientation dispersion and density imaging of the human brain. Neuroimage. 2012;61(4):1000-1016. doi:http://dx.doi.org/10.1016/j.neuroimage.2012.03.072
25. Daducci A, Canales-Rodríguez EJ, Zhang H, Dyrby TB, Alexander DC, Thiran J-P. Accelerated Microstructure Imaging via Convex Optimization (AMICO) from diffusion MRI data. Neuroimage. 2015;105:32-44. doi:http://dx.doi.org/10.1016/j.neuroimage.2014.10.026
26. Greve DN, Fischl B. Accurate and robust brain image alignment using boundary-based registration. Neuroimage. 2009;48(1):63-72. doi:https://doi.org/10.1016/j.neuroimage.2009.06.060
27. Jenkinson M, Bannister P, Brady M, Smith S. Improved Optimization for the Robust and Accurate Linear Registration and Motion Correction of Brain Images. Neuroimage. 2002;17(2):825-841. doi:https://doi.org/10.1006/nimg.2002.1132
28. Veraart J, Raven EP, Edwards LJ, Weiskopf N, Jones DK. The variability of MR axon radii estimates in the human white matter. Hum Brain Mapp. 2021. doi:10.1002/hbm.25359
29. Palombo M, Valindria V, Singh S, et al. Joint estimation of relaxation and diffusion tissue parameters for prostate cancer grading with relaxation-VERDICT MRI. medRxiv. January 2021:2021.06.24.21259440. doi:10.1101/2021.06.24.21259440
30. Jelescu IO, de Skowronski A, Palombo M, Novikov DS. Neurite Exchange Imaging (NEXI): A minimal model of diffusion in gray matter with inter-compartment water exchange. 2021.
31. Wegner C, Esiri MM, Chance SA, Palace J, Matthews PM. Neocortical neuronal, synaptic, and glial loss in multiple sclerosis. Neurology. 2006. doi:10.1212/01.wnl.0000237551.26858.39
32. Kuhlmann T, Ludwin S, Prat A, Antel J, Brück W, Lassmann H. An updated histological classification system for multiple sclerosis lesions. Acta Neuropathol. 2017. doi:10.1007/s00401-016-1653-y
Figures

Figure 1: Visual inspection of dMRI data acquired in one healthy subject with our sequence and corresponding SANDI microstructural metrics obtained. As comparison, in the last row, we report the same SANDI maps obtained in one subject of the MICRA dataset10 acquired on the Connectom scanner. Diffusivities are reported in μm2/ms, Rsoma in μm.

Figure 2: Scatter plots of scan-rescan microstructural metrics extracted from the 84 GM ROIs of Desikan-Killany atlas as well as both GM and WM major lobes. Points are color coded by subjects and markers indicate which lobe (top) or tissue (bottom) they were extracted from. Above of each plot we also report the Pearson r and recovered R2 of the linear regression.

Figure 3: Bland-Altman plots of scan-rescan microstructural metrics extracted from the 84 GM ROIs of Desikan-Killany atlas as well as both GM and WM major lobes. Points are color coded by subjects and markers indicate which lobe (top) or tissue (bottom) they were extracted from. Above of each plot we also report the estimated TRV, ICC and 95% confidence interval (CI).

Figure 4: Sagittal and coronal views of MPRAGE and FLAIR images as well as SANDI, NODDI and DTI metrics of a MS subject. Purple arrows indicate the location of a cortical lesion to be compared with the surrounding normal appearing GM tissue. Although alterations in DTI and NODDI metrics are also visible (increased AD, MD, RD and ISOVF as well as decrease in ICVF), SANDI provides a deeper understanding of the pathological process underlying the lesioned tissue showing a decrease in fneurite, fsoma, Rsoma and increase in fextra and De. Diffusivities are reported in μm2/ms, Rsoma in μm.

Figure 5: Sagittal view of MPRAGE, FLAIR images and SANDI, NODDI and DTI metrics of a MS subject. Purple and blue arrows indicate the location of 2 WM lesion to be compared with the normal appearing WM tissue. DTI shows increase in AD, MD, RD in both lesions; NODDI decrease in ICVF in both and increase in ISOVF only in the purple one; SANDI decrease in fneurite and increase in fextra in both and increase in Rsoma and De only in the purple one. Thus, SANDI depicts a different pathological mechanism in the 2 lesions that appear very similar in FLAIR and MPRAGE. Diffusivities are in μm2/ms, Rsoma in μm.