1896
Investigating the effect of reduced TR in detection of RSNs at a low field MR scanner1Medical Biophysics, Western University, London, ON, Canada, 2Radbound University, Nijmegen, Netherlands, 3Physics and Astronomy, Western University, London, ON, Canada, 4xMR Labs, London, ON, Canada
Synopsis
Initial investigation of effects due to reduced TR on RSNs at a 0.5 T MR scanner. There was a decrease in detected regions within specific networks for the 3 T data as TR was reduced. However, when the tSNR was approximately 17 ignoring the expected decrement of detected regions compared to the 3 T data, there was an increase in positive detection at shorter TR. These result show the possibility of extracting true RSNs for a low field scanner using shorter TRs which can lead to efficient sequence design since T1 is shortened at low fields.
INTRODUCTION
Low field magnetic resonance imaging (MRI) scanners [1] address the needs of accessibility and cost often associated with traditional systems, allowing increased use in economical limited countries and in specific applications, such as point-of-care and intraoperative monitoring. According to National Institutes of Health Stroke Scale there is a direct relationship between the functional state of brain connectivity and neurological outcome in patients assessed on the third day after the stroke, by increasing the accuracy from 84% to 94% as independent predictor of 90-day modified Rankin Scale, measured with the use of functional MRI (fMRI) [2]. Therefore, it seems important to perform resting state fMRI in patients with cerebrovascular and traumatic injuries aiming to predict long-term neurological outcomes. For such studies, the availability of resting state blood oxygen dependent (BOLD) fMRI at lower field scanners will provide clinical utility in economically limited countries. It is therefore essential to determine the ability of such a low field scanner to measure the resting state networks. This study considers using a superconducting, head-only 0.5 T Evry system equipped with a high-performance gradient coil [3,4]. Most fMRI studies are considered to benefit from high fields due to the intrinsic signal to noise ratio (SNR) which scales with field strength and the increase in magnetic susceptibility contrast that underlies BOLD fMRI. Therefore, before performing experimental studies with this system, it was essential to evaluate the possibility of detecting true resting state networks at such field strengths with simulated functional datasets. The shortened T1 at lower field strength enables efficient sequence design by reducing repetition time (TR). As the part of this abstract, we investigated the effect of varying TR on the detection of resting state networks (RSNs) as the field is reduced.METHOD
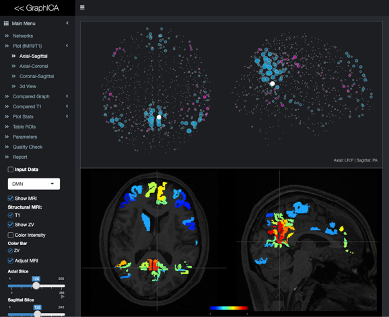
Resting state functional and structural data were collected with a 3 T Siemens scanner involving 20 healthy volunteers with a TR of 1000 and 2000 ms. The difference in BOLD contrast [5] between a 0.5 T and 3 T scanner was used to modify the voxel specific signal collected from the 3 T scanner. Additional Rician noise of varying scale parameters was multiplied with the noise from the 3 T scanner to account for the reduced SNR. The final amount of introduced noise is a summation of the additional noise with the original noise extracted from the 3 T scanner. Summation of the modified signal and noise provides the timeseries for each voxel. For this study, temporal signal to noise ratio (tSNR) was used to characterize reduced field strength. Connectivity analysis was performed using GraphICA a functional connectivity analysis platform developed by Brainet (Brain Imaging Solutions Inc.) as shown in Figure 1 which performs independent component analysis (ICA) based on dual regression [6] implemented in FSL. GraphICA uses a gradient-weighted Markov Random Field (gwMRF) parcellation [7] technique along with a mixture model approach for thresholding [8].RESULTS
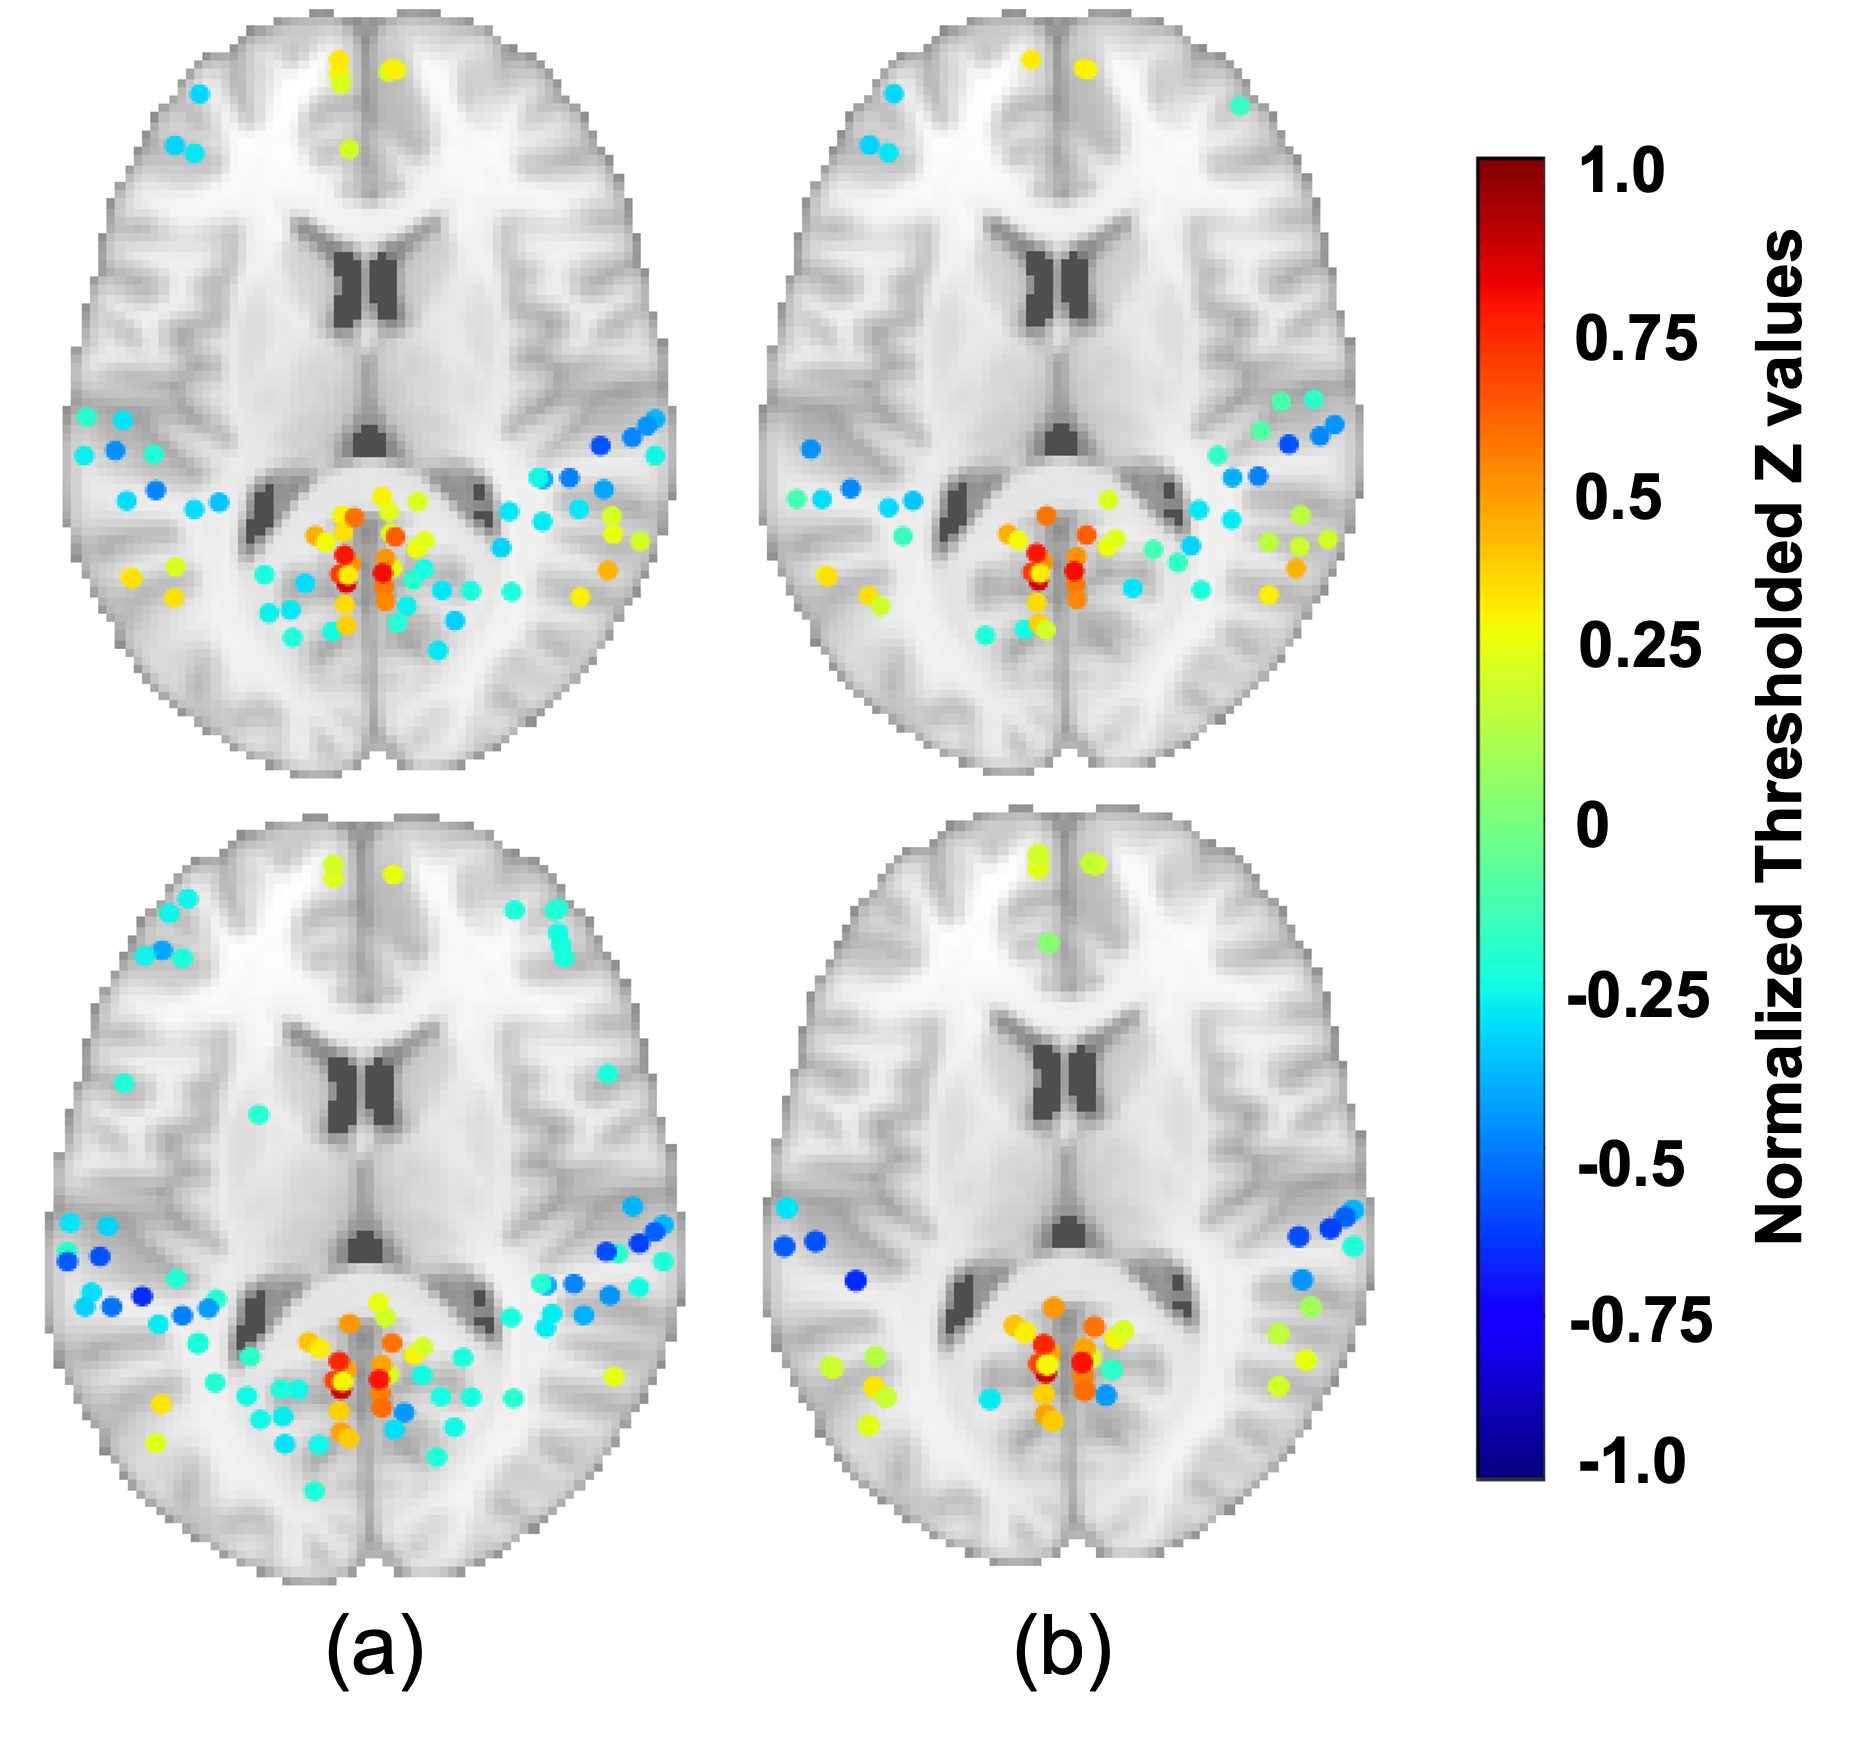
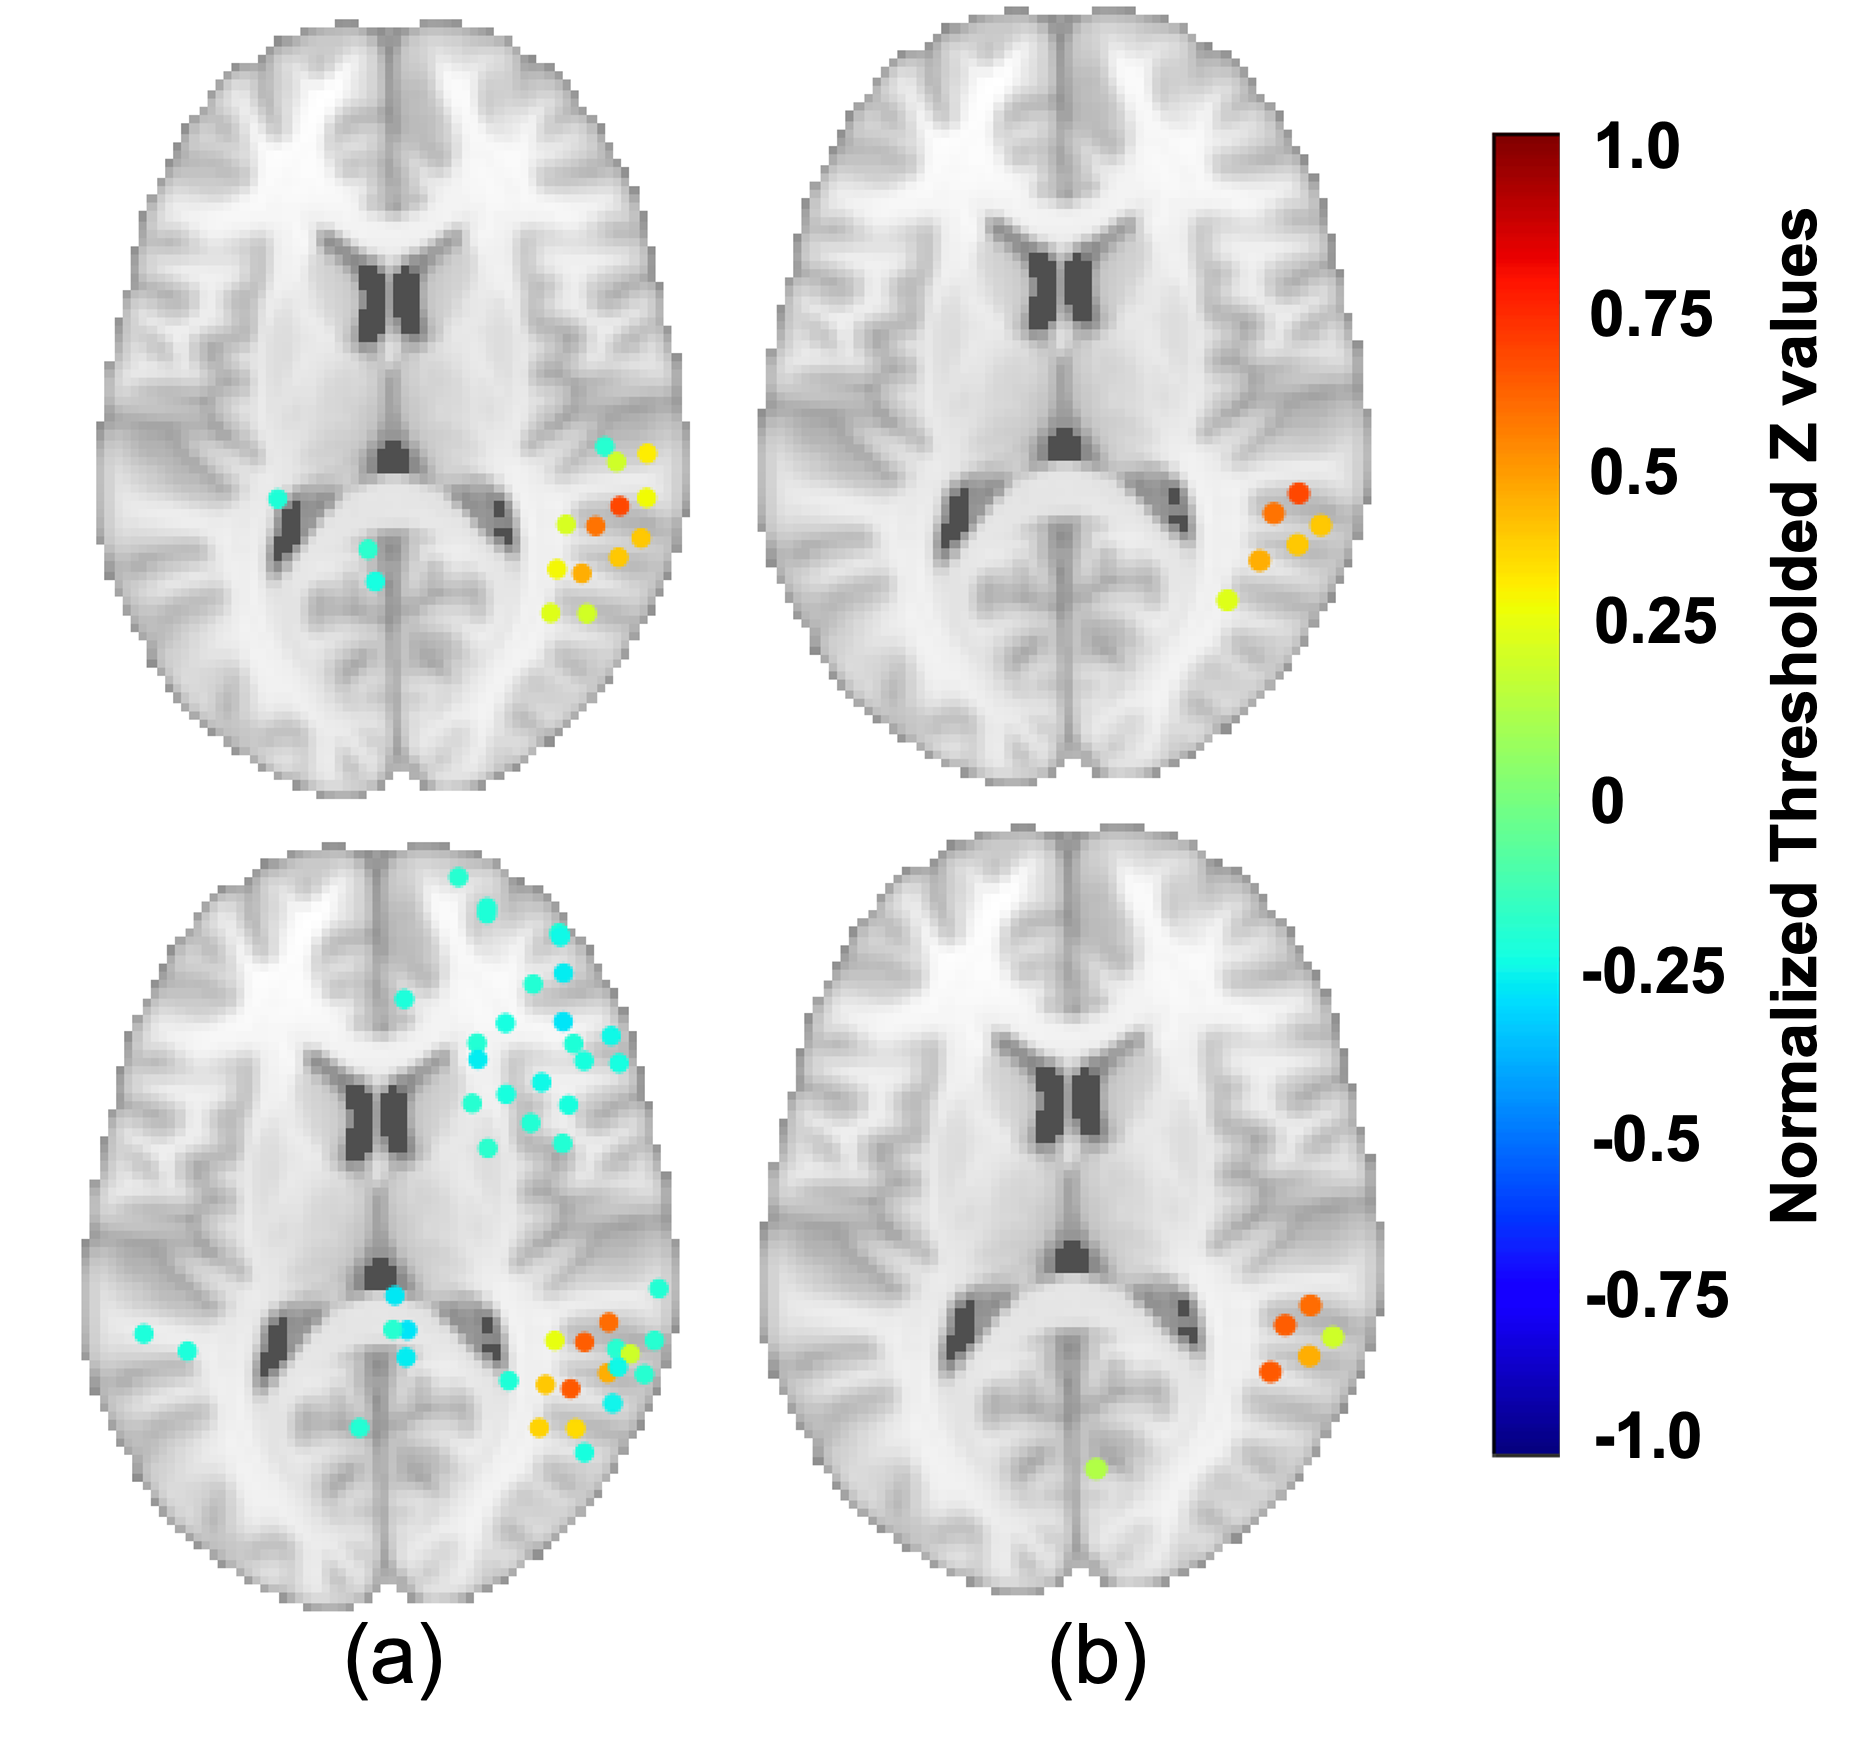
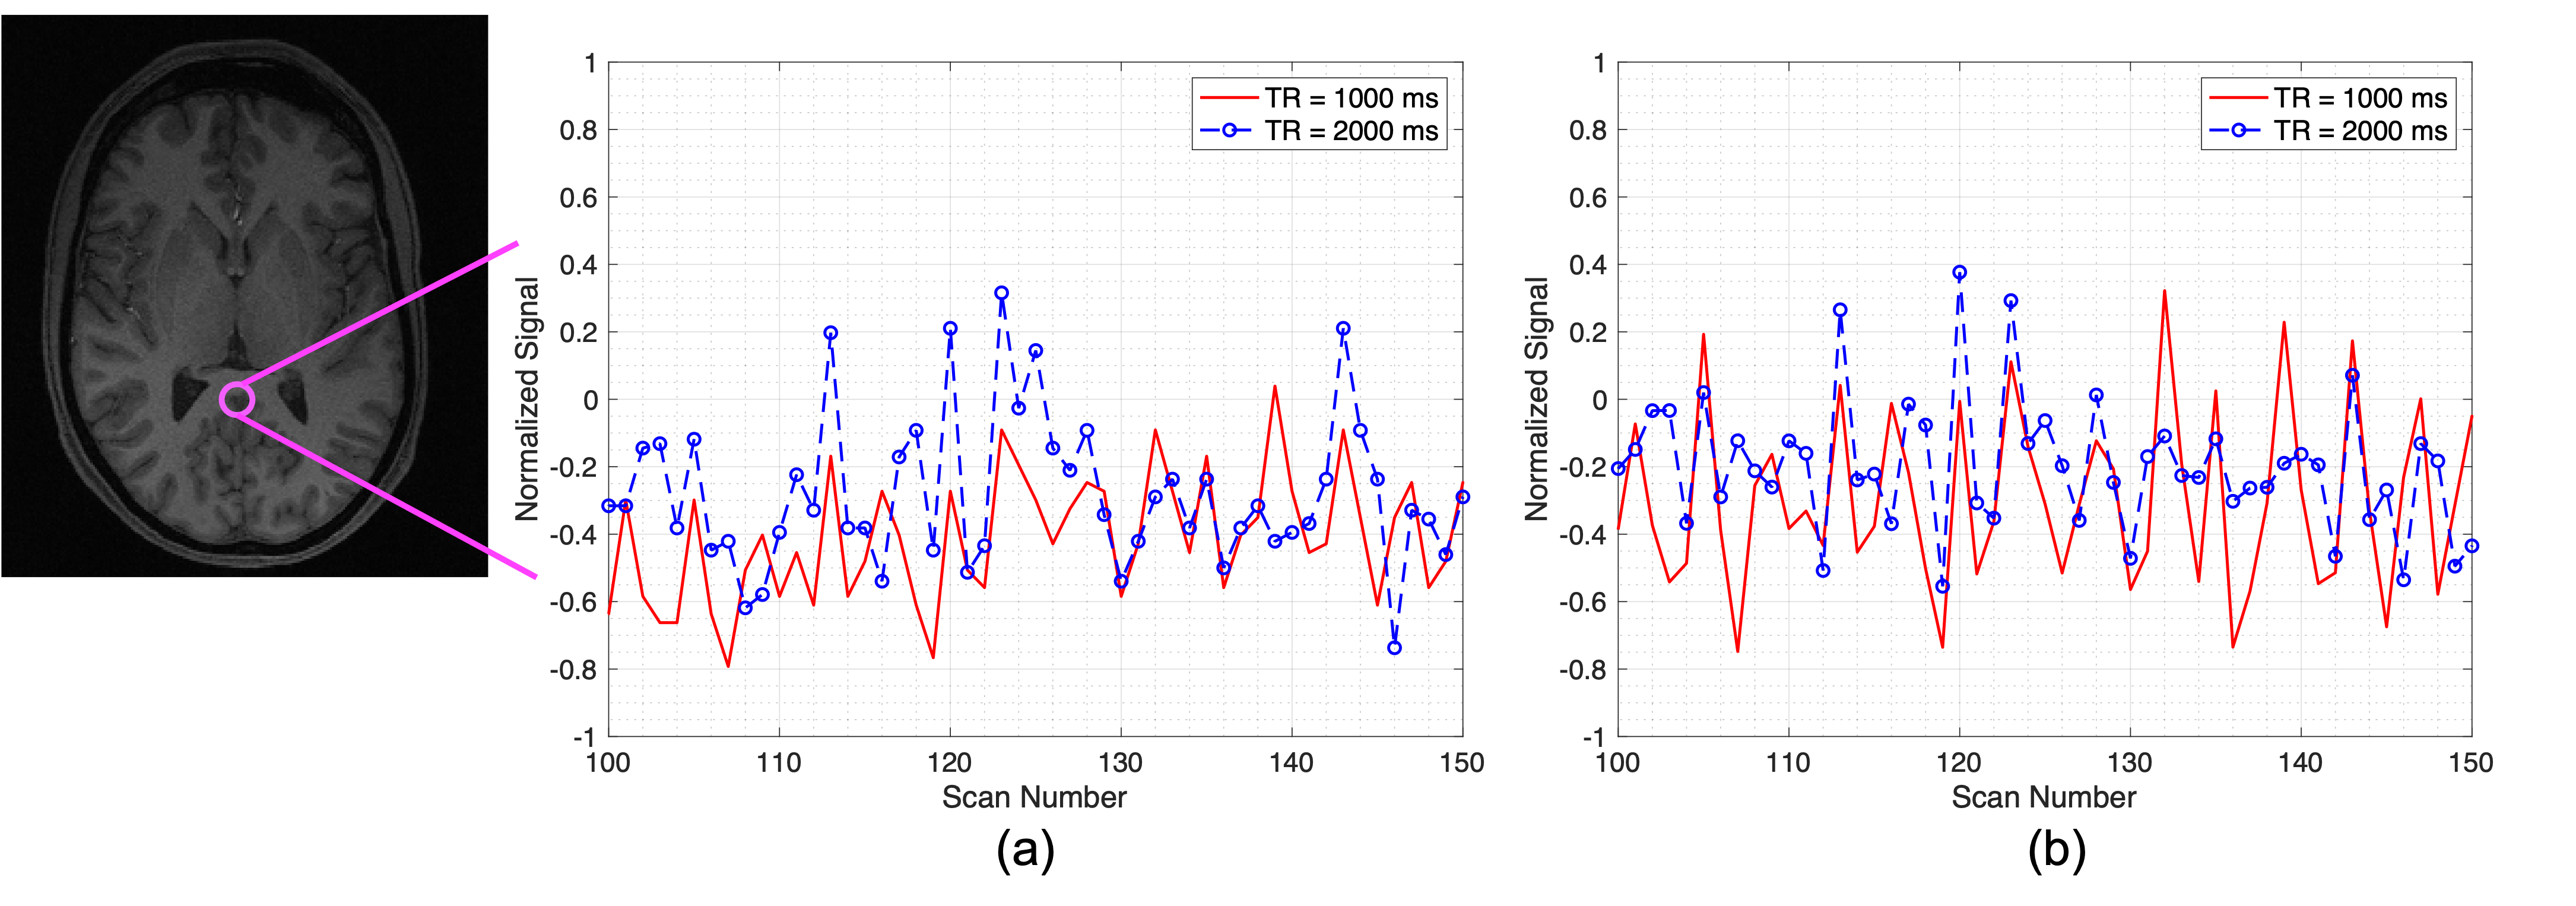
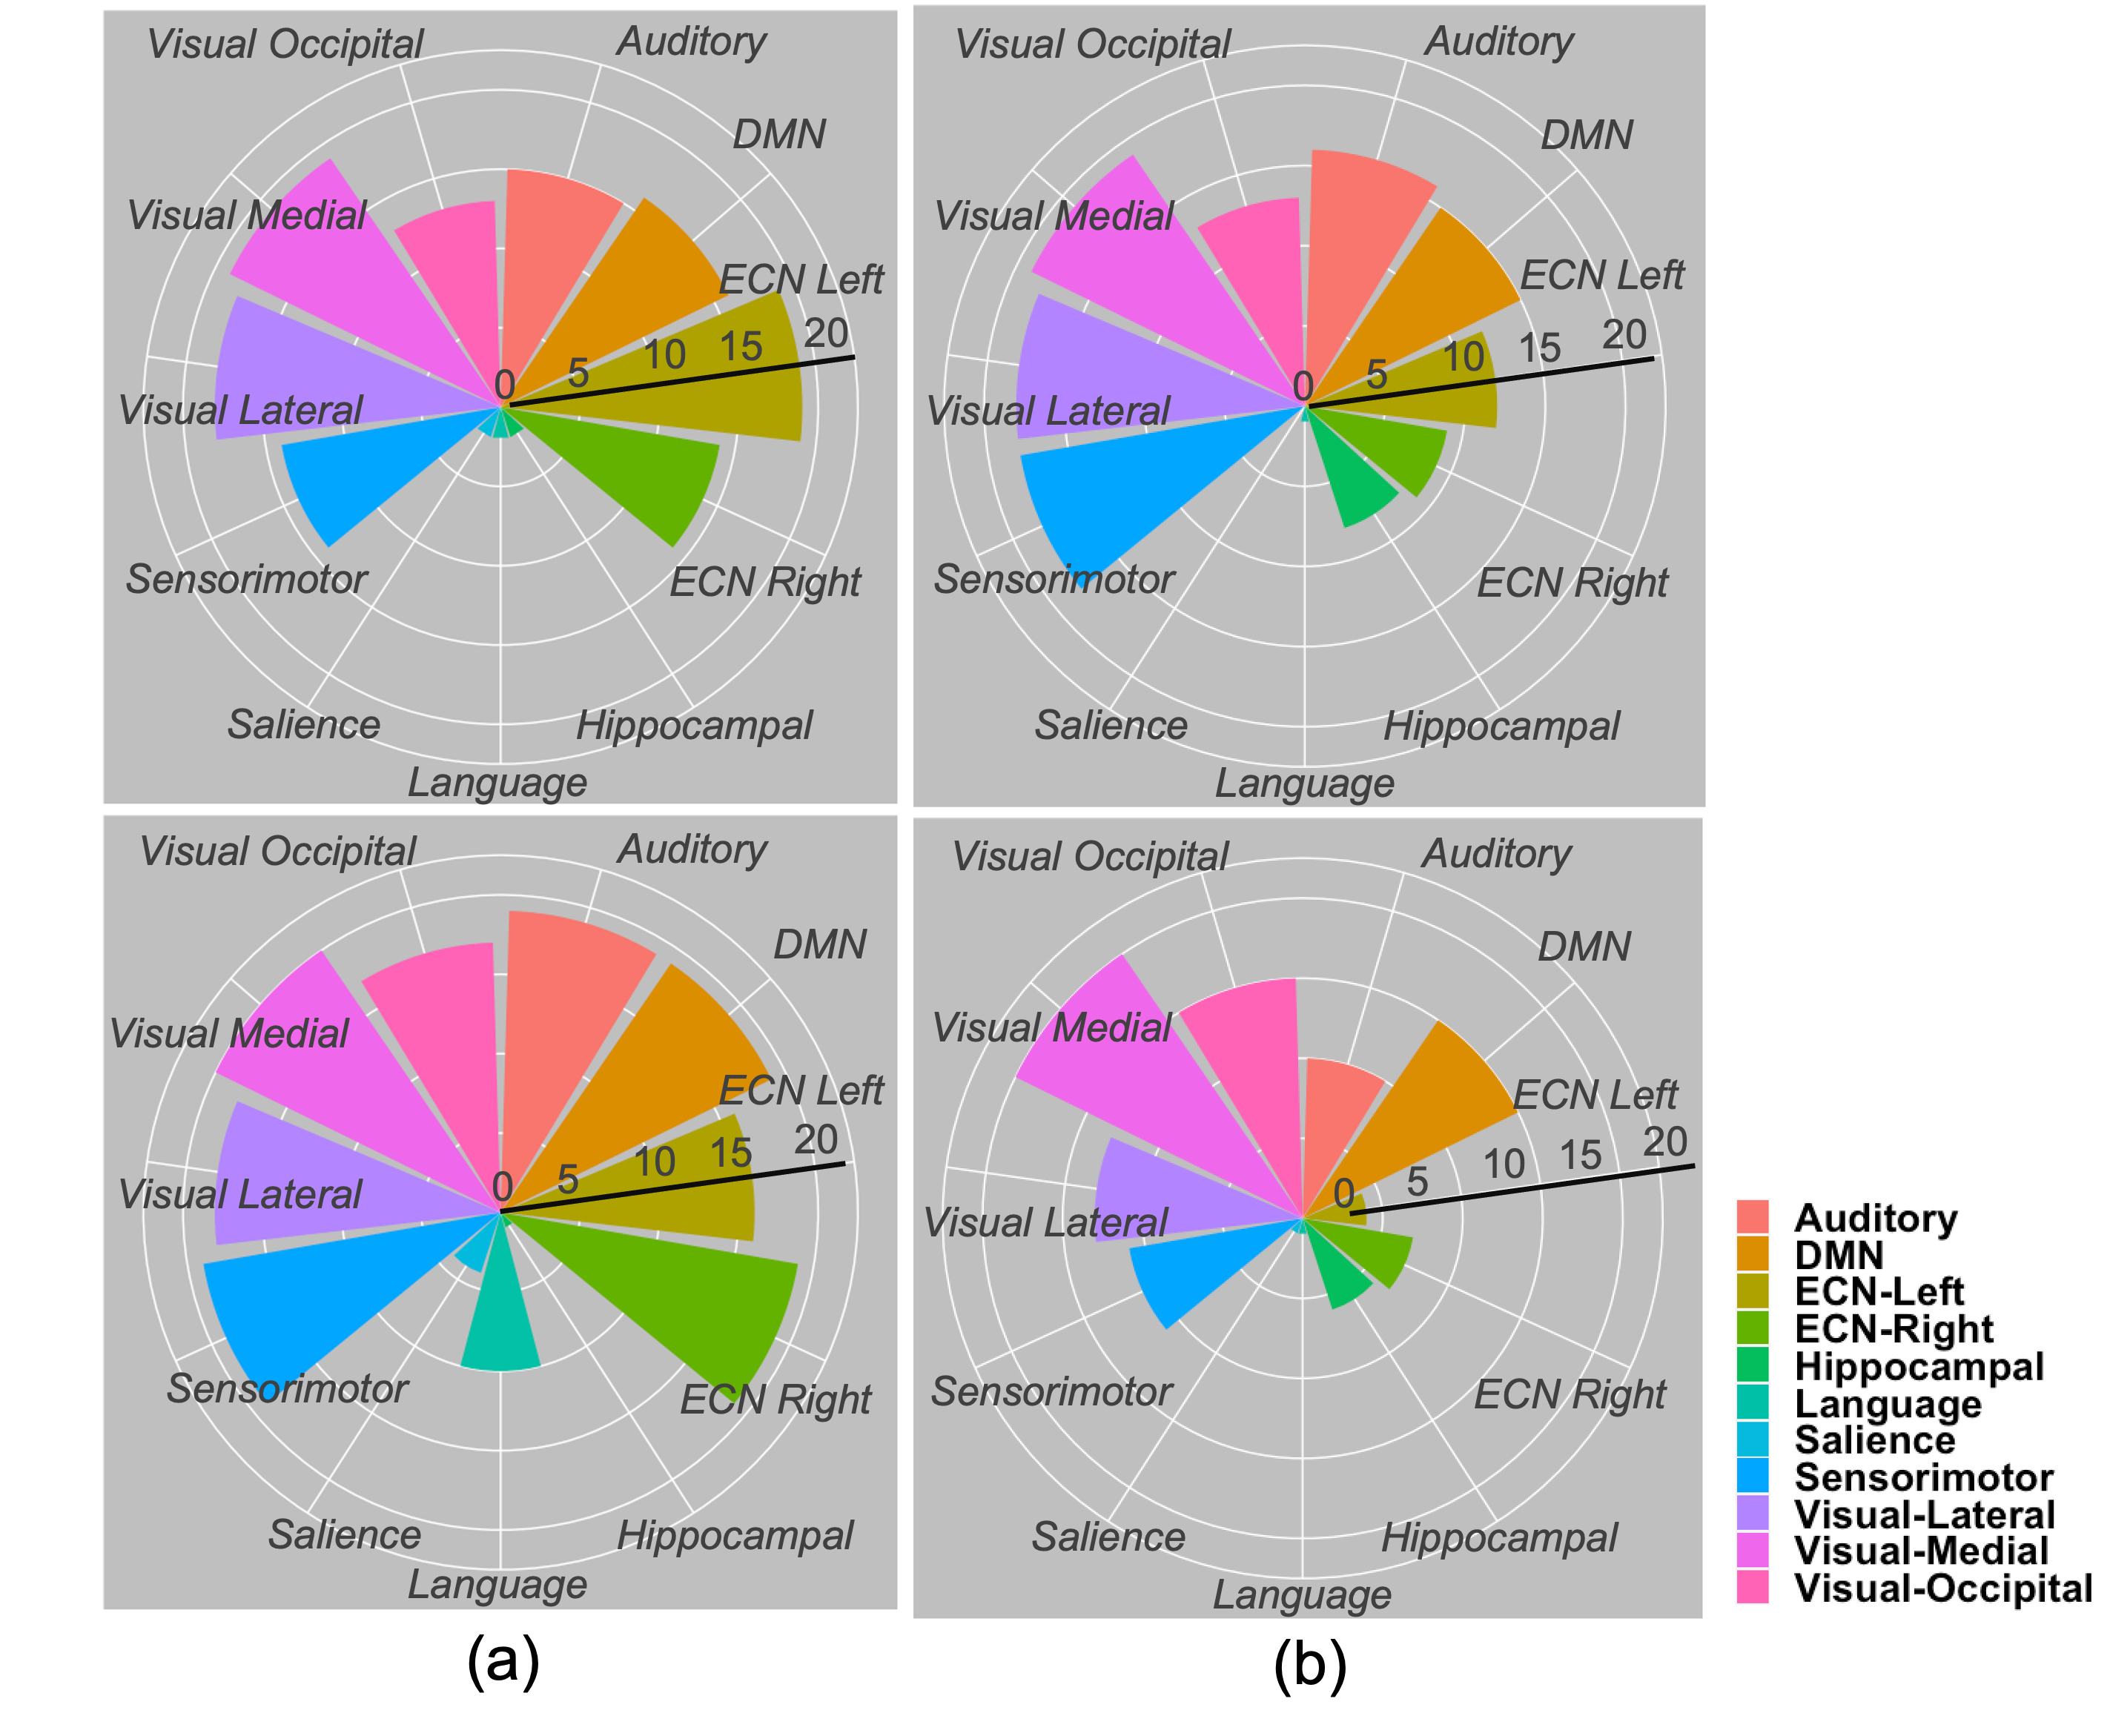
Figures 2 and 3 show the normalized thresholded z values for the default mode network (DMN) and the executive control network right (ECN Right) at 2 different tSNR which represents different field strengths. The top and bottom panel of these figures refer to a TR of 1000 and 2000 ms respectively. Figure 4 show the normalized time series fluctuation for different TRs at 2 different tSNR. Figure 5 provides a graphical representation of detected RSNs at different tSNR and varying TRs. This calculation was performed by thresholding the correlation coefficient such that values greater than 0.6 would suggest true detection.DISCUSSION
Figure 2a. shows the regions detected within DMN for a tSNR of 77 which is associated with the 3 T data is reduced at a shorter TR. The simulated data with the tSNR ≈17 as shown in Fig 2b. suffers from an overall decrease in regions detected as expected from reduced tSNR. However, there is an increase in positive detection at the shorter TR corresponding to this tSNR. Figure 3 show similar behaviour for ECN Right. Figure 4 provides a snapshot into time series fluctuation for different TRs suggesting an overall greater change between TRs when tSNR ≈ 77. This change is reduced when tSNR ≈ 17. According to Figure 5 most of the RSNs except executive control network left (ECN Left) experience reduced detection at shorter TR when tSNR ≈ 77. This increased detection of ECN Left could be a sensitivity improvement or it can be explained by the greater temporal autocorrelation at shorter TR which can inflate the sensitivity measurements. When the tSNR ≈ 17 the detection capability reduces for all the networks compared to when tSNR ≈ 77 expect for Hippocampal. Interestingly, Hippocampal is not a part of the network detected with 3 T scanner suggesting the introduction of false positive at lower field strengths. This figure shows true detection with the longer TR at higher tSNR can also be achieved with a shorter TR at reduced tSNR.CONCLUSIONS
The shortened T1 at lower field strength enables efficient sequence design by reducing TR. The results shown in the abstract suggest the possibility of extracting true detection for a low field scanner with shorter TRs which can help reduce the scan time.Acknowledgements
The authors would like to thank the research and financial supports received from Natural Sciences and Engineering Research Council (NSERC) of Canada and Ontario Research Fund (ORF).
References
1.Panther, A. et al., A dedicated Head-Only MRI Scanner for Point-of-Care Imaging. ISMRM, 2019.
2. Moreno-Ayure M. et al., Establishing an acquisition and processing protocol for resting state networks with a 1.5 T scanner: A case series in a middle-income country, Medicine, 2020.
3. Stainsby, J. et al., High-Performance Diffusion Imaging on a 0.5 T system. ISMRM, 2020.
4. Wang, Y. et al., Transition-Band SSFP and EPI Functional MRI on a High-Performance 0.55 T Scanner. ISMRM, 2020.
5. Campbell-Washburn, A.E. et al., Image contrast at 0.55T. ISMRM, 2019.
6. Nickerson, L.D. et al., Using dual regression to investigate network shape and amplitude in functional connectivity analyses. Frontiers in Neuroscience, 2017.
7. Schaefer, A. et al., Local-Global Parcellation of the Human Cerebral Cortex from Intrinsic Functional Connectivity MRI. Cerebral Cortex, 2018.
8. Bielczyk, N. Z. et al., Thresholding functional connectomes by means of mixture modeling. NeuroImage, 2018.
Figures