1895
Investigating the detection capability of RSNs with fMRI at a low field scanner equipped with a high-performance gradient1Medical Biophysics, Western University, London, ON, Canada, 2Radbound University, Nijmegen, Netherlands, 3Physics and Astronomy, Western University, London, ON, Canada, 4xMR Labs, London, ON, Canada, 5The xMR Labs, London, ON, Canada
Synopsis
Preliminary evaluation of the feasibility to perform resting state BOLD fMRI at a low field (0.5 T) MR scanners equipped with a high-performance gradient system by investing the detection capability of RSNs at lower field strengths. There was an overall deterioration in the number of detected regions within all RSNs as the tSNR decreased. However, the 0.5 Evry system that will be used for experimental studies offer a better SNR efficiency than the modelled cases considered here suggesting reasonable capability in extracting RSNs that can potentially provide clinical utility.
INTRODUCTION
Functional magnetic resonance imaging (fMRI) is not performed at lower field strengths due to low magnetic susceptibility contrast and inadequate gradient performance. Low field scanners, such as the 0.5 T, head-only, Evry system [1] offers a reduced cost and installation footprint, making it a possible solution to provide a point-of-care unit near surgical suites, providing improved intraoperative solutions to surgeons. As well as being of potential use in low to mid income economies of developing countries which suffer from limited access to all specialized high-cost technologies, including advanced fMRI [2]. Previous diffusion weighted studies performed on a similar scanner suggest the performance of the system to be very close to a traditional 1.5 T scanner [3]. These results suggest that such a system could be potentially used to perform fMRI experiments of clinical utility. To determine its feasibility, this study takes resting state data acquired using traditional fMRI pulse sequences at high field (3 T) and uses it in silico, to determine data that could potentially be recorded with the 0.5 T system. This data is then used to evaluate the detection capability of true resting state networks (RSNs) that are found with the 3 T scanner.METHOD
Resting state functional and structural data were collected with a 3 T Siemens scanner involving 20 healthy volunteers. To create the artificial datasets the timeseries signal corresponding to each voxel for individual subjects were extracted using Nilearn (Neuroimaging package, Python). The timeseries signal were filtered using a bandpass filter to isolate the neuronal signal and the noise components corresponding to the 3 T system. The decreased magnetic susceptibility associated with lower fields reduce the underlying blood oxygen level dependent (BOLD) contrast causing an intrinsic difference between a 0.5 and 3 T scanner. Previous literature suggests a linear relationship between R2* contrast and the field strength. This R2*difference between the 3 T and 0.5 T scanner was calculated using the following equation eR2*(0.5 T) (2TE 3 T -TE0.5 T) with R2*0.5T = 11.57 s-1,TE 3T = 0.032 s and TE 0.5T = 0.0864 s [4,5]. The potential signal expected from the 0.5 T scanner was achieved by multiplying the previous quantity with the filtered signal of each voxel from the 3 T scanner. To account for the reduced signal to noise ratio (SNR) additional Rician noise of varying scale parameters was multiplied with the noise from the 3 T scanner. The final amount of introduced noise is a summation of the additional noise with the original noise extracted from the 3 T scanner. Summation of the modified signal and noise provides the timeseries for each voxel. In this study, temporal signal to noise ratio (tSNR) will be used to characterize field strengths. The average original and modified tSNR was calculated for each case. The connectivity analysis was performed with GraphICA (Brainet, Brain Imaging Solutions Inc.) which used independent component analysis (ICA) based on dual regression [6] implemented in FSL. GraphICA uses a gradient-weighted Markov Random Field (gwMRF) parcellation [7] technique along with a mixture model approach for thresholding [8].RESULTS
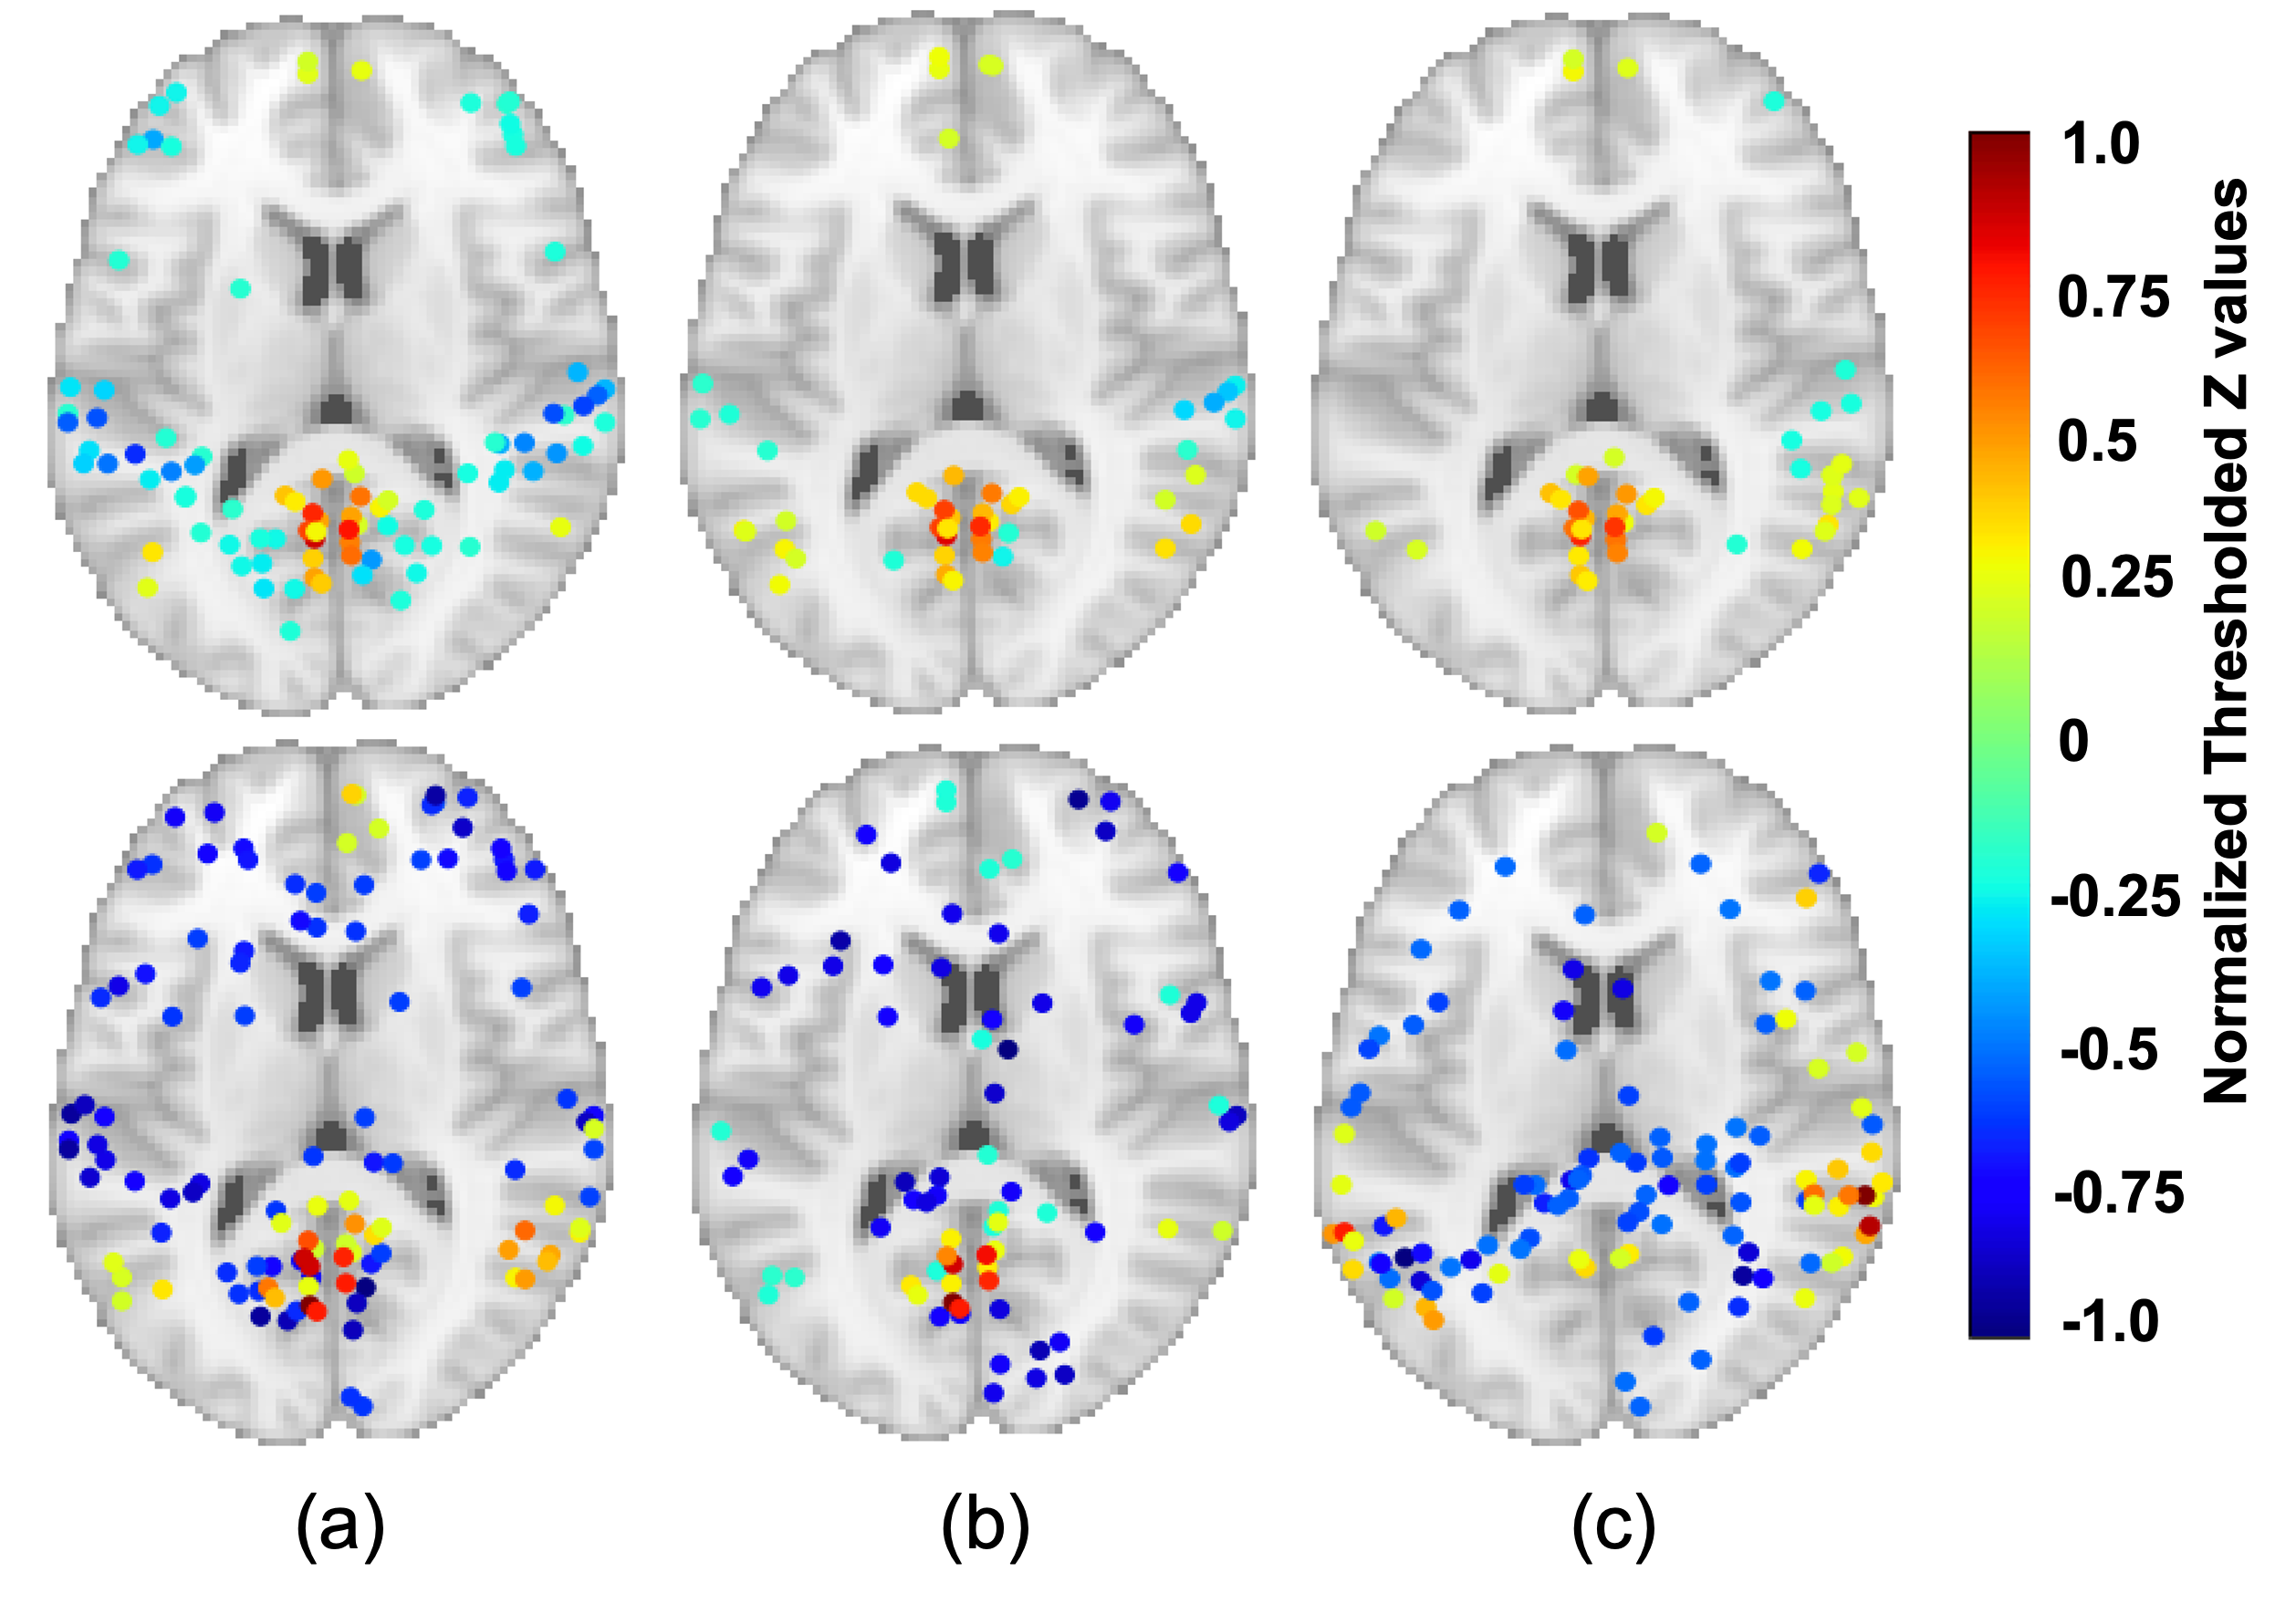
Figures 1 and 2 show the z values for regions detected within the Default Mode Network (DMN) and Salience network respectively over a range of tSNR moving from 3 T to lower field strengths. Ratio between average global properties and number of expected regions within a particular network are shown in Figure 3. These global properties include found regions which are detected regions that are expected in a particular network. The missing regions are those that are expected to be a part of a particular network but has not been detected. The extra regions are regions that are not part of that network but are still detected. Figure 4 shows snapshots of the simulated timeseries fluctuation over a range of tSNR. Figure 5 provides a graphical illustration of RSN’s detection by thresholding the correlation coefficient with values greater than 0.6 corresponding to true detection.DISCUSSION
The top panel in Figures 1 and 2 shows reduced detection of the expected regions as tSNR was decreased aiming to show the expected behaviour from lower field strength scanners within the DMN and Salience network respectively for the entire population. The bottom panel of these Figures refer to a single subject study, to show detected regions that do not intrinsically belong to a particular network. Figure 3 suggests an increase and a decrease in the number of found and missing regions respectively compared to the expected as a function tSNR. The slight increase seen in the number of found and extra regions for DMN, Executive Control Network (ECN) Left and Language as the tSNR reduces from ~17 to ~3 ( impossible scenario) suggest networks’ deterioration. Figure 5 suggests a drop in network detection particularly for Language and Salience which completely disappear at reduced tSNR.CONCLUSIONS
The Evry scanner offers an SNR efficiency similar to a 1.5 T system suggesting both image and temporal SNR to be ~ 40 which is high compared to cases considered here. This information along with the simplistic analysis performed here suggest a reasonable capability of extracting RSNs for the 0.5 T system that can potentially provide clinical utility.Acknowledgements
The authors would like to thank the research and financial supports received from Natural Sciences and Engineering Research Council (NSERC) of Canada and Ontario Research Fund (ORF).References
1.Panther, A. et al., A dedicated Head-Only MRI Scanner for Point-of-Care Imaging. ISMRM, 2019.
2. Moreno-Ayure M. et al., Establishing an acquisition and processing protocol for resting state networks with a 1.5 T scanner: A case series in a middle-income country. Medicine, 2020.
3. Stainsby, J. et al., High-Performance Diffusion Imaging on a 0.5 T system. ISMRM, 2020.
4. Wang, Y. et al., Transition-Band SSFP and EPI Functional MRI on a High-Performance 0.55 T Scanner. ISMRM, 2020.
5. Campbell-Washburn, A.E. et al., Image contrast at 0.55T. ISMRM, 2019.
6. Nickerson, L.D. et al., Using dual regression to investigate network shape and amplitude in functional connectivity analyses. Frontiers in Neuroscience, 2017.
7. Schaefer, A. et al., Local-Global Parcellation of the Human Cerebral Cortex from Intrinsic Functional Connectivity MRI. Cerebral Cortex, 2018.
8. Bielczyk, N. Z. et al., Thresholding functional connectomes by means of mixture modeling. NeuroImage, 2018.
Figures