1893
A comparison of human brain GABA levels measured at 3T and 7T
Tiffany Bell1,2,3, Dana Goerzen4, Masoumeh Dehghani4, Jamie Near4,5,6, and Ashley D Harris1,2,3
1Department of Radiology, University of Calgary, Calgary, AB, Canada, 2Hotchkiss Brain Institute, University of Calgary, Calgary, AB, Canada, 3Alberta Children's Hospital Research Institute, University of Calgary, Calgary, AB, Canada, 4Centre d’Imagerie Cerebrale, Douglas Mental Health Institute, Montreal, QC, Canada, 5Department of Medical Biophysics, University of Toronto, Toronto, ON, Canada, 6Sunnybrook Research Institute, University of Toronto, Toronto, ON, Canada
1Department of Radiology, University of Calgary, Calgary, AB, Canada, 2Hotchkiss Brain Institute, University of Calgary, Calgary, AB, Canada, 3Alberta Children's Hospital Research Institute, University of Calgary, Calgary, AB, Canada, 4Centre d’Imagerie Cerebrale, Douglas Mental Health Institute, Montreal, QC, Canada, 5Department of Medical Biophysics, University of Toronto, Toronto, ON, Canada, 6Sunnybrook Research Institute, University of Toronto, Toronto, ON, Canada
Synopsis
Measuring GABA in the human brain in vivo using magnetic resonance spectroscopy (MRS) is not trivial due to its low abundance in the brain and the overlap of signal from higher concentration metabolites. At 3T, an editing sequence is typically used to isolate the GABA signal. Data acquired at 7T has higher SNR and better spectral resolution, therefore editing is often not used to measure GABA at this field strength. Here we compare GABA levels acquired at 7T using STEAM to GABA levels acquired at 3T using GABA-edited MEGA-PRESS and find little agreement between the two measures.
Introduction
γ-Aminobutyric acid (GABA), the primary inhibitory neurotransmitter in the human brain, can be measured non-invasively in vivo using proton magnetic resonance spectroscopy (MRS). However, due to its low abundance in the brain and the overlap of signal from higher concentration metabolites, measuring GABA is not trivial.MEscher-GArwood editing (MEGA-PRESS)1 is the most commonly implemented method to measure GABA at 3T, in which an editing pulse is applied alternating between 1.9 and 7.5 ppm. The 1.9 ppm pulse selectively refocuses the 3.0 ppm GABA peak in half of the spectra, whilst the GABA signal freely evolves in the others. Subtraction of one condition from the other removes overlapping signals (which evolved freely in both conditions) to reveal GABA.2
Due to the need for long acquisitions and the desire to measure multiple metabolites together, measuring GABA without editing is desirable. One solution is to use a higher field strength (i.e., 7T), which increases SNR and spectral resolution. Previous studies have shown feasibility of measuring GABA at 7T without editing.3 However only one study has directly compared GABA levels measured using editing and non-editing at 7T, and showed a strong agreement between the two measures.4 Here we expand on this finding by comparing GABA levels acquired at 7T using STEAM and at 3T using MEGA-PRESS editing.
Methods
Twelve healthy participants (18-40y) underwent imaging sessions at 3T (Siemens Prisma) and 7T (Siemens Terra). The sessions took place within 3 days at approximately the same time of day and the session order was counterbalanced. Each session began with a T1-weighted image for voxel placement and segmentation. A 2.5x2.5x2.5cm3 voxel was placed in the parietal cortex centred on the midline using anatomical landmarks (Figure 1).At 7T, data were collected using STEAM (TE/TR/TM=8/6000/40ms, 64 averages). At 3T, data were acquired using MEGA-PRESS (TE/TR=68/2000ms, 14ms editing pulses at 1.9/7.5ppm, 256 averages acquired over two runs).
7T data were preprocessed using FID-A5 and analysed using LCModel6 with customized basis sets developed in FID-A. 3T data were analysed using two methods: (1) data were preprocessed using FID-A to generate a difference spectra, which was quantified using LCModel and custom basis sets (referred to as 3T-GABA-LCM) and (2) data were preprocessed and quantified using the default steps in Gannet 3.27 (referred to as 3T-GABA-GN). All data were tissue corrected5 with appropriate correction factors to account for the differences in echo time between the two sequences. The agreement between 7T GABA and 3T GABA was assessed using Pearson’s correlation analyses and Bland-Altman plots.
Results
7T GABA did not correlate with either 3T GABA measure (Figure 3). Bland-Altman plots showed that 7T GABA was systematically higher than 3T-GABA-LCM (mean difference=0.7mol/kg) and systematically lower than 3T-GABA-GN (mean difference=-0.9mol/kg; Figure 2, Figure 4). Though the limits of agreement for 7T GABA vs 3T-GABA-GN were closer to 0, this comparison also had more variation in the difference values.Discussion
7T GABA measurements showed poor agreement with 3T GABA measurements. 7T GABA was systematically higher than 3T GABA quantified with LCModel and systematically lower than 3T GABA quantified with Gannet.Macromolecules are thought to make up 50% of the 3T GABA signal.8 Interestingly, the 7T GABA values are roughly 60% of the 3T-GABA-GN values. This suggests that 7T GABA data may have little macromolecular contamination. This is perhaps surprising as macromolecule contamination is likely to be higher at shorter echo times due to their short T2 relaxation time.9 Hong et al. postulated that fitting the entire spectrum with LCModel will produce GABA levels without contribution from macromolecules due to inclusion of the 2.28 ppm resonance, which is uncontaminated with macromolecule signal.4 A separate, metabolite-nulled scan would be beneficial to determine the macromolecular contribution to the 7T GABA signal.
The 3T-GABA-LCM values were much lower than 7T GABA and 3T-GABA-GN. This may be due to the preprocessing or quantification methods, or a combination of the two. Though Gannet and FID-A’s preprocessing are very similar, Gannet by default applies a 3Hz line-broadening value to improve SNR for the fitting. This cannot be done in LCModel as line-broadening will affect the linear modelling statistical tests. The 3T-GABA-LCM data were quantified using the difference spectra, which only contains one of the three GABA peaks modelled in the 7T data, which may explain why the 3T-GABA-LCM values were lower than that of the 7T GABA values. Additionally, LCModel quantifies metabolites by fitting a predefined basis set. The complex multiplet structure of the 3.0 ppm GABA peak and the lack of other peaks to aid in model fitting may limit the ability of LCModel to accurately fit the difference spectrum. In contrast, Gannet estimates the area under the GABA signal by applying a gaussian curve using nonlinear least-squares, which does not rely on any predetermined models. Indeed, though previous comparison of software’s showed LCModel to produce more stable results, quantification using Gannet provided more accurate results when measuring from a GABA phantom with a known concentration.10
In conclusion, surprisingly little agreement was found between 7T and 3T GABA measurements. Discrepancies between LCModel and Gannet analyses suggest processing has a significant effect, though future work is needed to fully understand these differences.
Acknowledgements
This work was undertaken thanks in part to funding from the Natural Sciences and Engineering Research Council of Canada and supported by the Hotchkiss Brain Institute and the Alberta Children’s Hospital Research Institute, University of Calgary.References
- Mescher, M., Merkle, H., Kirsch, J., Garwood, M. & Gruetter, R. Simultaneous in vivo spectral editing and water suppression. NMR Biomed. 11, 266–272 (1998).
- Harris, A. D., Saleh, M. G. & Edden, R. A. E. Edited 1 H magnetic resonance spectroscopy in vivo: Methods and metabolites. Magn. Reson. Med. 77, 1377–1389 (2017).
- Wijtenburg, S. ., Rowland, L. M., Edden, R. A. . & Barker, P. B. Reproducibility of Brain Spectroscopy at 7T using Conventional Localization and Spectral Editing Techniques. J Magn Reson Imaging 38, 460–467 (2013).
- Hong, D., Rankouhi, S. R., Thielen, J. W., Van Asten, J. J. A. & Norris, D. G. A comparison of sLASER and MEGA-sLASER using simultaneous interleaved acquisition for measuring GABA in the human brain at 7T. PLoS One 14, 1–19 (2019).
- Simpson, R., Devenyi, G. A., Jezzard, P., Hennessy, T. J. & Near, J. Advanced processing and simulation of MRS data using the FID appliance (FID-A)—An open source, MATLAB-based toolkit. Magn. Reson. Med. 77, 23–33 (2017).
- Provencher, S. W. Automatic quantitation of localized in vivo 1H spectra with LCModel. NMR Biomed 14, 260–264 (2001).
- Edden, R. A. E., Puts, N. A. J., Harris, A. D., Barker, P. B. & Evans, C. J. Gannet: A Batch-Processing Tool for the Quantitative Analysis of Gamma-Aminobutyric Acid–Edited MR Spectroscopy Spectra. J Magn Reson Imaging 40, 1445–1452 (2014).
- Harris, A. D., Puts, N. A. J., Barker, P. B. & Edden, R. A. E. Spectral-editing measurements of GABA in the human brain with and without macromolecule suppression. Magn. Reson. Med. 74, 1523–1529 (2015).
- Cudalbu, C., Mlynárik, V. & Gruetter, R. Handling macromolecule signals in the quantification of the neurochemical profile. J. Alzheimers. Dis. 31 Suppl 3, S101-15 (2012).
- Brix, M. K. et al. Within- and between-session reproducibility of GABA measurements with MR spectroscopy. J. Magn. Reson. Imaging 46, 421–430 (2017).
Figures
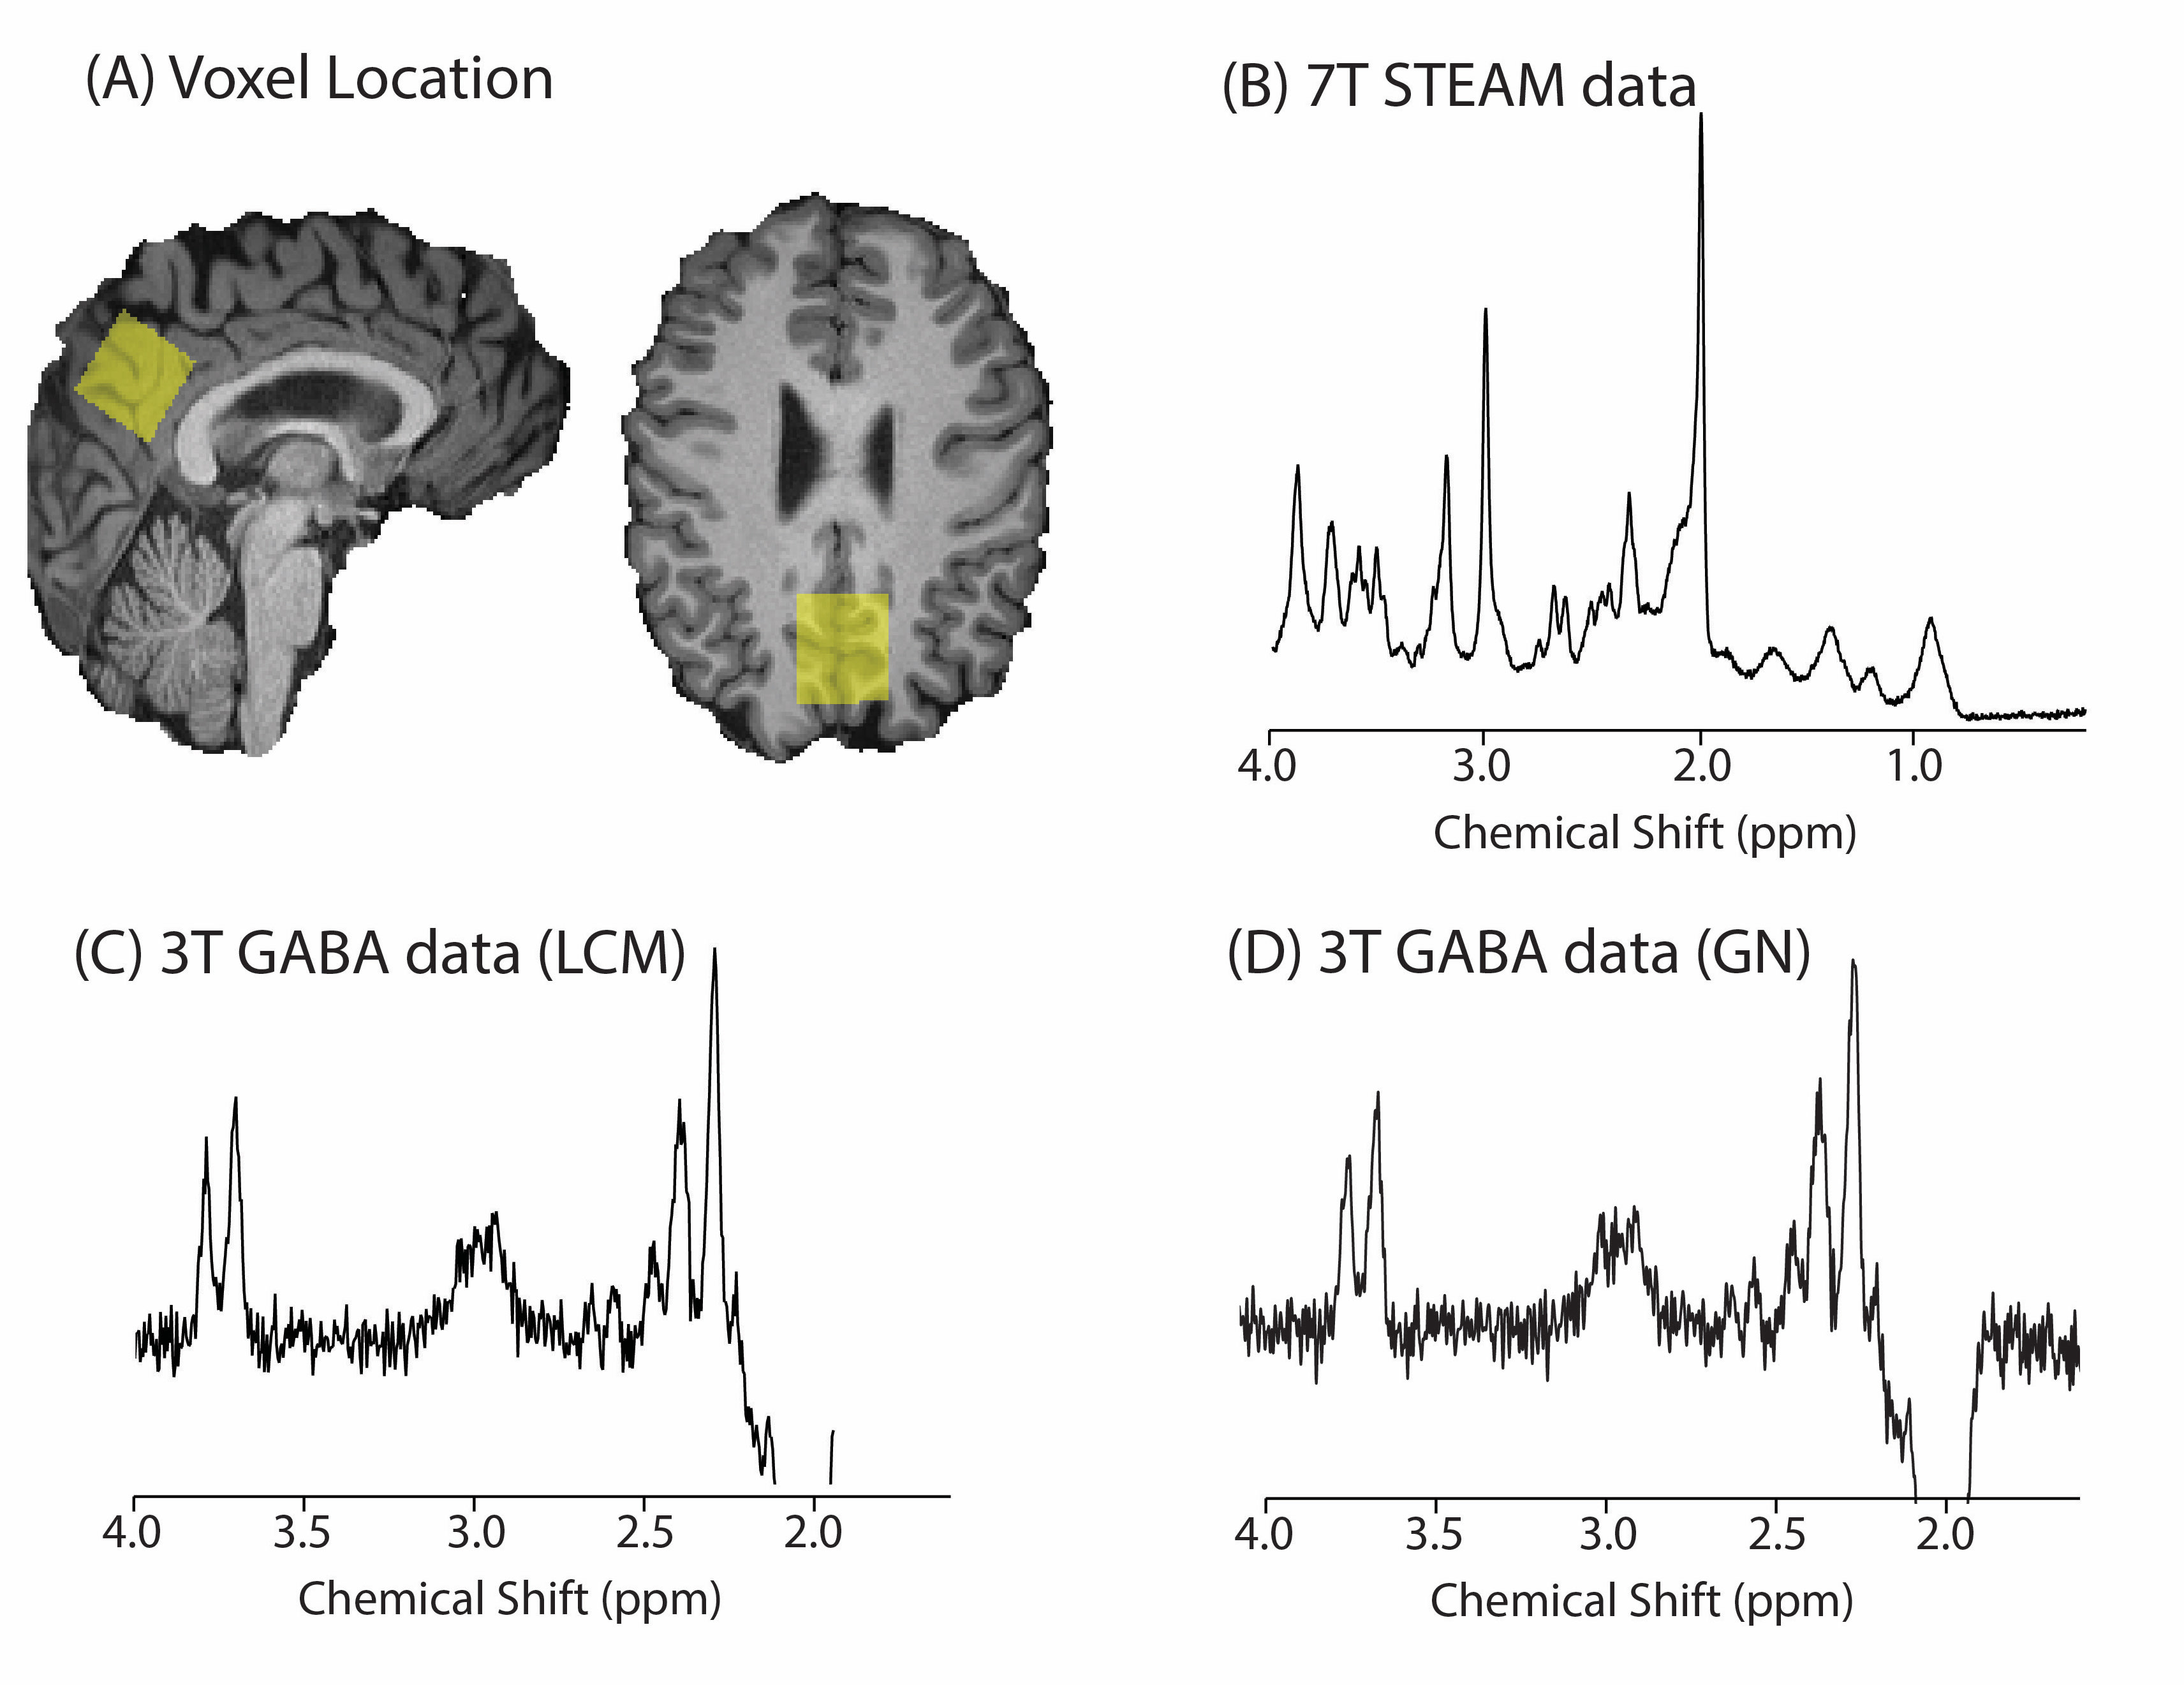
Figure 1(A) location of 2.5x2.5x2.5cm3 voxel in the parietal cortex. (B) Example of 7T STEAM data. (C) Example of 3T GABA data quantified using LCModel (LCM). (D) Example of 3T GABA data quantified using Gannet (GN) without line broadening applied.
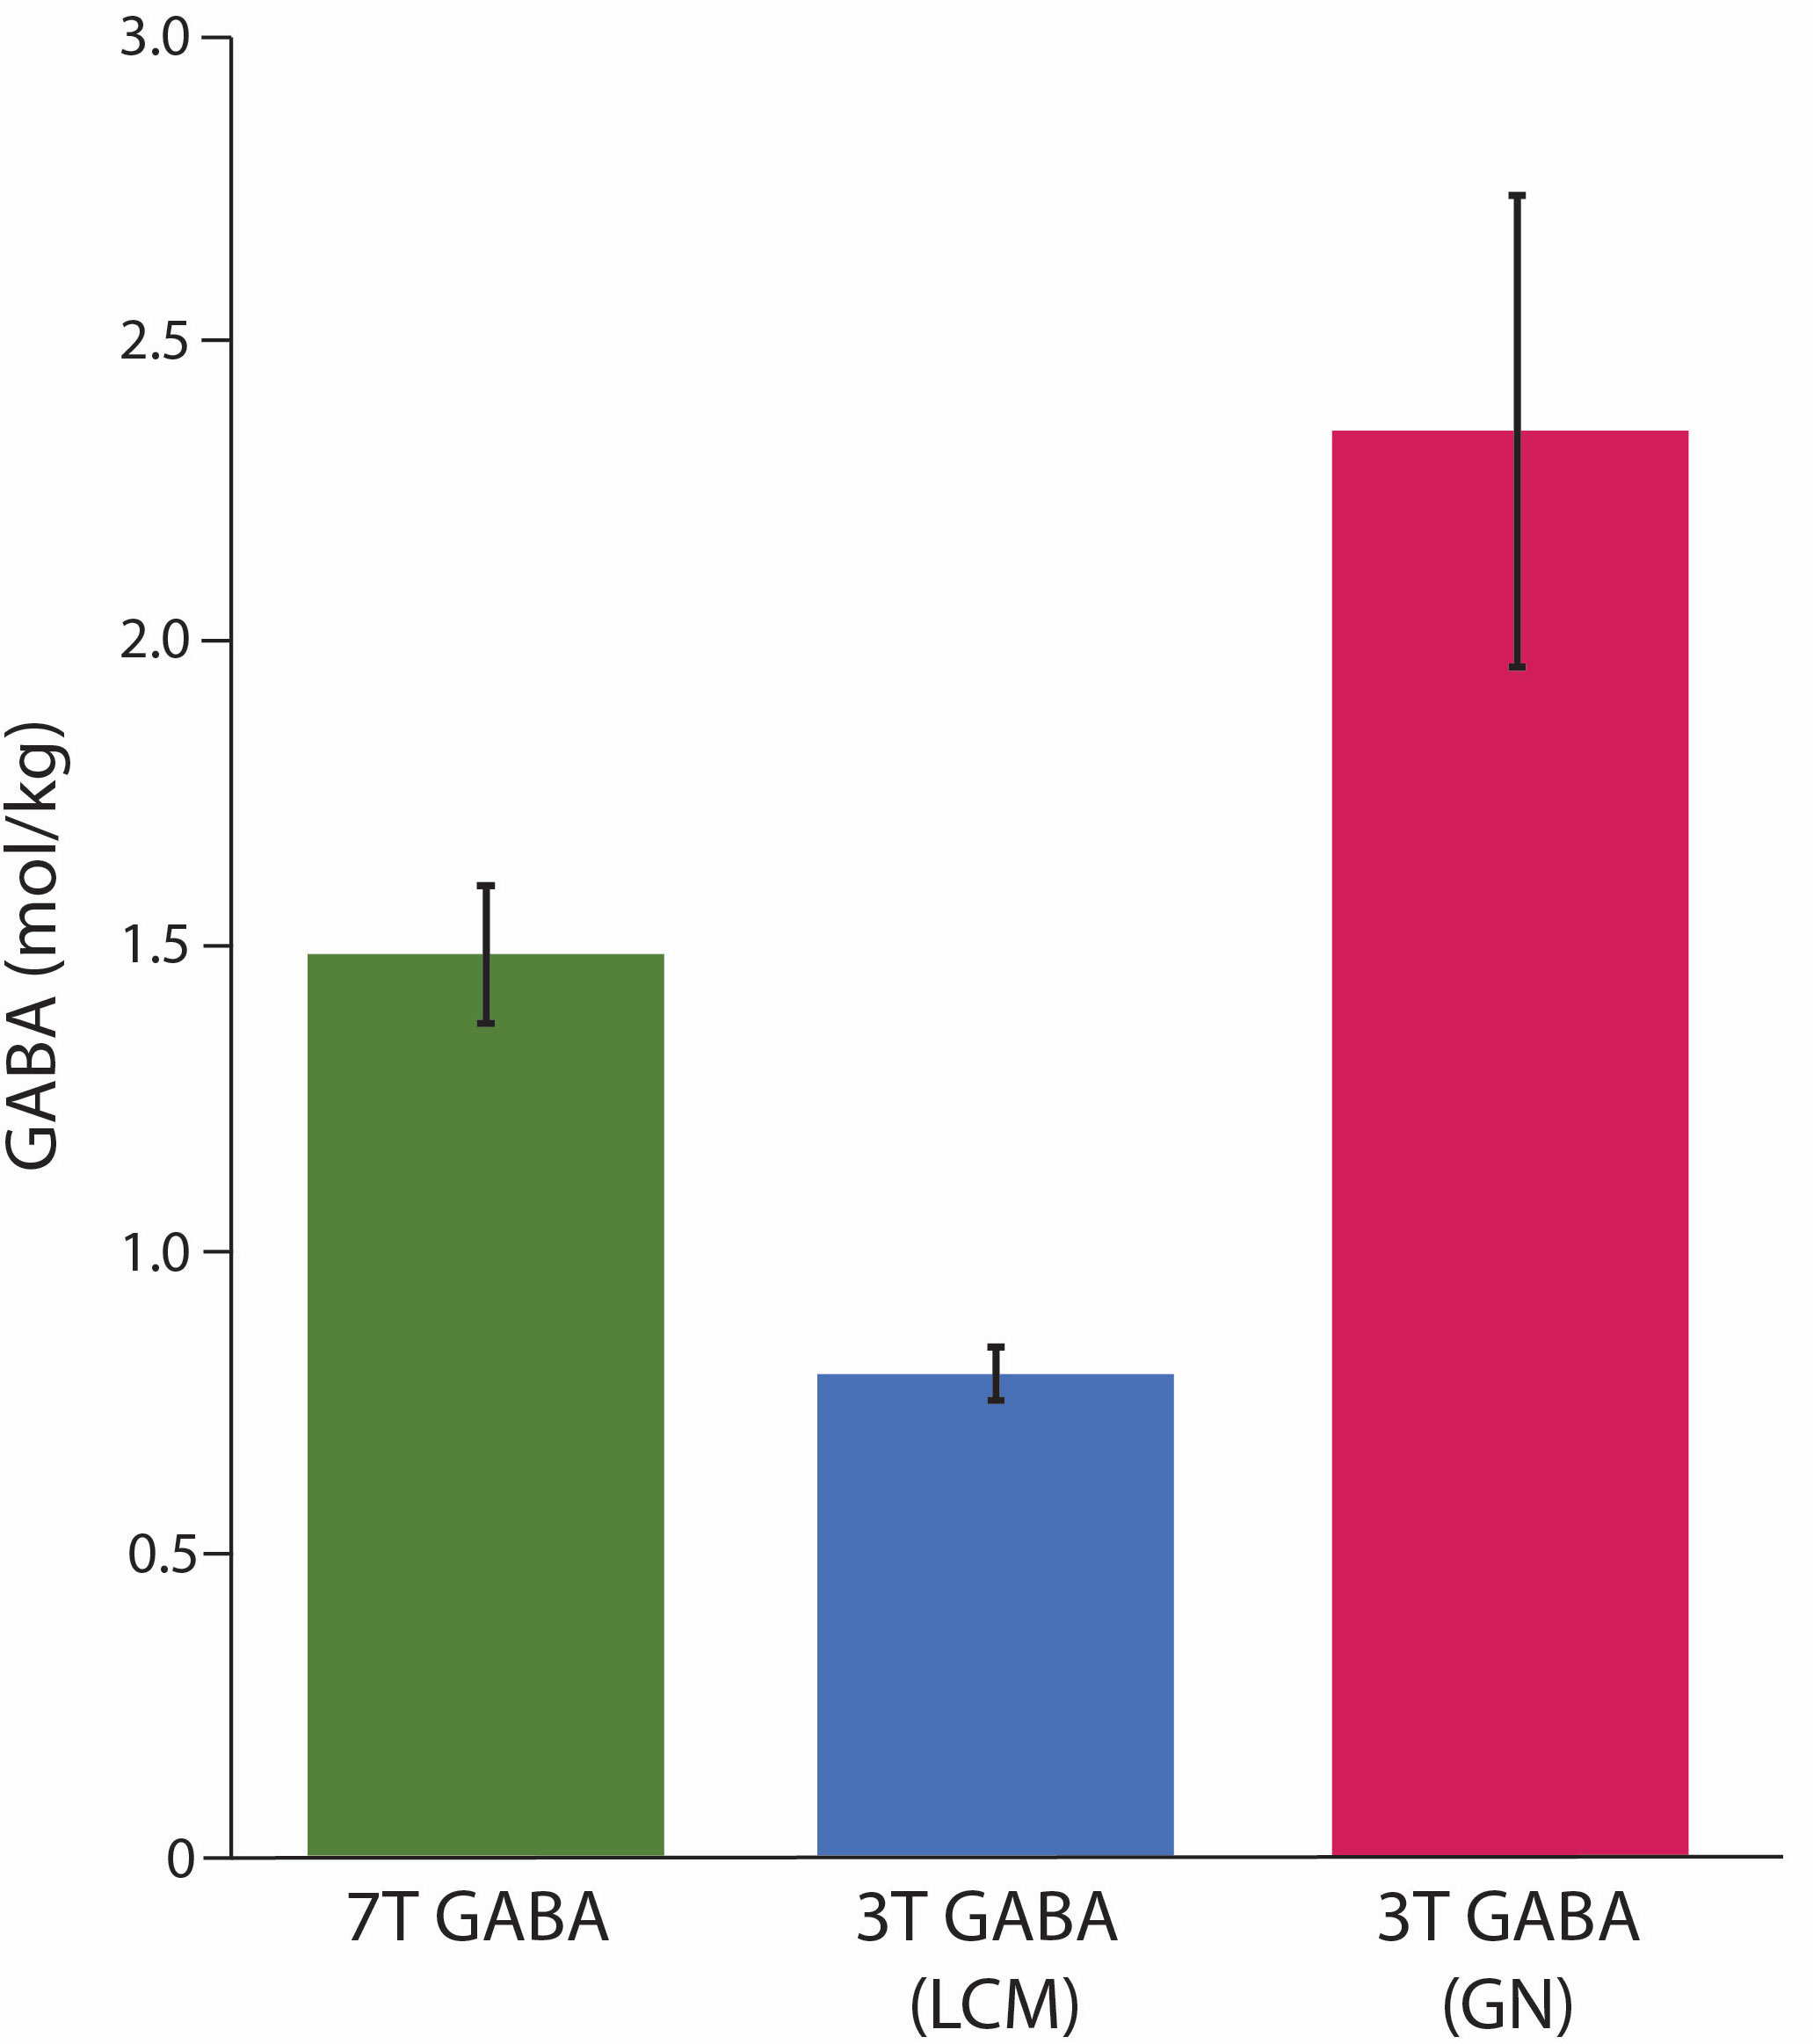
Figure 2: Mean GABA levels for each measure, error bars represent standard deviation (LCM: quantified using LCModel; GN: quantified using Gannet.
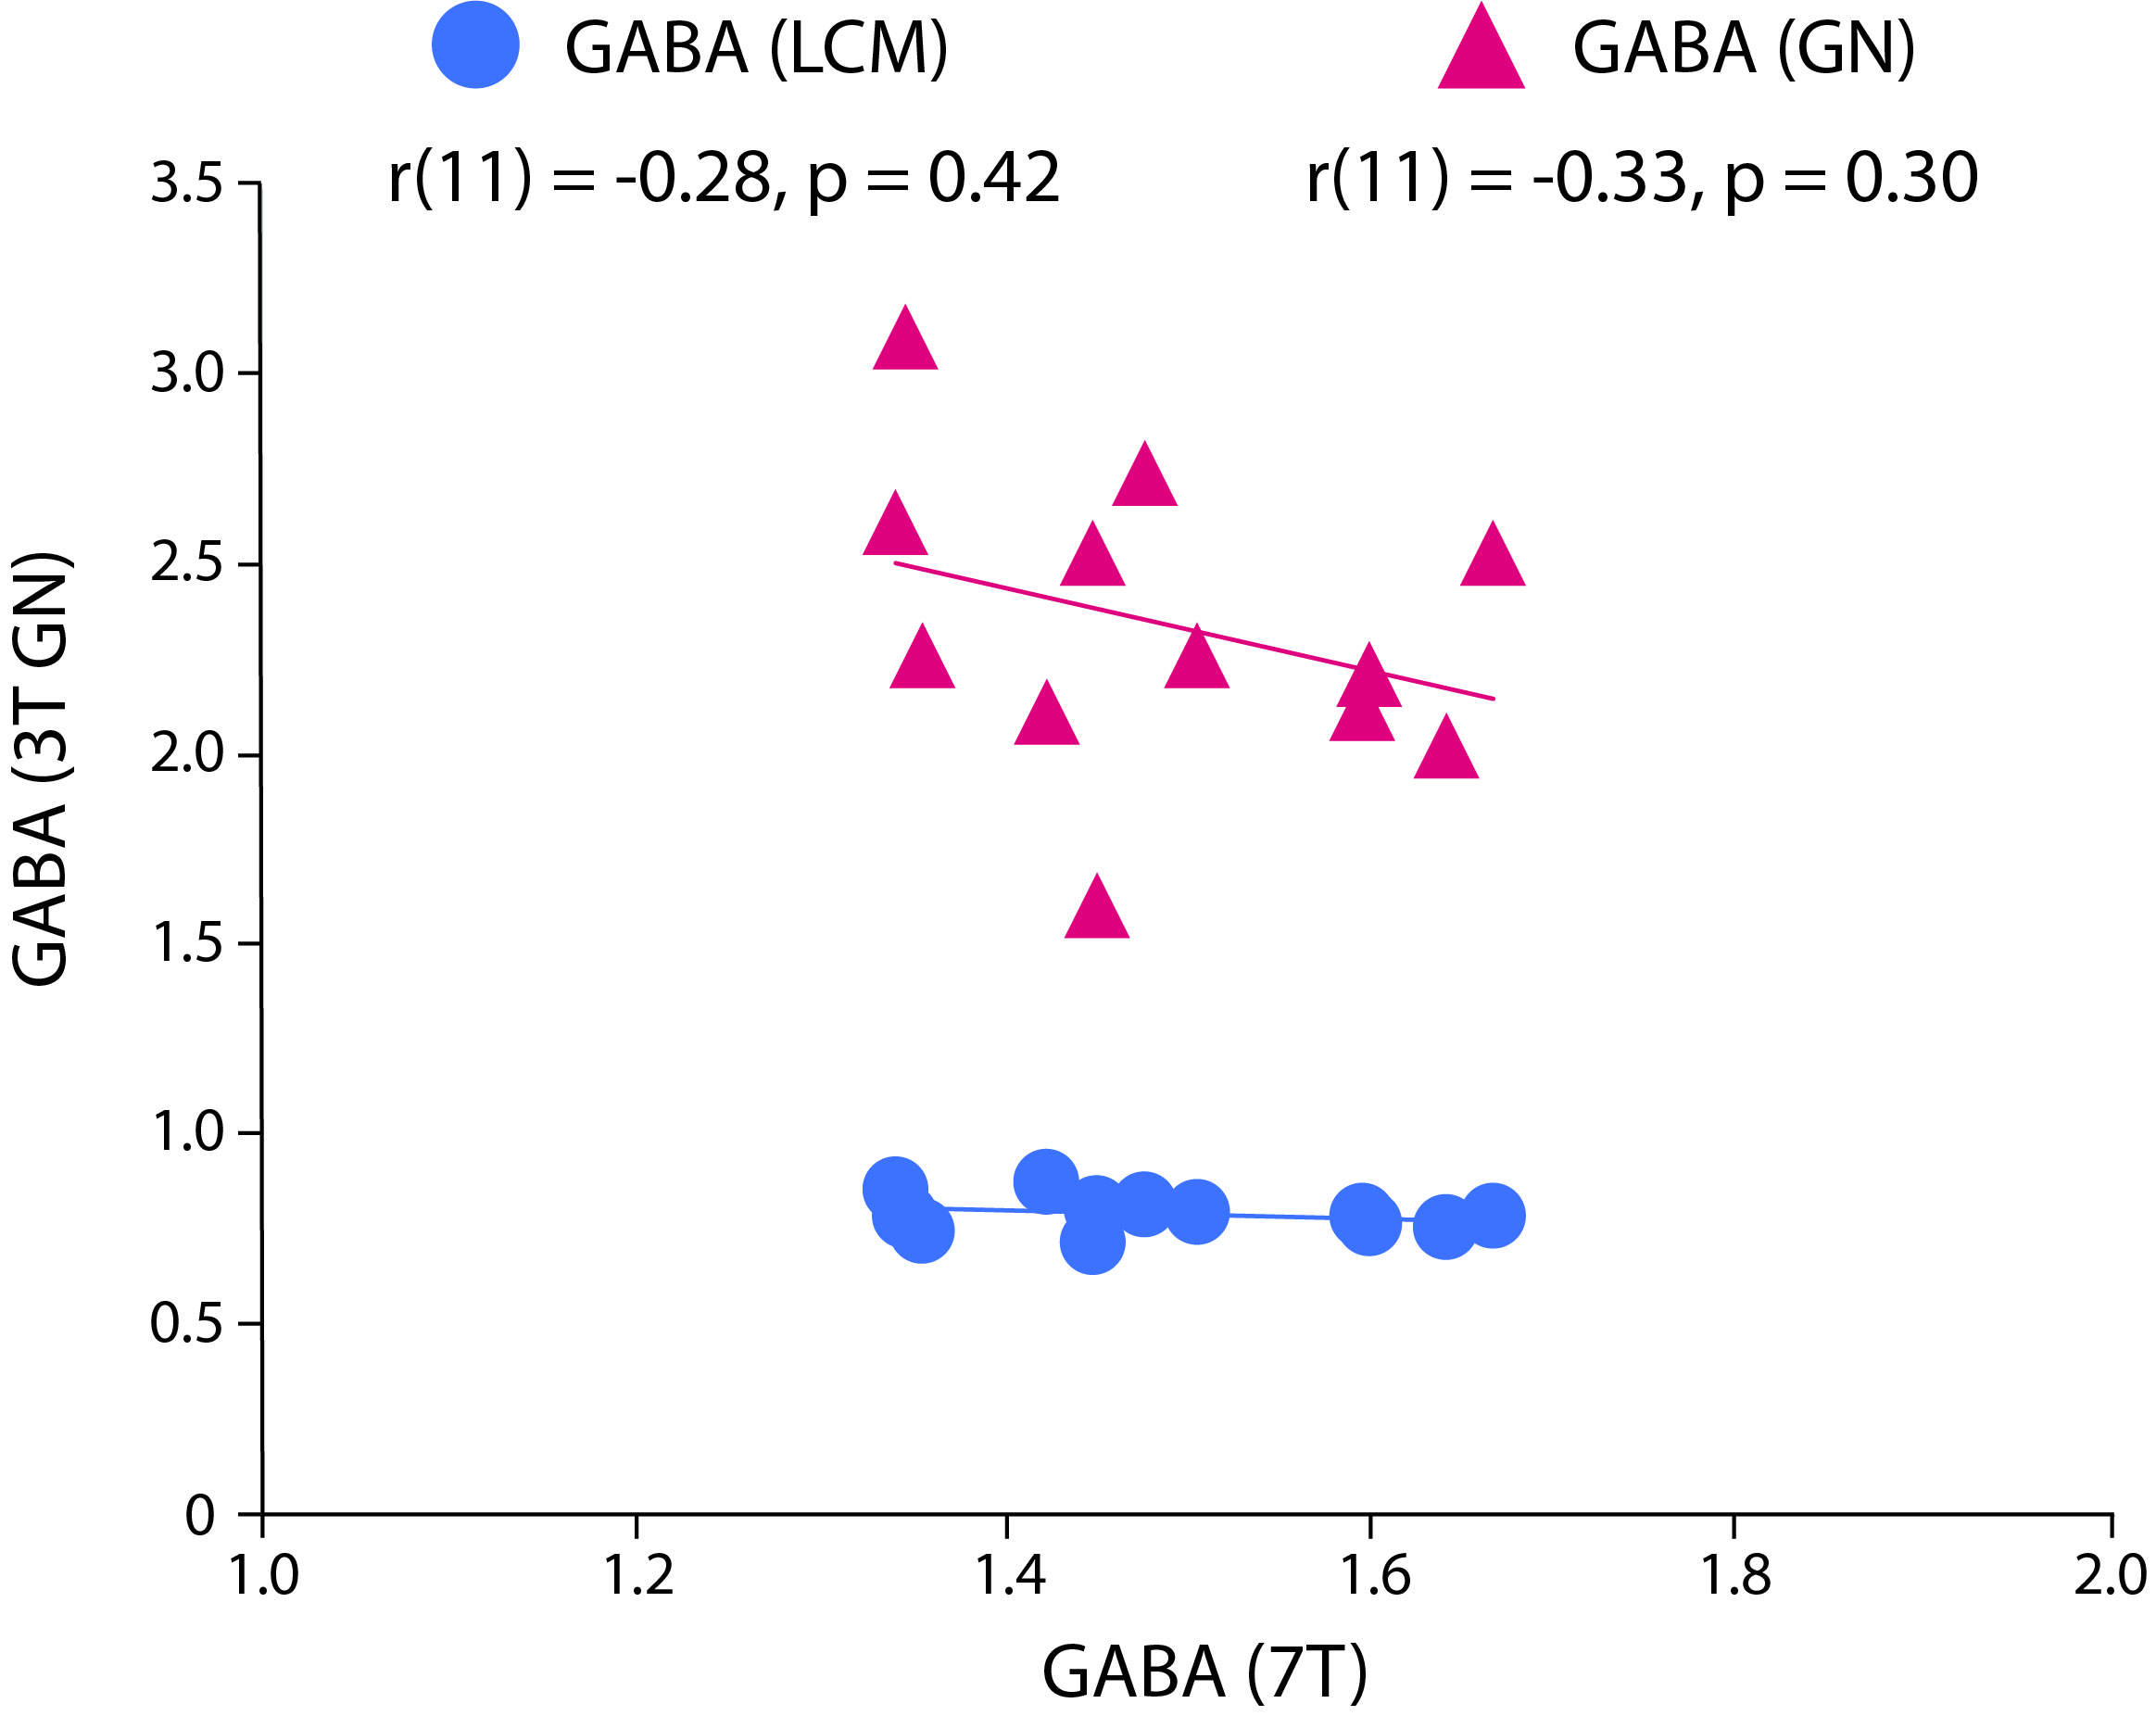
Figure 3: Correlation between GABA measured at 7T using STEAM and GABA measured at 3T using MEGA-PRESS and quantified using LCmodel (LCM) and Gannet (GN).
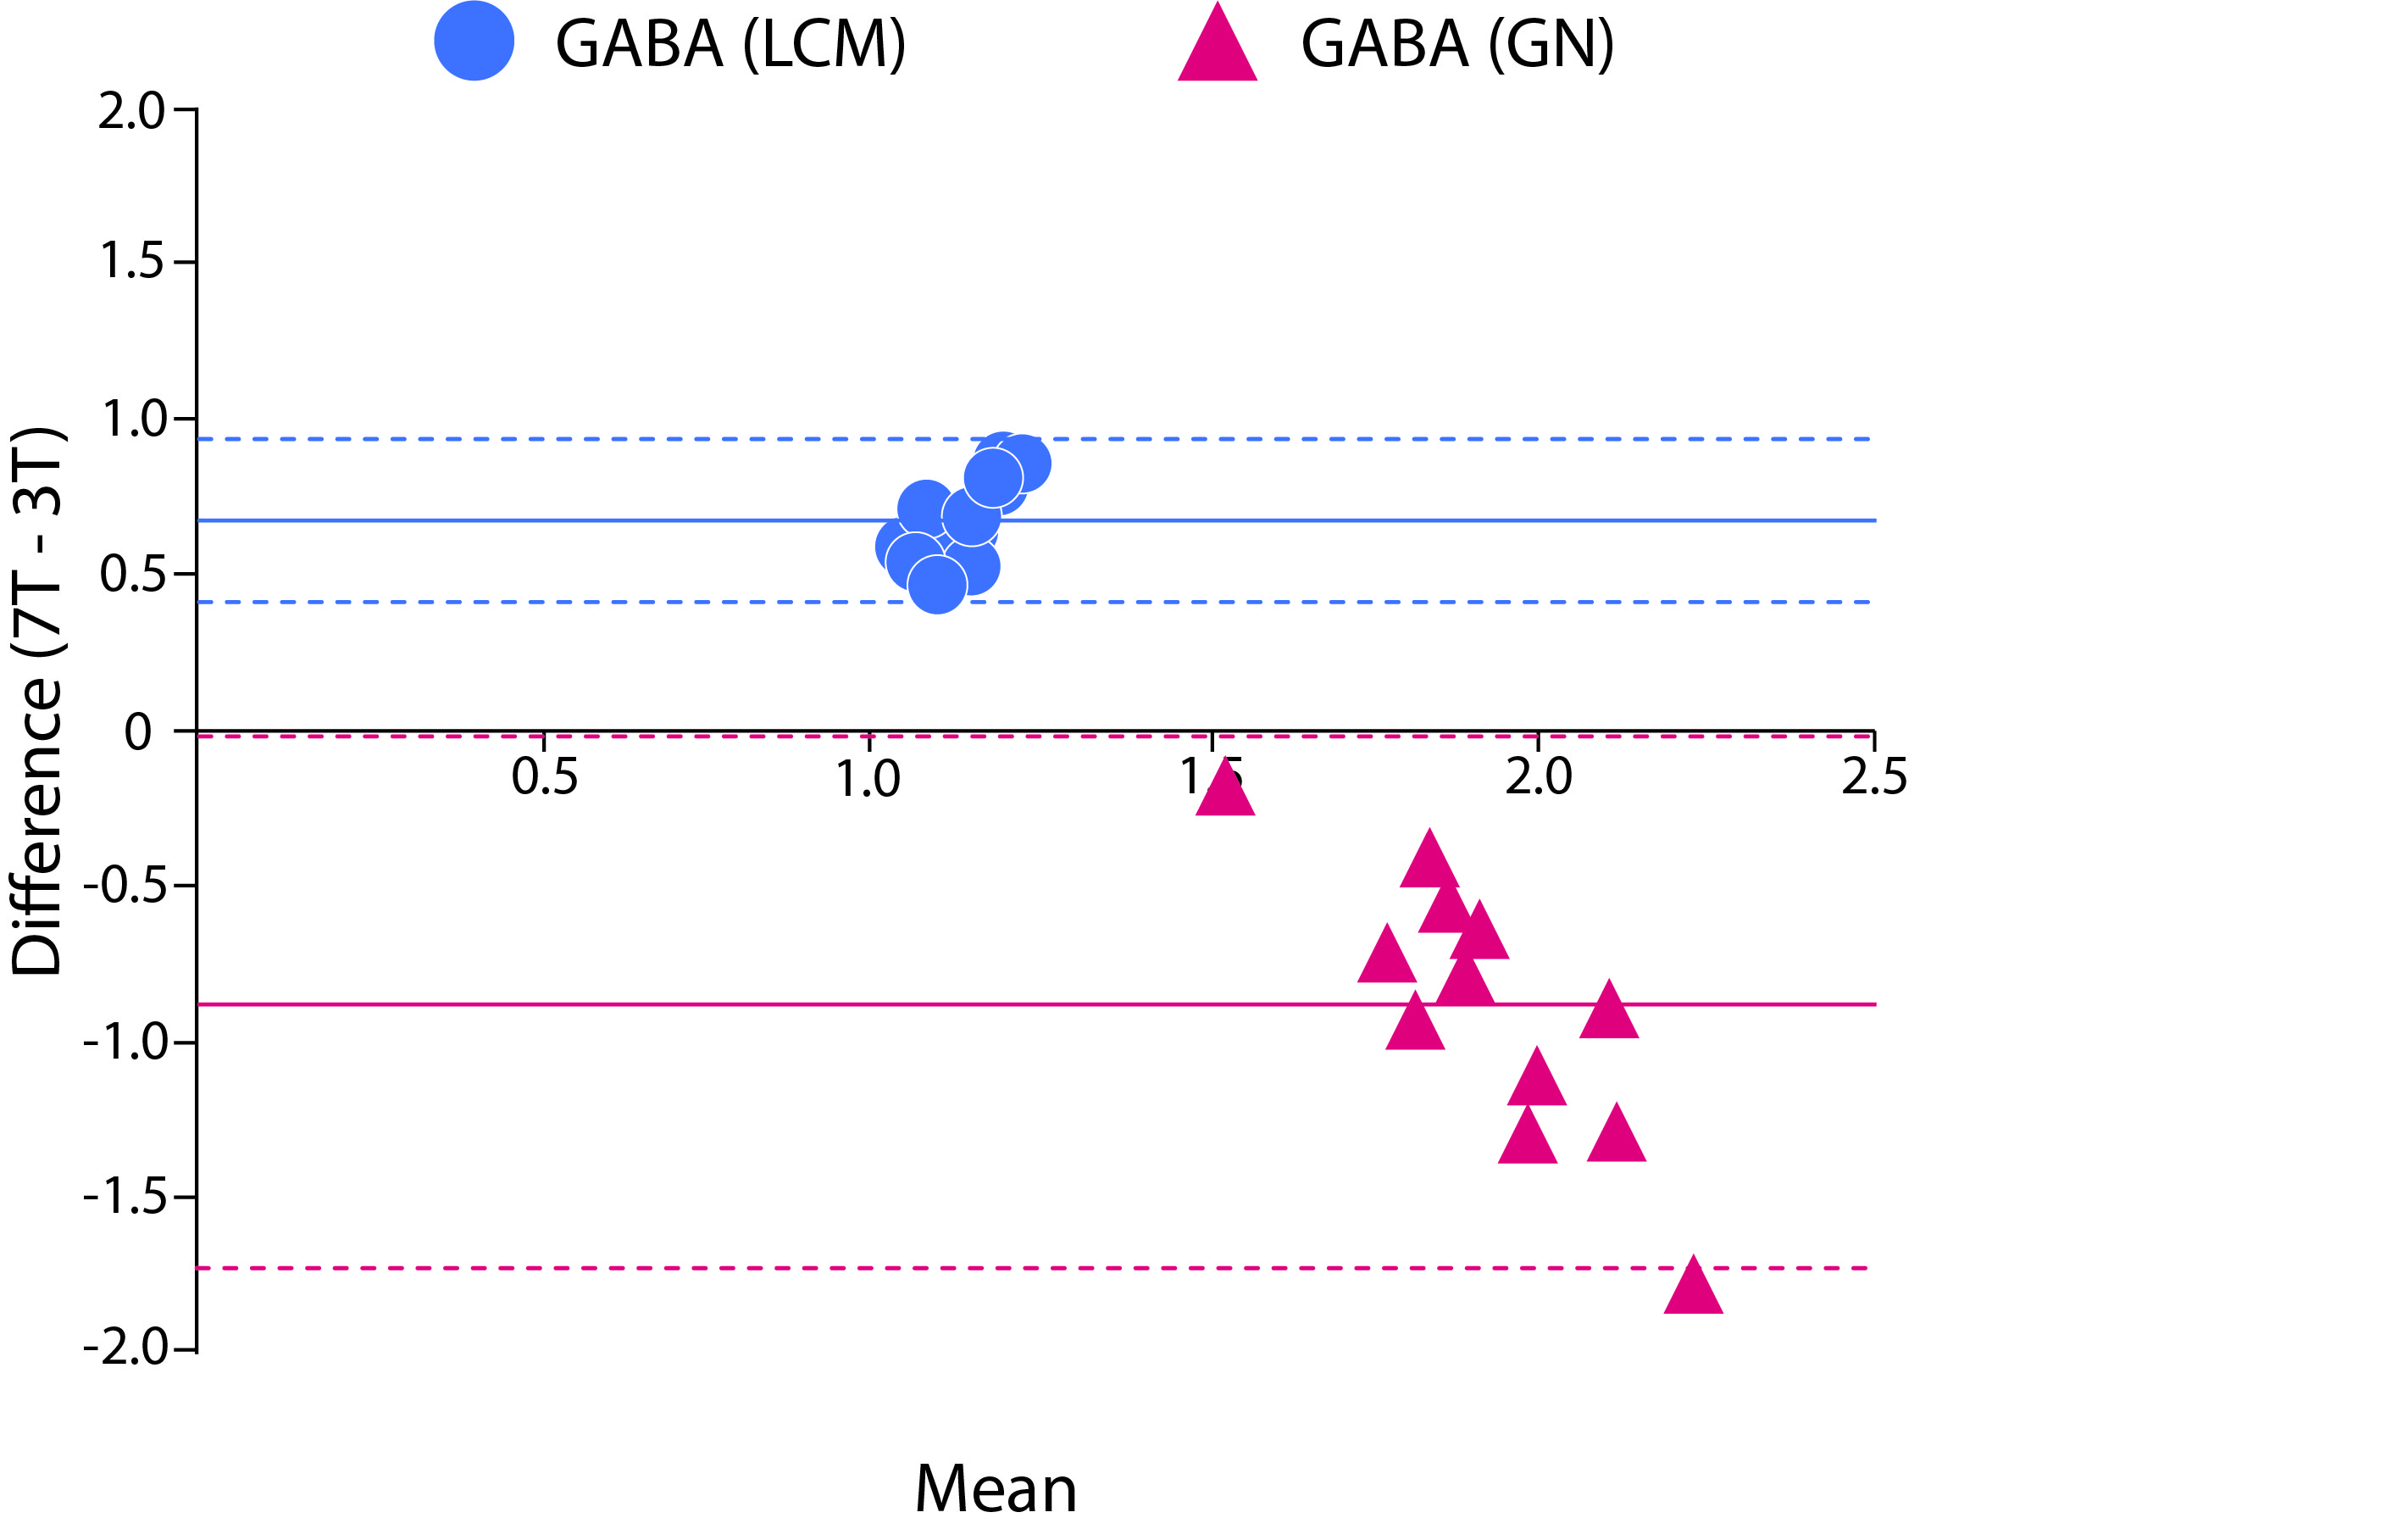
Figure 4: Bland-altman plots comparing GABA measured at 7T using STEAM and GABA measured at 3T using MEGA-PRESS and quantified using LCmodel (LCM) and Gannet (GN). The solid lines represent the overall mean difference, and the dashed lines represent the limits of agreement.
DOI: https://doi.org/10.58530/2022/1893