1891
semi-LASER MRS at 3T with TR=5s: All the Signal, Similar Scan Time, and Minimal T1 Weighting1Physics and Astronomy, University of British Columbia, Vancouver, BC, Canada, 2International Collaboration on Repair Discoveries (ICORD), University of British Columbia, Vancouver, BC, Canada, 3Radiology, University of British Columbia, Vancouver, BC, Canada, 4UBC MRI Research Centre, University of British Columbia, Vancouver, BC, Canada, 5Philips Canada, Mississauga, ON, Canada, 6Pathology & Laboratory Medicine, University of British Columbia, Vancouver, BC, Canada
Synopsis
The choice of repetition time (TR) in MR spectroscopy studies is widely debated. A shorter TR results in more clinically acceptable scan times, however due to T1 effects, the metabolite concentrations are reduced. We used semi-LASER MRS to compare the SNR and absolute metabolite concentrations for TR=2,5 and 8s. We demonstrate it is possible to achieve similar SNR and scan time using a TR of 5s with half the acquisitions compared to a TR of 2s, where the metabolite concentrations are 20% lower. Using a TR of 5s for any MRS study is feasible and recommended to minimize T1 effects.
Introduction
Many clinical magnetic resonance spectroscopy (MRS) studies use repetition times (TR) on the order of 2 seconds1–5 with the idea that a shorter TR yields a higher SNR per unit time. However, most metabolites in the brain have a T1 relaxation time between 750 and 1800ms6–8 at 3T, causing the resulting spectra to be heavily T1-weighted. Metabolite T1s also increase at higher fields, compounding this issue.9,10Previous research with stimulated echo acquisition mode (STEAM) at 3T has demonstrated that TRs < 5s led to an underestimation of absolute metabolite concentrations.7 However, no work has been done to describe the effects of TR on MRS data obtained using semi-localization by adiabatic selective refocusing (semi-LASER or sLASER). semi-LASER localization is rapidly becoming recognized as the standard localization technique for MRS11. The objective of this work was to examine the effect of TR on SNR and metabolite concentrations in the posterior cingulate cortex (PCC), which is a commonly investigated region in brain MRS studies5,7,12.
Methods
Data Collection: MRS data were collected on 5 healthy volunteers (2M/3F, mean age 25±2 years) at 3T (Philips Ingenia Elition X) using a 32-channel head coil. A 7.8cm3 voxel was placed in the PCC (Figure 1), localized using semi-LASER with TE=32ms, and 2048 samples at frequency = 2000Hz. Experiments were repeated using TR=2,5 and 8s, with the order of TRs varied for each volunteer. Given the additional RF pulses in semi-LASER, a full phase cycle requires 32 steps13. The number of signal averages (NSA) collected was 128 for TR=2s and 64 for both TR=5s and 8s, and 4 non-water-suppressed shots at each TR. Individual shots were exported and pre-processed to produce (1) a clinically feasible scan time of ~5 minutes for each TR in increments of full phase cycles (TR=2s NSA=128; TR=5s NSA=64; TR=8s NSA=32); and (2) 64 NSAs for each TR to enable comparisons with the same NSA.Data Analysis: Frequency alignment of each shot was done along with eddy current correction prior to averaging and fitting. Where less shots were needed in the average, the last half of the data was removed to simulate a shorter scan at that TR. The averaged spectra were fit using LCModel (version 6.3)14 using a basis set that was simulated in FID-A (example spectrum and fit in Figure 1).15 Each individual’s 3DT1 images were automatically segmented with FSL FAST16 and the voxel tissue fractions were combined with literature values for water relaxation times17 (Figure 2) to calculate the voxel’s absolute water concentration. N-Acetyl-aspartate (NAA), total Creatine (tCr), total Choline (Cho), myo-Inositol (mI), and Glutamate (Glu) were scaled by the water concentration to determine absolute metabolite concentrations, without applying any relaxation corrections on the metabolite signals. LCModel-determined SNR and metabolite concentrations were compared for different TRs.
Results
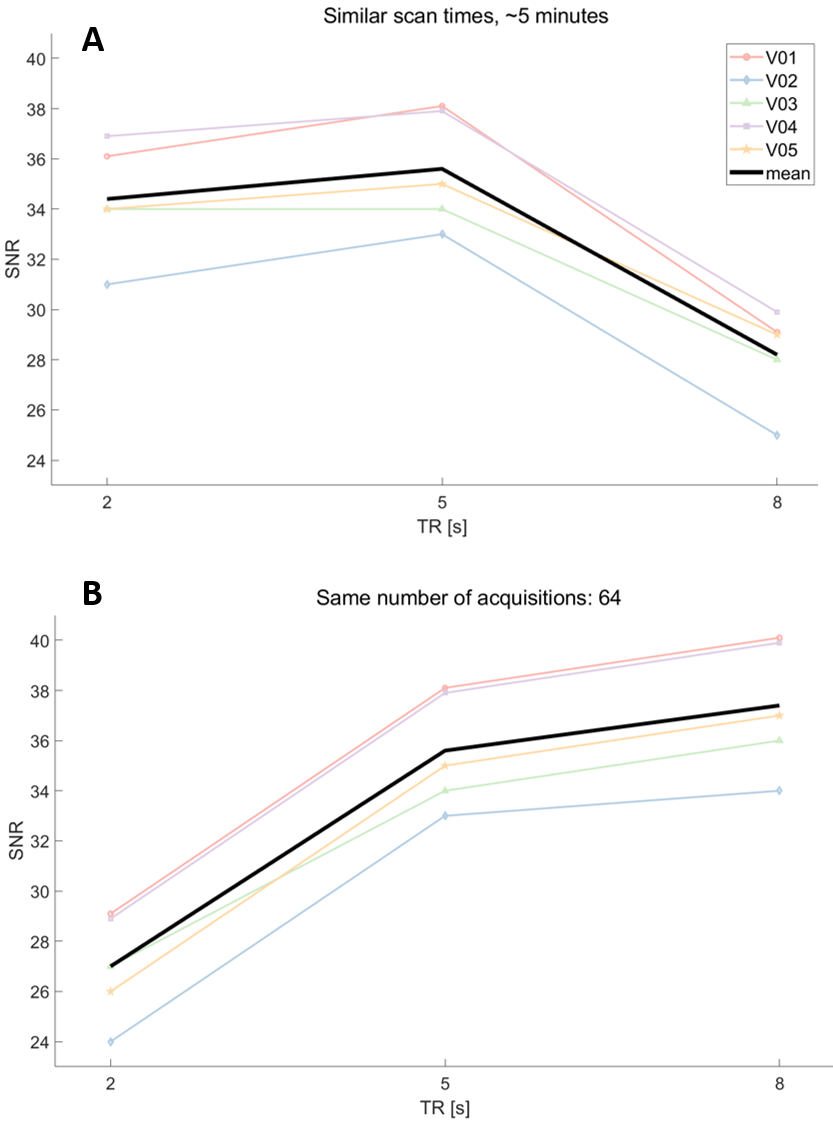
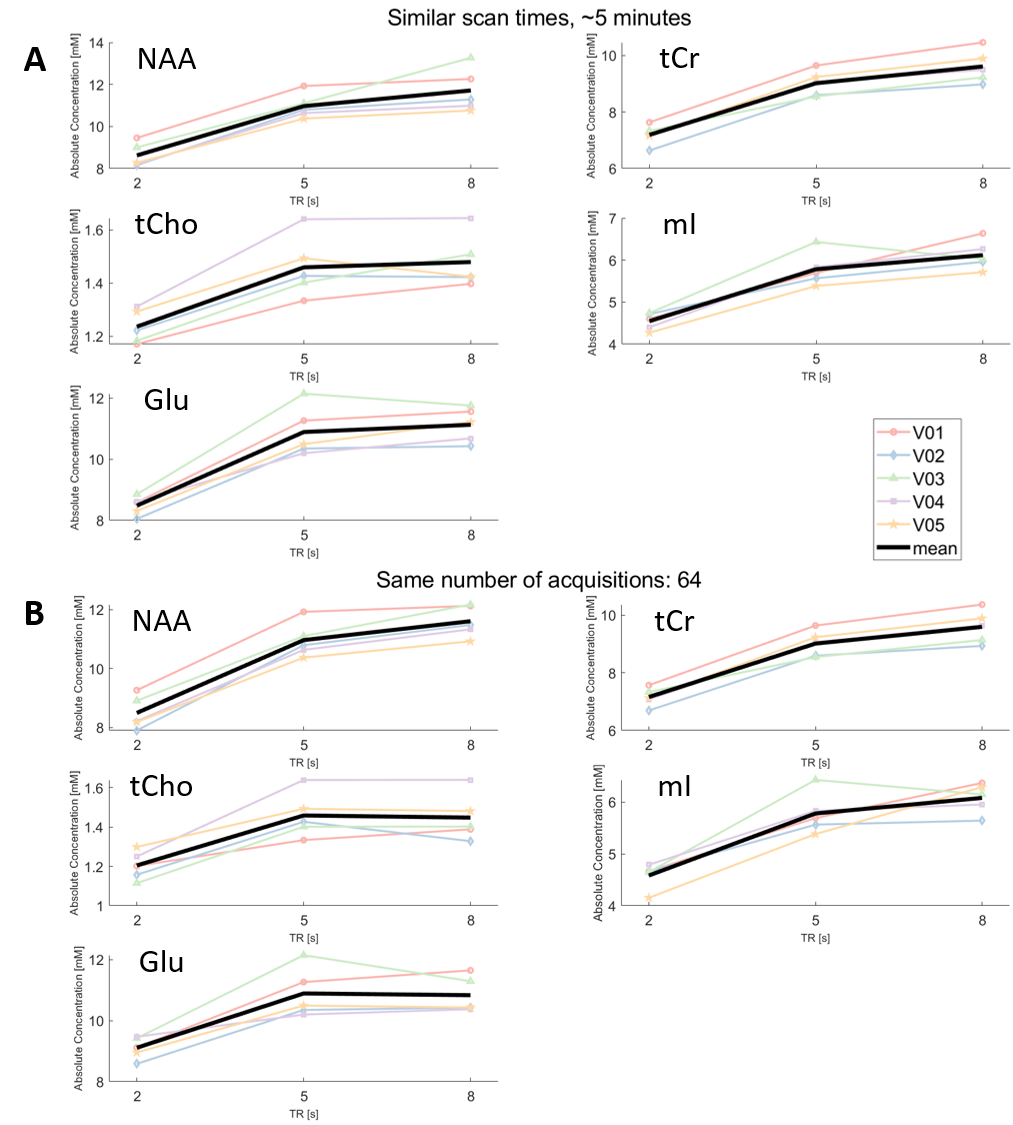
Figure 3 demonstrates SNR as a function of TR. When the scan time was held constant at approximately 5 minutes (Figure 3A, with the constraint of collecting full phase cycles), the SNR for TR=5s was approximately equal to the SNR at TR=2s, which had twice as many NSAs (128). The SNR decreased on average by 21% (range 17-24%) at TR 8s with only 32 NSAs. For constant NSA (Figure 3B), the SNR increased with increasing TR, however the scan time increased as well.Figure 4 compares absolute metabolite concentration against TR. For an approximately 5-minute scan time (Figure 4A) the absolute concentration of each of metabolite was on average 20% (range 15-22%) lower with TR=2s than TR=5s. For constant NSA, metabolite concentrations were reduced by 19% (range 16-22%) at TR=2s relative to TR=5s.
Discussion
For the same SNR, and approximately the same scan time, metabolite concentrations were 20% less when using a TR=2s compared to a TR=5s. While this concentration difference is due to T1 weighting, metabolite T1 values are not known for every brain region, in every decade of life, and in every disease or condition. To correct the absolute metabolite concentrations with TR<5s requires assumptions of metabolite T1 values, but metabolite T1 values change from region to region18, and could potentially also change with age or in pathology. Our results demonstrate that assumptions about metabolite T1s can be avoided with a small increase in scan time (from 4:24 to 5:40min) by using TR=5s and half the NSA. Compared to the SNR and absolute concentrations obtained with a TR=8s (where NAA signal losses are <1%), the TR=5s spectra exhibited a higher SNR in the same scan time with a much smaller difference in resulting absolute concentration values. Thus, by avoiding T1 weighting in the measured spectra, using a TR=5s yields a more accurate estimation of the concentration of each metabolite, and will enable a greater sensitivity for MRS to detect differences between groups or over time without the confounding effect of potential changes in metabolite T1s.Conclusion
In roughly the same total scan time, using TR=5s with half as many acquisitions as used for TR=2s, maintains the same quality of data, results in a greater confidence in absolute metabolite concentrations, and ultimately will improve the sensitivity of MRS to changes in metabolite levels.Acknowledgements
The authors wish to thank Jessica Archibald and Dr. Niklaus Zoelch for sharing the semi-LASER basis set that was simulated with the actual adiabatic RF pulse shapes. Thank you to the study participants. This work was conducted on the traditional, ancestral, and unceded territories of Coast Salish Peoples, including the territories of the xwməθkwəy̓əm (Musqueam), Skwxwú7mesh (Squamish), Stó:lō and Səl̓ílwətaʔ/Selilwitulh (Tsleil- Waututh) Nations.
References
1. Barbagallo G, Arabia G, Morelli M, et al. Thalamic neurometabolic alterations in tremulous Parkinson’s disease: A preliminary proton MR spectroscopy study. Park Relat Disord. 2017;43:78-84. doi:10.1016/j.parkreldis.2017.07.028
2. Kirov II, Liu S, Tal A, et al. Proton MR spectroscopy of lesion evolution in multiple sclerosis: Steady-state metabolism and its relationship to conventional imaging. Hum Brain Mapp. 2017;38(8):4047-4063. doi:10.1002/hbm.23647
3. Fardanesh R, Marino MA, Avendano D, Leithner D, Pinker K, Thakur SB. Proton MR spectroscopy in the breast: Technical innovations and clinical applications. J Magn Reson Imaging. 2019;50(4):1033-1046. doi:10.1002/jmri.26700
4. Landheer K, Gajdošík M, Juchem C. A semi-LASER, single-voxel spectroscopic sequence with a minimal echo time of 20.1 ms in the human brain at 3 T. NMR Biomed. 2020;33(9):1-12. doi:10.1002/nbm.4324
5. Camicioli RM, Korzan JR, Foster SL, et al. Posterior cingulate metabolic changes occur in Parkinson’s disease patients without dementia. Neurosci Lett. 2004;354(3):177-180. doi:10.1016/j.neulet.2003.09.076
6. Ethofer T, Mader I, Seeger U, et al. Comparison of Longitudinal Metabolite Relaxation Times in Different Regions of the Human Brain at 1.5 and 3 Tesla. Magn Reson Med. 2003;50(6):1296-1301. doi:10.1002/mrm.10640
7. Knight-Scott J, Brennan P, Palasis S, Zhong X. Effect of repetition time on metabolite quantification in the human brain in 1H MR spectroscopy at 3 tesla. J Magn Reson Imaging. 2017;45(3):710-721. doi:10.1002/jmri.25403
8. Träber F, Block W, Lamerichs R, Gieseke J, Schild HH. 1H Metabolite Relaxation Times at 3.0 Tesla: Measurements of T1 and T2 Values in Normal Brain and Determination of Regional Differences in Transverse Relaxation. J Magn Reson Imaging. 2004;19(5):537-545. doi:10.1002/jmri.20053
9. An L, Araneta MF, Victorino M, Shen J. Determination of Brain Metabolite T1 Without Interference From Macromolecule Relaxation. J Magn Reson Imaging. 2020;52(5):1352-1359. doi:10.1002/jmri.27259
10. Li Y. T1 and T2 Metabolite Relaxation Times in Normal Brain at 3T and 7T. J Mol Imaging Dyn. 2013;02(02):1-5. doi:10.4172/2155-9937.s1-002
11. Öz G, Deelchand DK, Wijnen JP, et al. Advanced single voxel 1H magnetic resonance spectroscopy techniques in humans: Experts’ consensus recommendations. NMR Biomed. 2021;34(5):1-18. doi:10.1002/nbm.4236
12. Murray ME, Przybelski SA, Lesnick TG, et al. Early Alzheimer’s disease neuropathology detected by proton MR spectroscopy. J Neurosci. 2014;34(49):16247-16255. doi:10.1523/JNEUROSCI.2027-14.2014
13. Deelchand DK, Berrington A, Noeske R, et al. Across-vendor standardization of semi-LASER for single-voxel MRS at 3T. NMR Biomed. 2021;34(5):1-11. doi:10.1002/nbm.4218
14. Provencher SW. Estimation of metabolite concentrations from localized in vivo proton NMR spectra. Magn Reson Med. 1993;30(6):672-679. doi:10.1002/mrm.1910300604
15. Simpson R, Devenyi GA, Jezzard P, Hennessy TJ, Near J. Advanced processing and simulation of MRS data using the FID appliance (FID-A)—An open source, MATLAB-based toolkit. Magn Reson Med. 2017;77(1):23-33. doi:10.1002/mrm.26091
16. Zhang, Y; Brady, M; Smith S. Segmentation of brain MR images through a hidden Markov random field model and the Expectation-Maximization Algorithm. IEEE Trans Med Imaging. 2001;20(1):45-57.
17. Macmillan EL, Tam R, Zhao Y, et al. Progressive multiple sclerosis exhibits decreasing glutamate and glutamine over two years. Mult Scler. 2016;22(1):112-116. doi:10.1177/1352458515586086
18. Sporn L, MacMillan EL, Ge R, Greenway K, Vila-Rodriguez F, Laule C. Longer Repetition Time Proton MR Spectroscopy Shows Increasing Hippocampal and Parahippocampal Metabolite Concentrations with Aging. J Neuroimaging. 2019;29(5):592-597. doi:10.1111/jon.12648
Figures
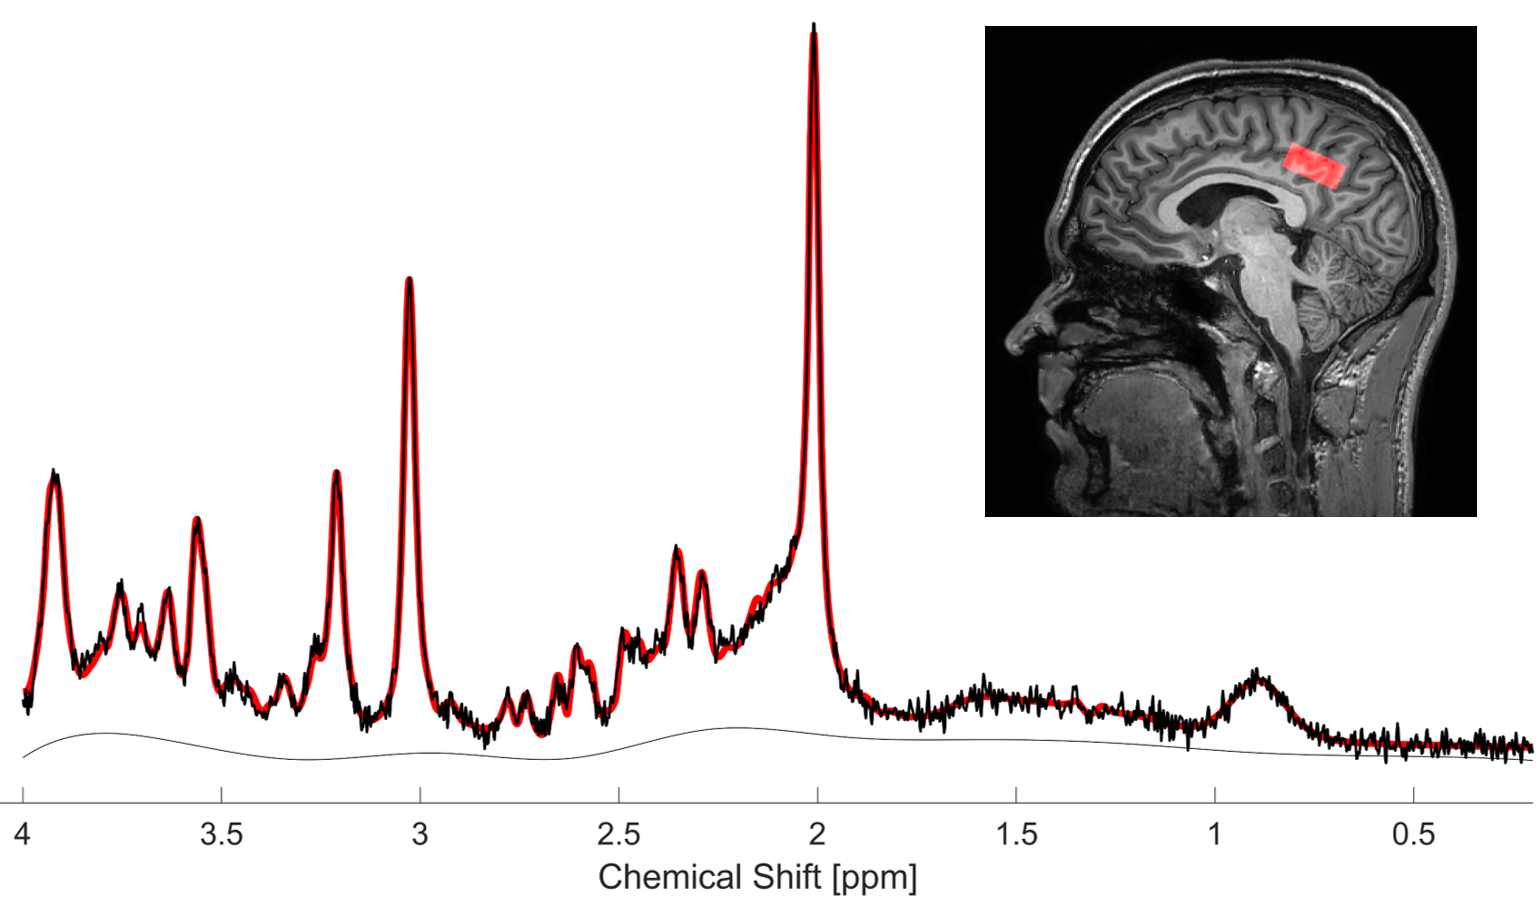
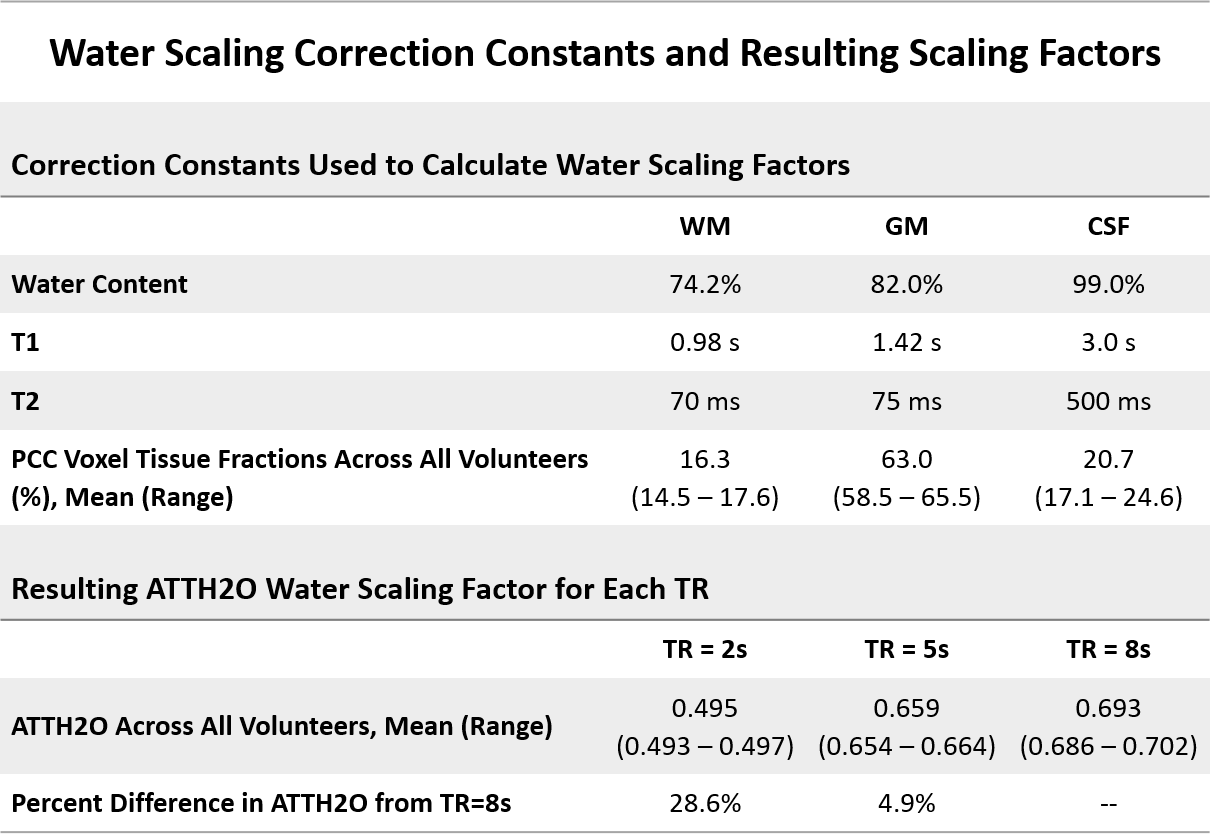
Table of water content and relaxation time constants used to scale the water peak areas in the calculation of absolute metabolite concentrations. The resulting mean water scaling factors (ATTH2O) demonstrate that when TR=5s, the water attenuation is within 5% of the attenuation at TR=8s. Thus, trends in absolute metabolite concentrations with increasing TR cannot fully be attributed to changes in the water scaling factors used for each TR.