1889
The Effect of Differences in MRS Parameters on Data Harmonization of Normative Data1ECE, Boston University, Boston, MA, United States, 2Radiology, Brigham and Women's Hospital, Boston, MA, United States
Synopsis
Building normative databases for MR spectroscopy studies is much needed to further the use of MRS in large clinical studies. The effect of differences in MRS parameters is not well documented and there are no established data harmonization methods for MRS data. Therefore, the goal of this study is to identify the effects of variations such as dwell time, coil type, and software version and describe a method for harmonizing data in healthy controls that will ameliorate those effects.
INTRODUCTION
Several consensus publications by spectroscopy experts have called for the need for normative data to be available for clinical studies1,2 . The lack of a publicly available normative spectroscopy database hampers the use of MR spectroscopy for clinical trials and its general clinical utility. Unfortunately, simply compiling multiple MRS datasets is not sufficient as the various acquisition parameters often differ between studies and it is unclear the impact of those variations will have on the MRS results. Furthermore, there does not exist well-established methods of harmonizing MRS data. Even data acquired from a single site may not necessarily be harmonized. To start the process of exploring the effects of different parameters and harmonizing them, we have selected normative data collected from multiple single voxel spectroscopy studies from a single site acquired over a period of 10 years. While the basic acquisition parameters remained constant (manufacturer, field strength, echo time, repetition time, number of averages, voxel size) there still remained several variations in the data acquired over that time. This included scanner type (Verio vs Skyra), spectral bandwidth, software version, and coil choice (32 ch vs 20 ch head coil). The goal of our study was to determine the effect of these different parameters upon MRS quantitation results and determine how to best harmonize the data. As the data was pulled from a broad range of ages, it will be helpful to see whether the data harmonization methods still maintain well-known age effects. The results of this study will then help guide how to create large normative datasets for use in future studies.METHODS
Dataset: This study includes (n=95) healthy control subjects from multiple studies in a single site (Figure 1) on Siemens 3T MRI scanners. Single voxel MRS data were acquired in the posterior cingulate of the brain using short-echo-point-resolved (PRESS) with TE=30ms, TR=2s, 128 averages, 8 cc volume. The single-voxel MRS raw data were pre-processed using Suspect library3. Pre-processing includes channel combination, frequency drift correction, residual water suppression, and/or eddy-current correction. The pre-processed spectra were quantified using LCModel4. Concentration of the following metabolites are used in our data analysis: total NAA (tNAA, including NAA + NAA-Glutamate), total creatine (tCr, including Creatine + PhosphoCreatine), total Choline (tCho, including PhosphoCholine + Choline), Glutamate + Glutamine (Glx), and myoinositol (Ins).Harmonization: Metabolite concentration with Cramer-Rao Lower Bound (CRLB) greater than 20% is considered unreliable for most metabolites. Therefore, the average concentration of metabolite is computed as weighted average using the following equations $$$\overline{C} = \sum{w}_{j}{C}_{j}/\sum{w}_{j}$$$, $$${w}_{j} = 1/{\sigma}_{j}$$$, $$${\sigma}_{j}= {(\%S.D)}_{j}{C}_{j}/100$$$ , and the standard deviation is computed using equation $$$\sigma(\overline{C}) = 1/\sqrt{\sum{w}_{j}}$$$ for each dataset in the table in Figure 1. We correct the absolute concentration of metabolites for variation in the scanner model, data bandwidth, scanner software version, and the number of channels in the head coil using a reference-based scaling model as given in equation $$$\hat{{x}_{ij}} ={x}_{ij}({\sigma}_{{y}_{i}}/{\sigma}_{{x}_{i}}) - (\overline{{x}_{i}}({\sigma}_{{y}_{i}}/{\sigma}_{{x}_{i}}) - \overline{{y}_{i}})$$$. Here, y is the reference dataset and x is dataset to scale. The harmonization method corrects for one covariate at once, and therefore the order of covariate affects the concentration of harmonized data. As part of our analysis, we evaluated 24 permutations of covariates. The unharmonized and harmonized data distribution are compared using one-way ANOVA.
RESULTS and DISCUSSION
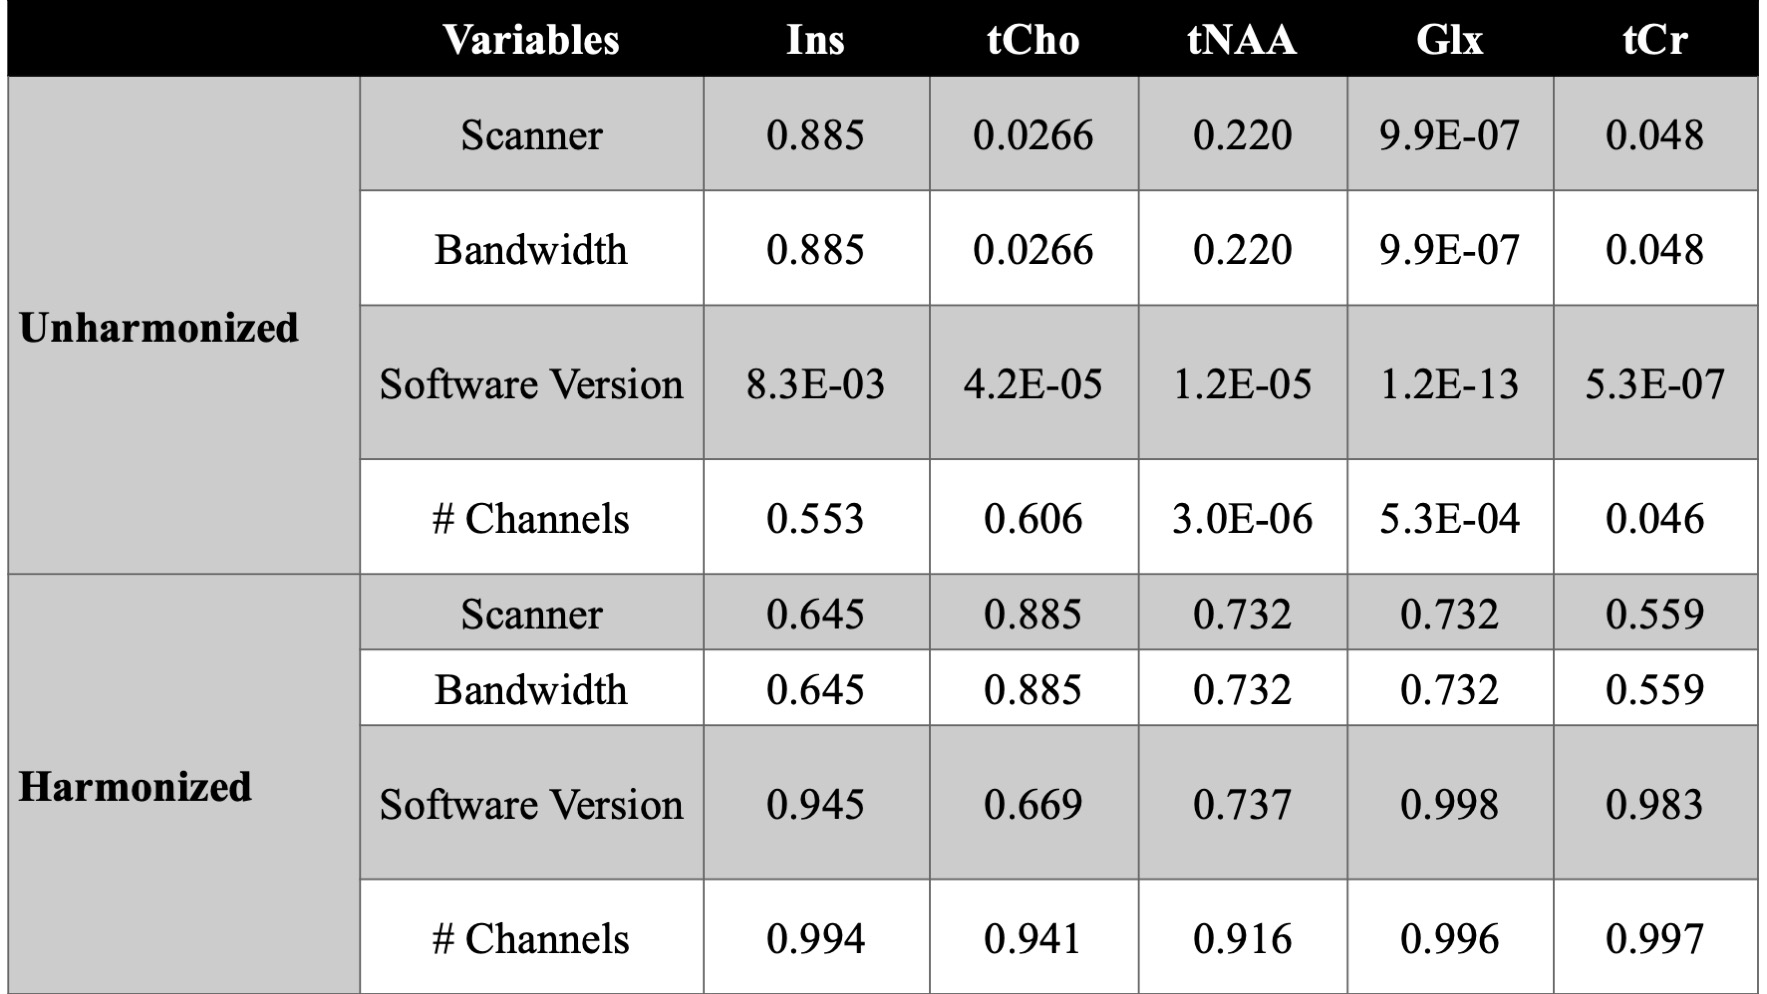
Figure 2A-E shows that the control data acquired in a single site have significant variation before harmonization. As part of our analysis, we correct for one covariate at once, and therefore there are 24 permutations of covariates. We evaluated each permutation, and Figure 3 summarizes the effect of harmonization grouped by the number of channels for the five metabolites. After analyzing the results of 24 permutations, 6 have homogeneous data distribution across the different datasets. Figure 2F-J shows the boxplot of metabolite concentration for the control data after harmonization.Additionally, we evaluated the effect of the harmonization method on the age of the subjects. The linear relationship between tNAA and age (Figure 4A-B), tCr, and age (Figure 4E-F) remain consistent before and after harmonization. However, we observe a negative linear relationship between Glx and age (Figure 4C-D), as observed in the previous work5. We summarize the statistical results from one-way ANOVA before and after harmonization in Figure 5. All p-values that show significance before harmonization have no significance after harmonization.
CONCLUSION
In this work, we demonstrated that our harmonization method effectively removes unwanted variations in the dataset with healthy controls. The method was able to still maintain well-known age effects expected to be in metabolites. These results enable the possibility to pool dataset across multiple studies and promotes extensive multi-center MRS studies.Acknowledgements
No acknowledgement found.References
1. Oz G, Alger JR, Barker PB, Bartha R, Bizzi A, Boesch C, Bolan PJ, Brindle KM, Cudalbu C, Dinçer A, Dydak U, Emir UE, Frahm J, González RG, Gruber S, Gruetter R, Gupta RK, Heerschap A, Henning A, Hetherington HP, Howe FA, Hüppi PS, Hurd RE, Kantarci K, Klomp DW, Kreis R, Kruiskamp MJ, Leach MO, Lin AP, Luijten PR, Marjańska M, Maudsley AA, Meyerhoff DJ, Mountford CE, Nelson SJ, Pamir MN, Pan JW, Peet AC, Poptani H, Posse S, Pouwels PJ, Ratai EM, Ross BD, Scheenen TW, Schuster C, Smith IC, Soher BJ, Tkáč I, Vigneron DB, Kauppinen RA; MRS Consensus Group. Clinical proton MR spectroscopy in central nervous system disorders. Radiology. 2014 Mar;270(3):658-79. doi: 10.1148/radiol.13130531. PMID: 24568703; PMCID: PMC4263653.
2. Bartnik-Olson BL, Alger JR, Babikian T, Harris AD, Holshouser B, Kirov II, Maudsley AA, Thompson PM, Dennis EL, Tate DF, Wilde EA, Lin A. The clinical utility of proton magnetic resonance spectroscopy in traumatic brain injury: recommendations from the ENIGMA MRS working group. Brain Imaging Behav. 2021 Apr;15(2):504-525. doi: 10.1007/s11682-020-00330-6. PMID: 32797399; PMCID: PMC7882010.
3. Rowland, B.C., Sreepada, L.P., Jiang, S.H., & Lin, A.P. (2017). OpenMRSLab: An open‐source software repository for magnetic resonance spectroscopy data analysis tools.
4. Provencher, S. (2020) LCModel and LCMgui User’s Manual. http://s-provencher.com/pub/LCModel/manual/manual.pdf
5. Bell, Tiffany K., Kate J. Godfrey, Ashley L. Ware, Keith Owen Yeates, and Ashley D. Harris. "Harmonisation of multi-site MRS data with ComBat." bioRxiv (2021)
Figures