1888
Investigating the feasibility to assess the alveolar-volume-to-blood membrane thickness with hyperpolarized xenon-129 MRI using simulations
Kai Ruppert1, Tahmina S. Achekzai1, Luis Loza1, Faraz Amzajerdian1, Yi Xin1, Hooman Hamedani1, Ryan J. Baron1, Mostafa Ismail1, Ian F. Duncan1, Stephen Kadlecek1, and Rahim R. Rizi1
1University of Pennsylvania, Philadelphia, PA, United States
1University of Pennsylvania, Philadelphia, PA, United States
Synopsis
The thickness of the membrane separating the alveolar volume from the capillary blood is difficult measure with the chemical shift saturation recovery (CSSR) hyperpolarized xenon-129 MRI technique. In this work, we used a 1D gas exchange simulation to investigate the concept of measuring the gas-phase depolarization induced by the application of long RF pulses of variable power to extract information about the thickness of this membrane. Our simulations predict that measuring the red blood cell-induced gas-phase depolarization enables an estimation of membrane thickness even when the temporal lag between the rise in dissolved-phase signals cannot be accurately determined.
Purpose:
In the healthy mammalian lung, alveolar gases and the capillary blood are separated by an exceedingly thin barrier membrane that measures just a few tenths of a micrometer along those segments of the blood vessels where the bulk of the pulmonary gas exchange takes place. In principle, the thickness of this membrane can be measured via the chemical shift saturation recovery (CSSR) technique using hyperpolarized xenon-129 MRI1-9. This is typically achieved by saturating the magnetization of xenon dissolved in the lung parenchyma and subsequently monitoring its replenishment over time by gas exchange with the alveolar airspaces. Since xenon dissolved in lung tissue and blood plasma (TP) has a distinctly different resonance frequency than xenon bound to hemoglobin inside red blood cells (RBC) in humans as well as many other species, the membrane thickness would, in principle, be reflected by a time lag between the rising TP signal and the RBC signal. To our knowledge, however, such a lag has never been directly observed, for 2 main reasons: 1) the membrane is so thin that xenon atoms diffuse across it in less than 200 ms, a time regime not easily accessible on human whole-body MRI scanners; 2) the two dissolved-phase (DP) signals are so low immediately following the saturation of the DP magnetization that they are difficult to quantify and easily confounded by incomplete saturation. Here, we used a 1D gas exchange simulation to investigate the concept of measuring the gas-phase (GP) depolarization induced by the application of long RF pulses of variable power to extract information about the thickness of this membrane.Methods:
A 1D numerical lung model was used to simulate xenon gas exchange between the TP, RBC, and alveolar GP compartments comprising a single alveolus (Fig. 1). The vessel thickness was set to either 4 or 7 μm, while the membrane thickness was varied between 0 and 1 μm. At the start of the simulation, 24,000 xenon atoms were randomly distributed across the compartments in Fig. 1 such that, for a barrier thickness of 0 μm, 98% were in the GP and the remainder in the DP. This ratio was adjusted for the other simulated barrier thicknesses such that the xenon concentration within the alveolar wall remained constant. Random diffusional motion was simulated at 1.0 μs time increments, with diffusion constants of 0.68 10-5 m2s-1 in the GP and 0.33 10-9 m2s-1 in the DP, respectively. Other parameters included: infinite capillary transit time (stationary blood), infinite T1, 198 ppm TP frequency, 209 ppm RBC frequency, 0.64 RBC fraction (equivalent to 39% hematocrit10), 200 mm alveolar diameter, and effective T2* ~1 ms (DP) or 10 ms (GP), respectively. A B0 of 3T was assumed for future validation in rats in a small animal scanner. The temporal behavior of the magnetization vectors in the presence of a 500 ms RF pulse centered at 209 ppm with flip angle rates between 6°/ms and 60°/ms was simulated. The resulting GP depolarization was assessed at equilibrium, 150 ms after the end of the RF pulse. All simulations were repeated with the RBC frequency set to 309 ppm, essentially removing the contributions of the RBC resonance to the GP depolarization without disturbing the simulated system. The RBC-induced GP depolarization was calculated as the difference in GP depolarization with the RBC frequency at 209 ppm versus 309 ppm.Results and Discussion:
Figures 2a and 2c depict the GP depolarization as a function of flip angle rate for a 1 μm barrier thickness, with the RBC frequency at either 209 ppm or 309 ppm and a vessel diameter of 4 μm and 7 μm, respectively. Figures 2b and 2d show the RBC-induced GP depolarization as the difference between the 209 ppm and 309 ppm simulations for different membrane thicknesses. As expected, the GP depolarization for an RBC frequency of 209 ppm increases monotonously with flip angle rate; however, it also does so with the RBC frequency set to 309 ppm, largely outside the frequency range affected by the long RF pulse (Figs. 2a and 2c). This phenomenon is caused by the increasing off-resonance tipping of the TP magnetization vector by the increasing RF power. As the generated transverse TP magnetization is rapidly de-phased by the short DP T2*, the longitudinal TP magnetization decreases and, via exchange, subsequently reduces the GP magnetization. Thus, for a given membrane thickness, there is an RF power at which the longitudinal magnetization of freshly exchanged GP magnetization is already mostly saturated by the time it reaches the RBC compartment and the RBC-induced GP depolarization component disappears (Figs. 2b and 2d). Measuring the RBC-induced GP depolarization for several different RF powers would therefore allow us to estimate the membrane thickness even in the regime where the lag between the rise in RBC signal relative to the TP signal cannot be accurately determined.Conclusion
Our simulation study predicts that using long RF pulses of variable power permits a much more sensitive estimation of the thickness of the thin membrane separating the alveolar volume from the capillary blood than conventional CSSR measurements.Acknowledgements
Supported by NIH grants R01 HL129805, R01 HL139066, and R01 HL142258.References
[1] Ruppert K et al. NMR of hyperpolarized 129Xe in the canine chest: spectral dynamics during a breath-hold. NMR Biomed 2000;13:220-228. [2] Butler JP et al. Measuring surface-area-to-volume ratios in soft porous materials using laser-polarized xenon interphase exchange nuclear magnetic resonance. J Phys Condens Matter 2002;14:L297-L304. [3] Qing et al. Assessment of lung function in asthma and COPD using hyperpolarized 129Xe chemical shift saturation recovery spectroscopy and dissolved-phase MRI. NMR in Biomed 2014;27(12):1490-1501. [4] Zhong et al. Simultaneous assessment of both lung morphometry and gas exchange function within a single breath‐hold by hyperpolarized 129Xe MRI. NMR in Biomed 2017; 30(8). [5] Doganay et al. Quantification of regional early stage gas exchange changes using hyperpolarized 129Xe MRI in a rat model of radiation-induced lung injury. Med Phys 2016;43(5):2410-2420. [6] Kern et al. Regional investigation of lung function and microstructure 129Xe chemical shift saturation recovery parameters by localized and dissolved‐phase imaging: A reproducibility study. MRM 2019; 81(1):13-24. [7] Ruppert et al. Using Hyperpolarized Xenon-129 MRI to Quantify Early-Stage Lung Disease in Smokers. Acad Radiol 2019; 26(3):355-366. [8] Kern et al. Mapping of regional lung microstructural parameters using 129 Xe dissolved‐phase MRI in healthy volunteers hyperpolarized and patients with chronic obstructive pulmonary disease. MRM 2018; 81(4):2360-2373. [9] Zanette et al. Physiological gas exchange mapping of hyperpolarized 129Xe using spiral-IDEAL and MOXE in a model of regional radiation-induced lung injury. Med Phys 2018;45(2):803-816. [10] Norquay et al. Relaxation and Exchange Dynamics of Hyperpolarized 129Xe in Human Blood. MRM 2015;74:303-311.Figures
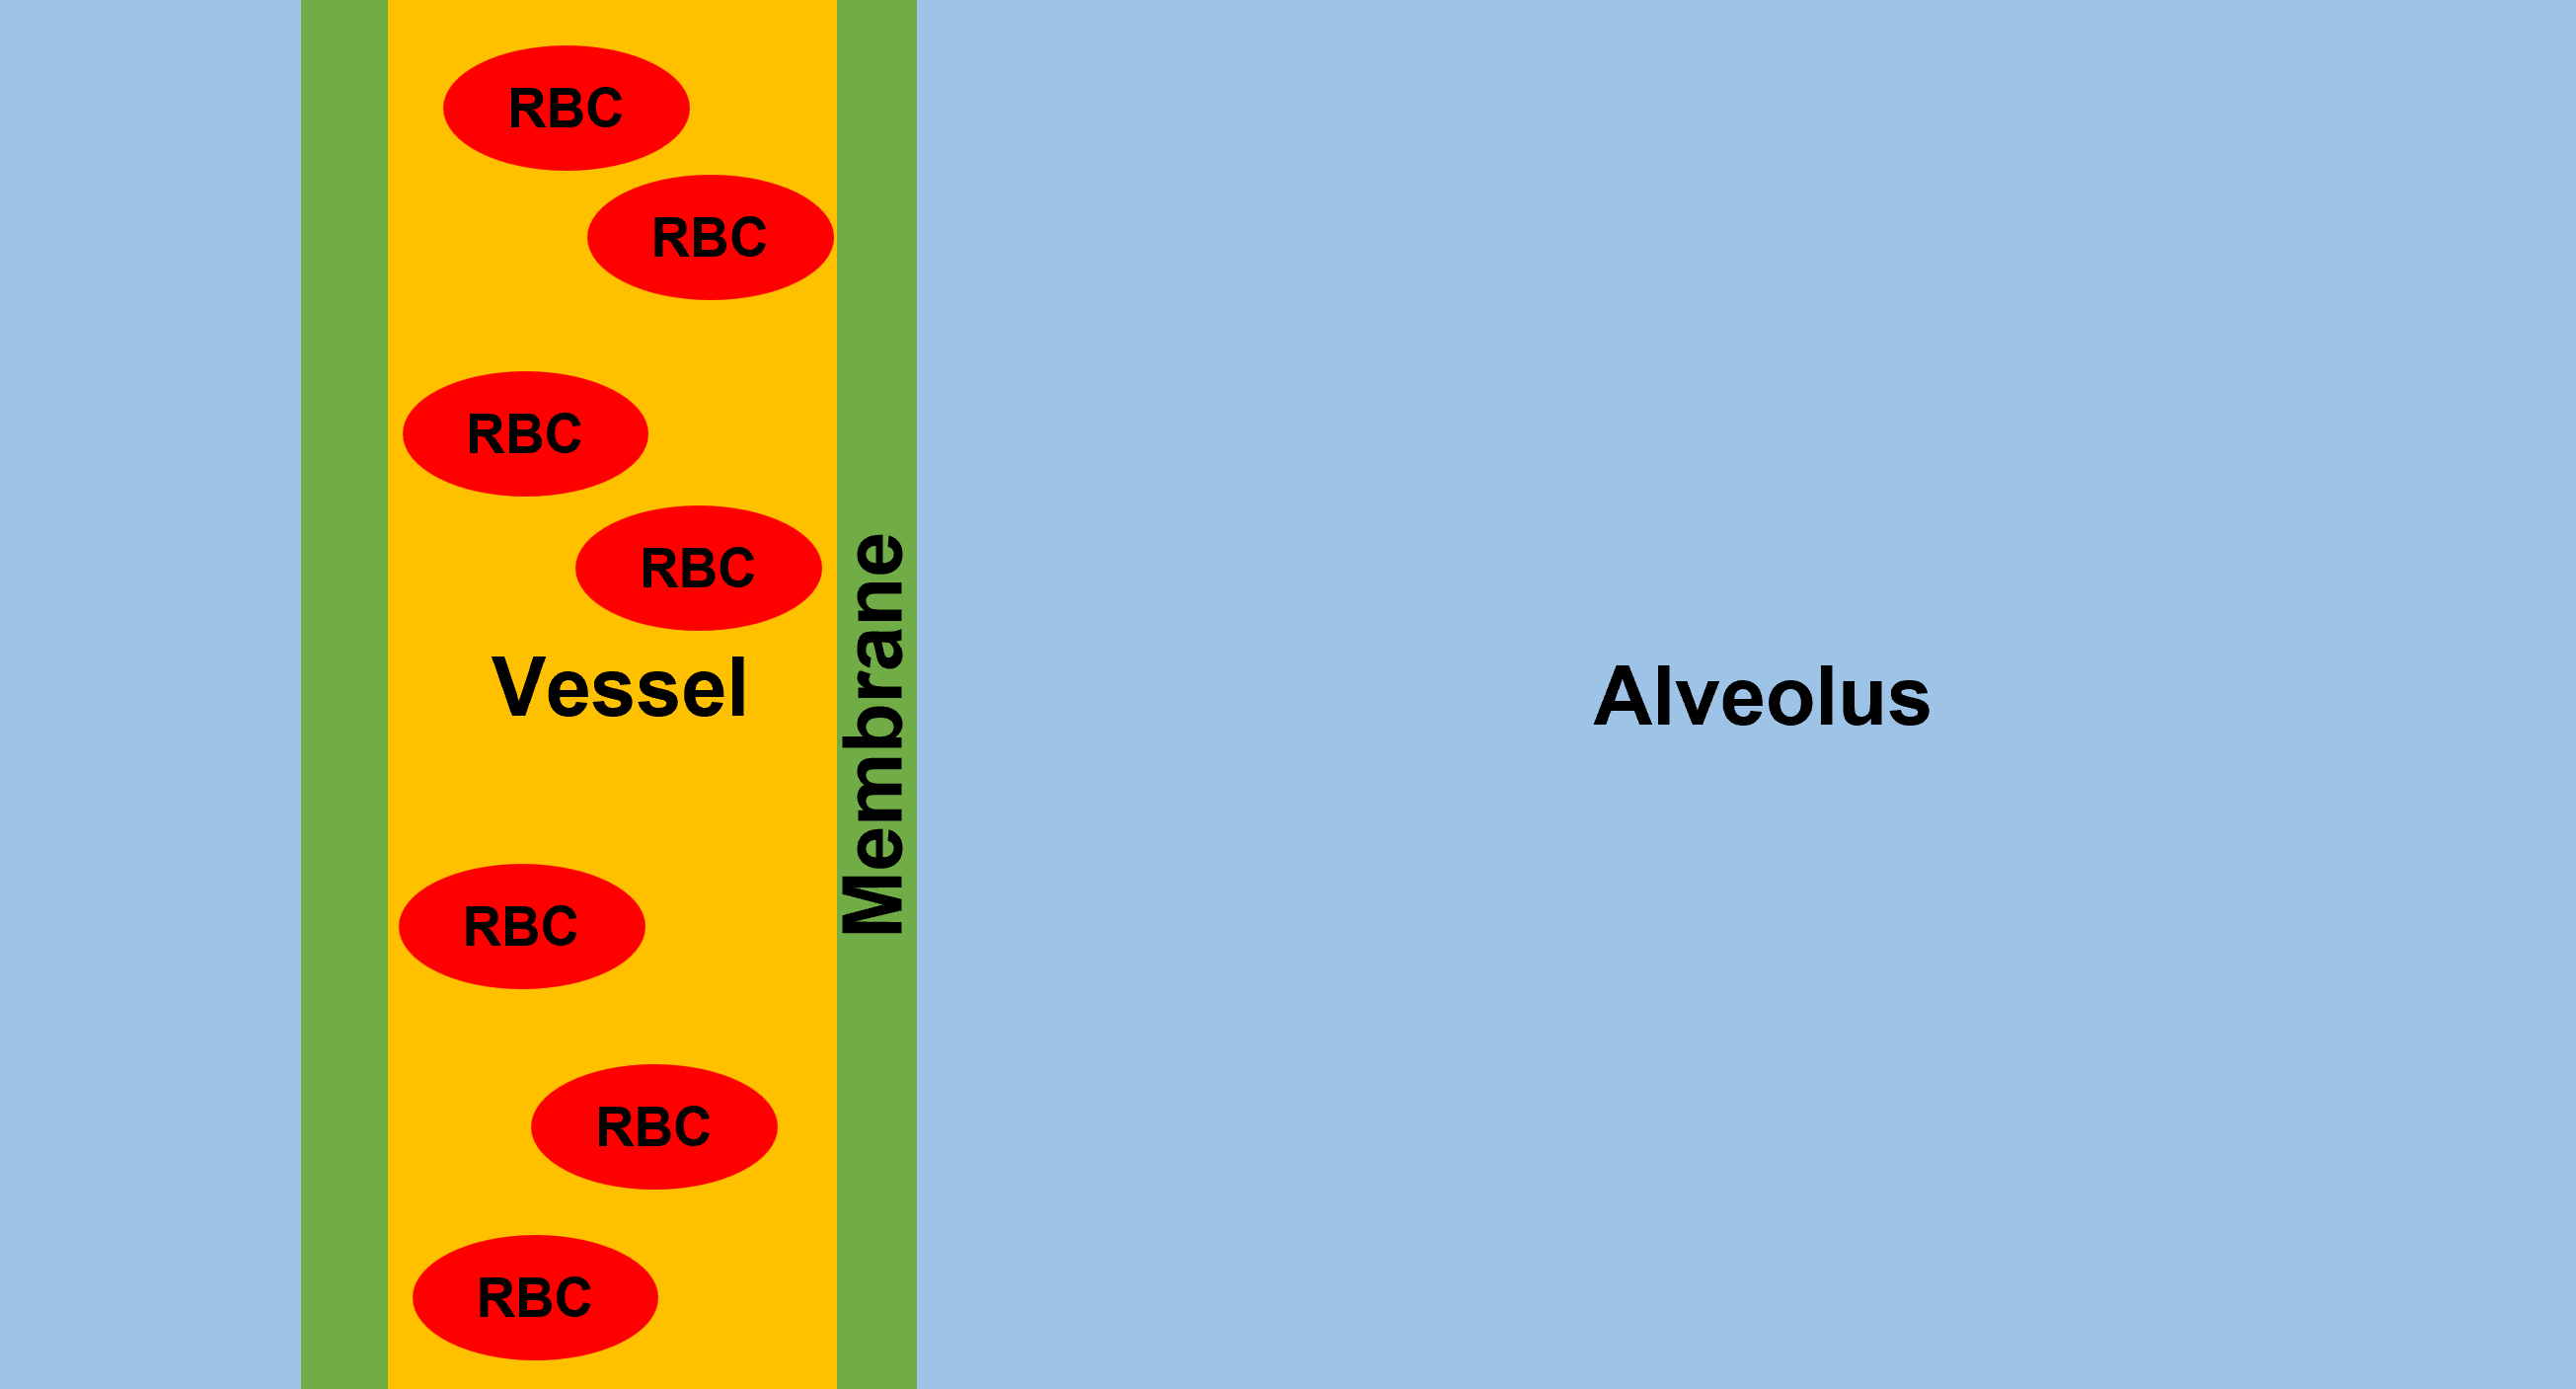
Figure 1. Schematic of the
simulated 1-dimensional pulmonary gas exchange model. A gas-filled alveolus is
separated by a thin membrane from a blood vessel containing red blood cells and
plasma. The magnetization vectors of freely diffusing xenon atoms are simulated
in the presence of long RF pulses with variable power.
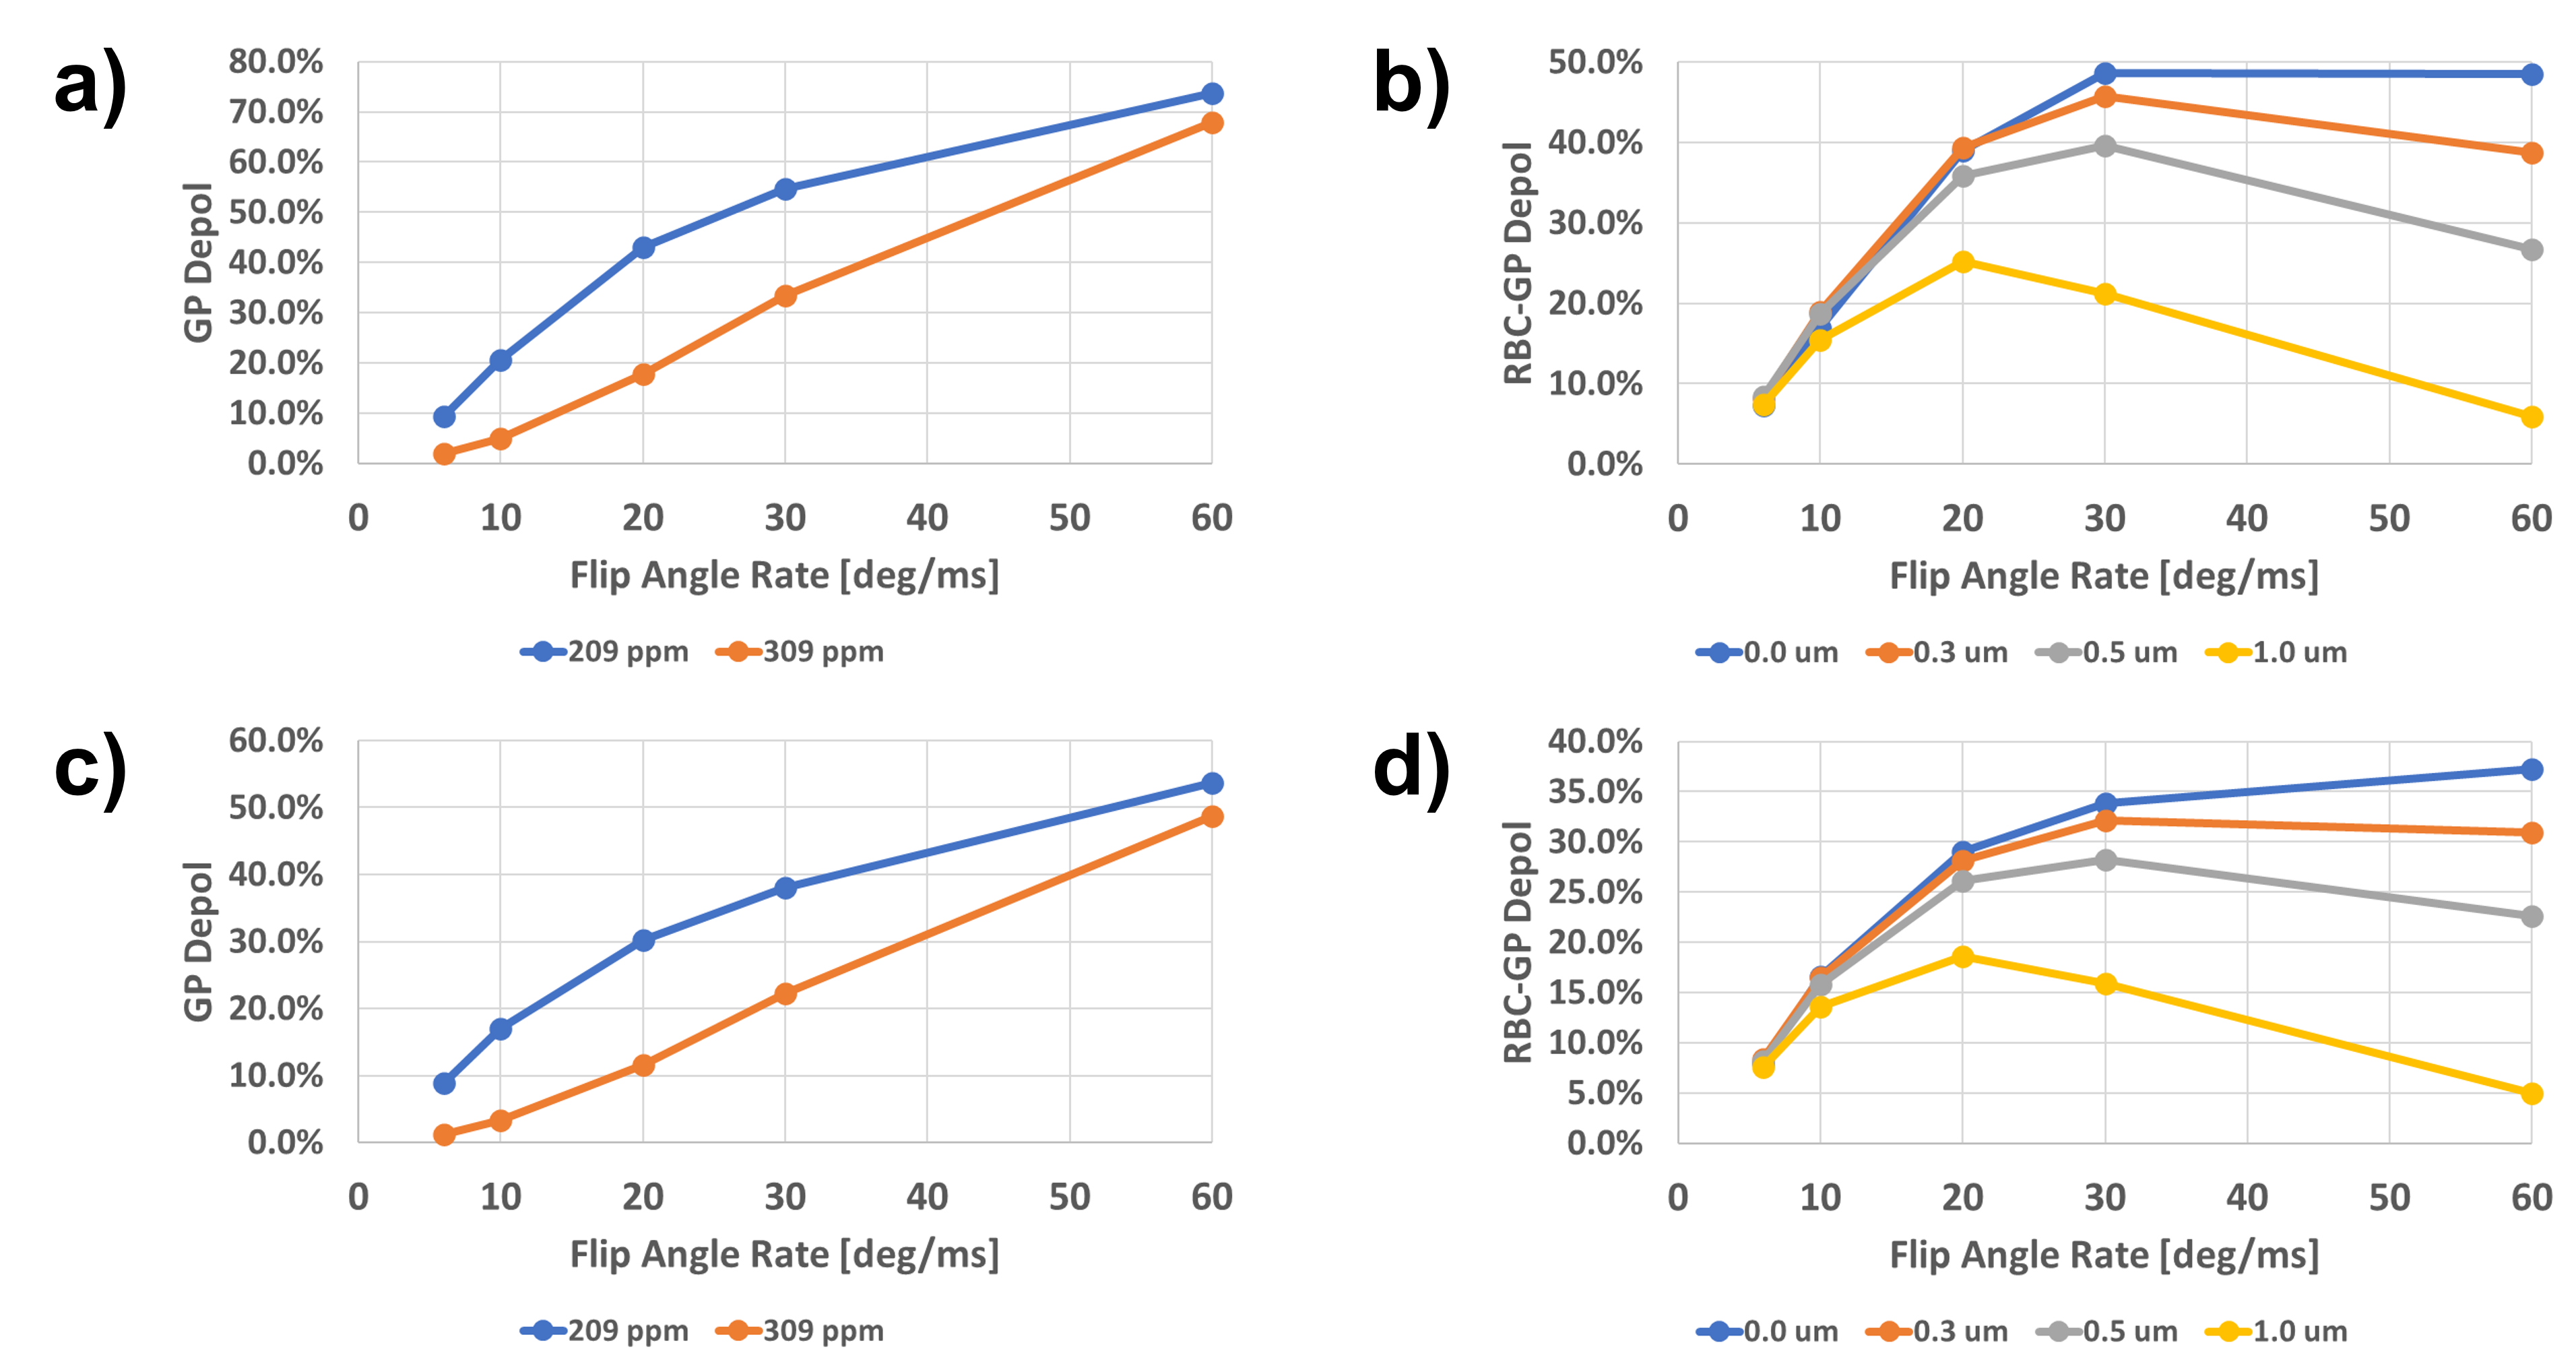
Figure 2. The impact of long
RF pulses centered at 209 ppm on the
longitudinal GP magnetization, with the simulated RBC frequency either at 209
ppm or 309 ppm, as a function of the flip angle rate of the RF pulse: (a) GP
depolarization for a 4 μm vessel diameter and a membrane
thickness of 1 μm; (b) RBC-induced GP depolarization for a 4 μm vessel diameter and a membrane thickness between 0 μm and 1 μm; (c) GP depolarization for a 7 μm vessel diameter and
a membrane thickness of 1 μm; (d) RBC-induced GP
depolarization for a 4 μm vessel diameter and a membrane
thickness between 0 μm and 1 μm.
DOI: https://doi.org/10.58530/2022/1888