1887
Dynamic 1H MR spectroscopy of yeast metabolism during gamma irradiation using a 1.5T MR-Linac1Physical Sciences Platform, Sunnybrook Research Institute, Toronto, ON, Canada, 2Department of Medical Biophysics, University of Toronto, Toronto, ON, Canada, 3Department of Medical Physics, Sunnybrook Health Sciences Centre, Toronto, ON, Canada, 4Department of Neurosurgery and Paediatric Neurosurgery, Medical University, Lublin, Poland
Synopsis
1H MR spectroscopy (MRS) can detect metabolic changes in treated tumours that could indicate therapeutic response. MR response assessment might inform radiation dose plan adaptation on MRI linear accelerators (MR-Linacs). We report the first MRS experiments on a 1.5T MR-Linac. Dynamic spectra of yeast during fermentation were acquired with and without irradiation, to measure real-time changes in metabolism. Ethanol production was detectable. The Larmor frequency drifted by 33 Hz over 11 minutes during irradiation, degrading spectral quality. While no differences in ethanol production were detected between irradiation/control experiments, the phantom setup could be optimized to increase dose and improve repeatability.
Introduction
Fraction-by-fraction adaptation of the dosimetry of treatment plans using MRI linear accelerators (MR-Linacs/MRLs) could be informed by early therapeutic response indicators, potentially including metabolic changes detectable using 1H MR spectroscopy (MRS)1-4. MR-Linacs enable concurrent irradiation and imaging, so immediate irradiation effects may be observable. Yeast (Saccharomyces cerevisiae) have been widely studied in cell biology5; their NMR spectra are well-characterized5,6; and their doubling time is approximately 90 minutes7, so the effects of irradiation should manifest within hours. We investigated whether dynamic 1H MRS on a 1.5T MR-Linac could detect real-time changes in yeast metabolism resulting from irradiation. We also measured the effects of the radiation beam on MRS acquisition.Methods
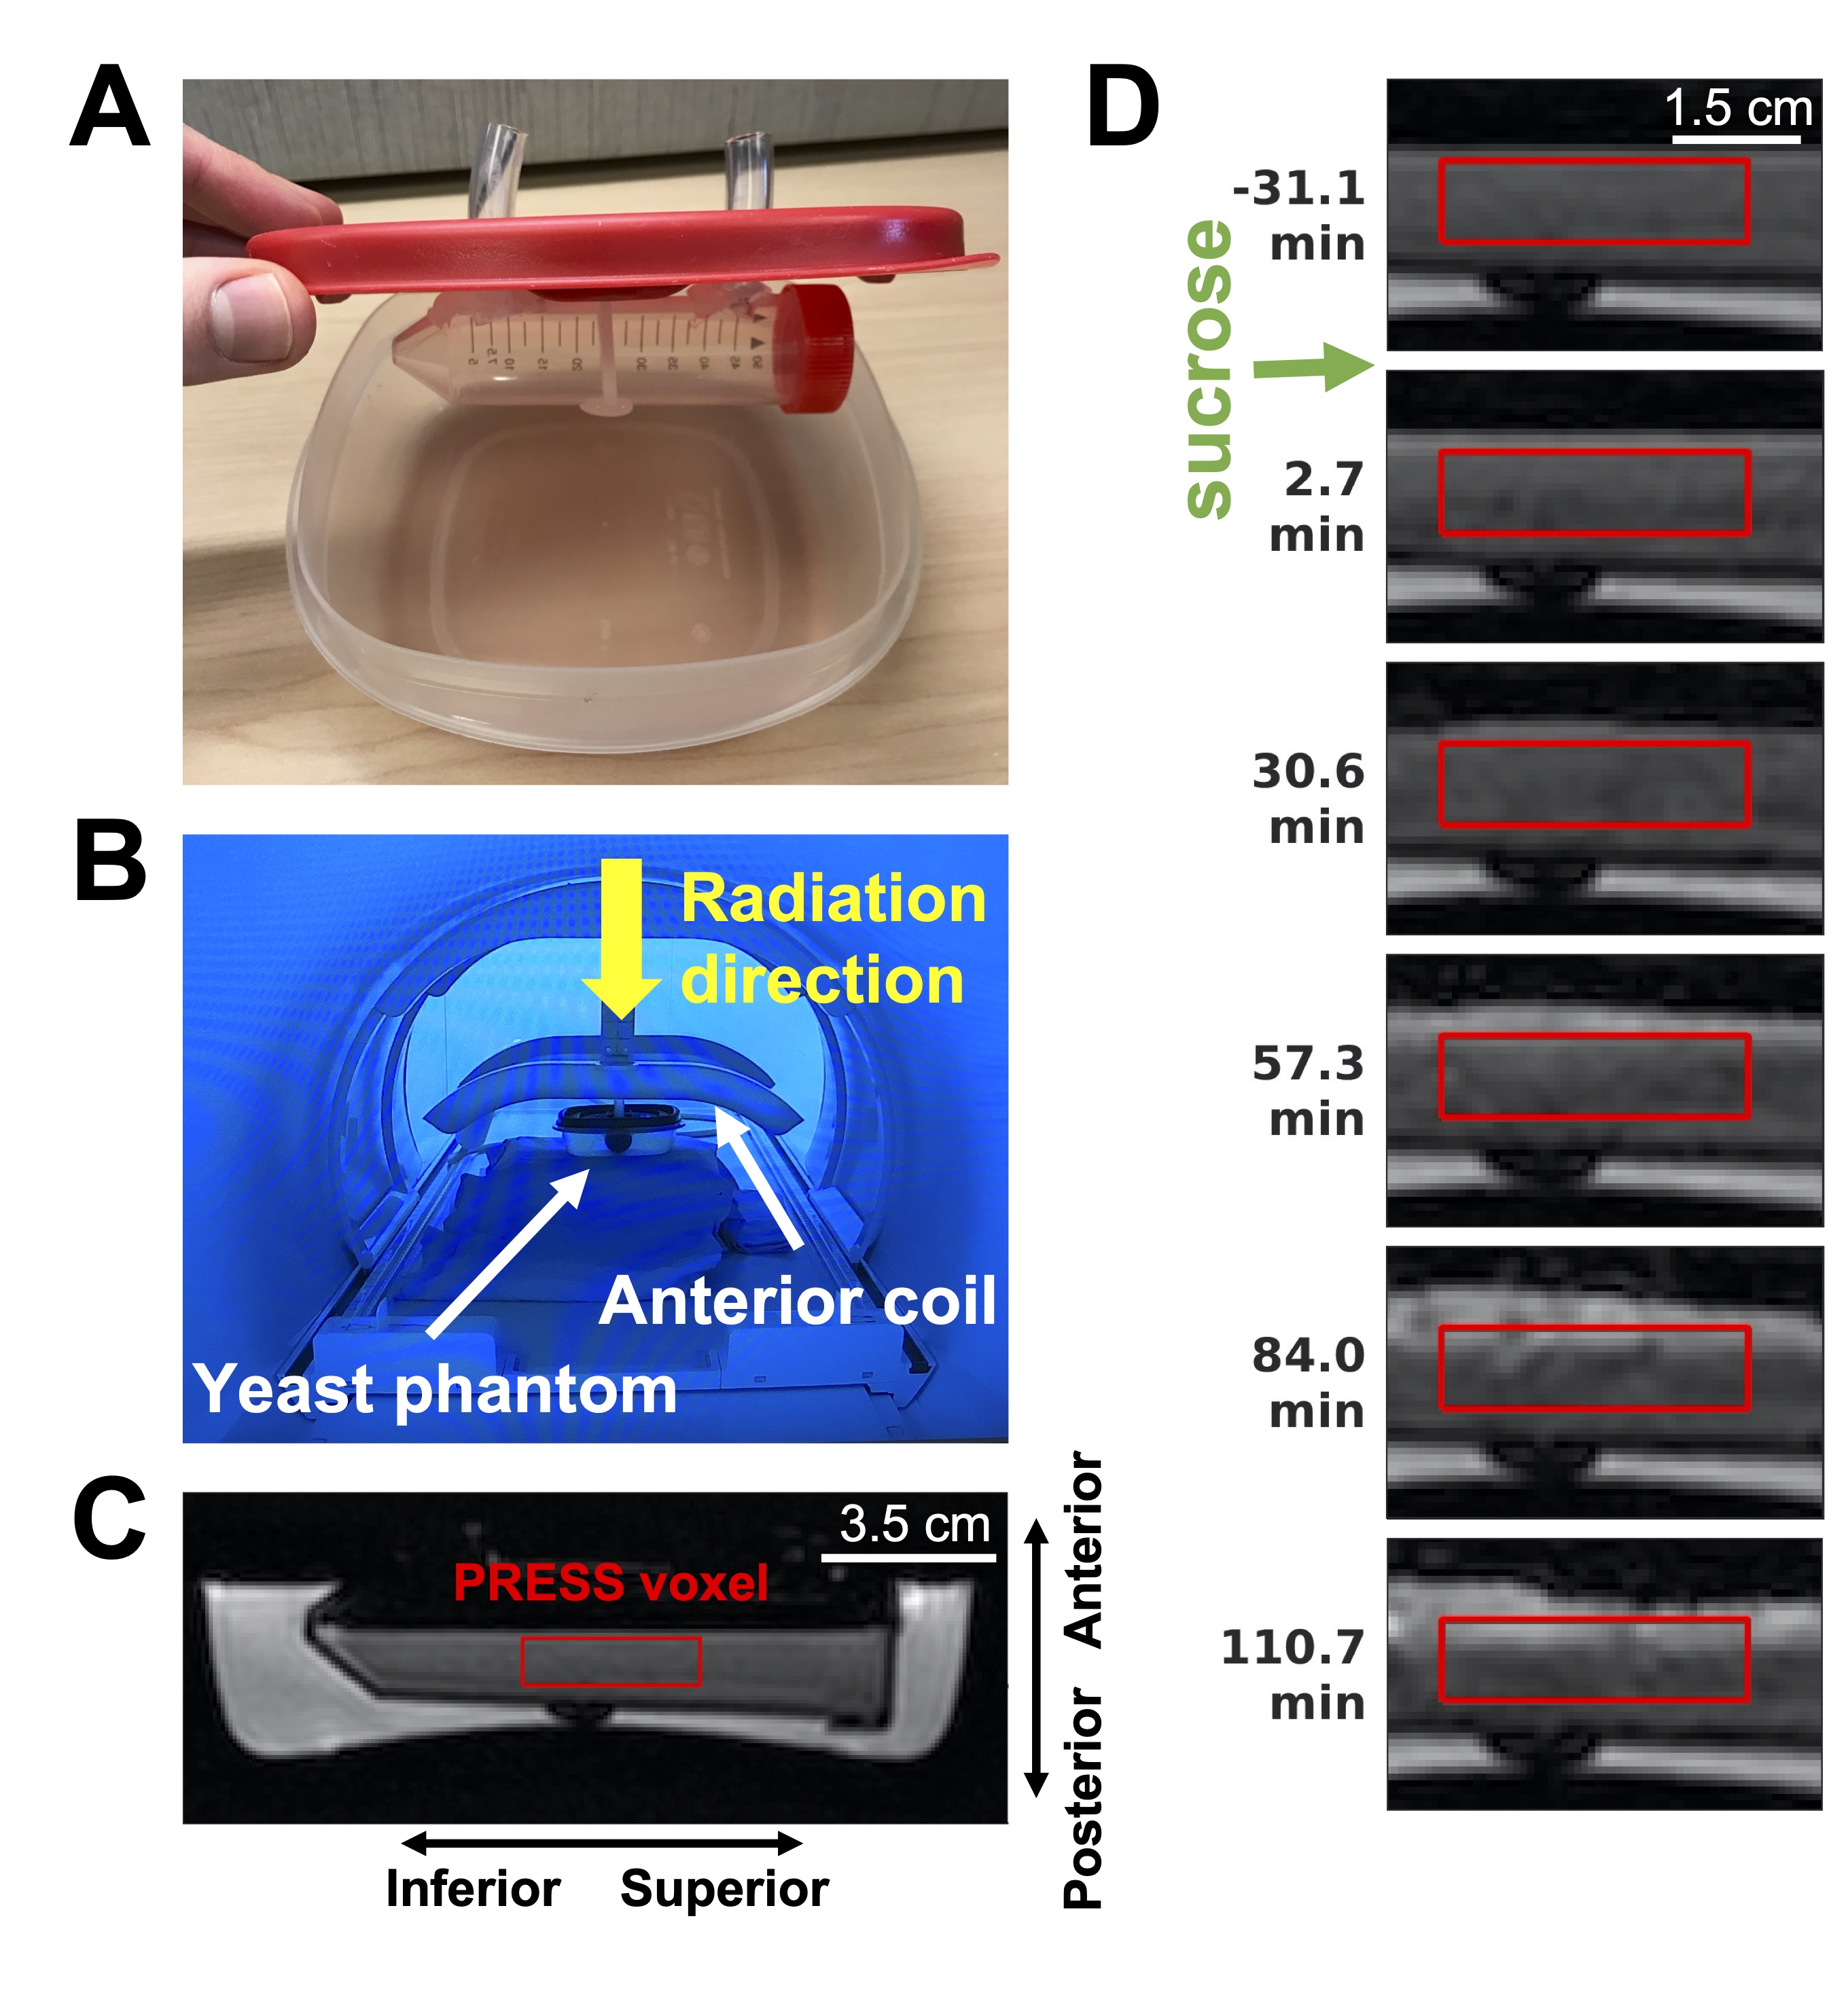
Sample preparation: For 1.5T MR-Linac scanning, yeast suspensions were prepared by mixing 4.1 g active dry yeast (S. cerevisiae, Fleischmann’s) with 30 mL water (23 °C, approximately) in a 50 mL falcon tube (Figure 1). For 7T scanning, 21.3 mg active dry yeast/0.9 mL water was scanned in a 6x50 mm MR-compatible glass tube. For fermentation experiments, 1 mL of 1.0 M sucrose solution was added.Acquisition of MR spectroscopy and imaging: Experiments were performed using a 1.5T Elekta Unity MR-Linac (Elekta AB, Stockholm), and a 7T Bruker (Bruker BioSpin, Billerica, MA). Single-voxel PRESS were acquired with CHESS water suppression (1.5T: TR/TE=3000/33 ms, 2048 points, 2.5 kHz spectral width, 10×15×35 mm3 voxel; 7T: TR/TE=2200/11 ms, 1024 averages, 8124 points, 5.5 kHz spectral width, 3×3×5 mm3 voxel). An 8-channel anterior/posterior receive coil was used for 1.5T scans. Water-unsuppressed spectra were also acquired. For 1.5T, T1-weighted GRE images were obtained (TR/TE=7.8/3.9 ms, 1.5×1.4×3 mm3 voxels).
Control and irradiation experiments: For two experiments (“Control 1,2”), spectra were continuously acquired at baseline (before the addition of sucrose) and during fermentation. For a third experiment (“Irradiation”), the radiation beam was turned on at 34 minutes after sucrose addition, for 25.6 minutes (dose rate: 390 monitor units (MUs)/min; total dose: 10,000 MUs).
Preprocessing and ethanol quantification: Bruker data was preprocessed online; only phasing and apodization was applied offline. MR-Linac spectral preprocessing included coil combination8, frequency/phase correction9, and phasing (FSL-MRS)10. Additional processing used MATLAB R2018b.
For comparison with Bruker data, 256 MR-Linac transients (=12.8 min) were averaged. Contiguous transients were averaged in groups of 64 (=3.2 min) for quantification of ethanol, and groups of 32 (=1.6 min) to study beam-on effects, for better time resolution.
After averaging, transients were apodized using 5 Hz exponential line broadening. Manual frequency correction/phasing was applied as necessary. MR-Linac water-suppressed spectra were normalized to water-unsuppressed spectra areas from integration between 3-6 ppm.
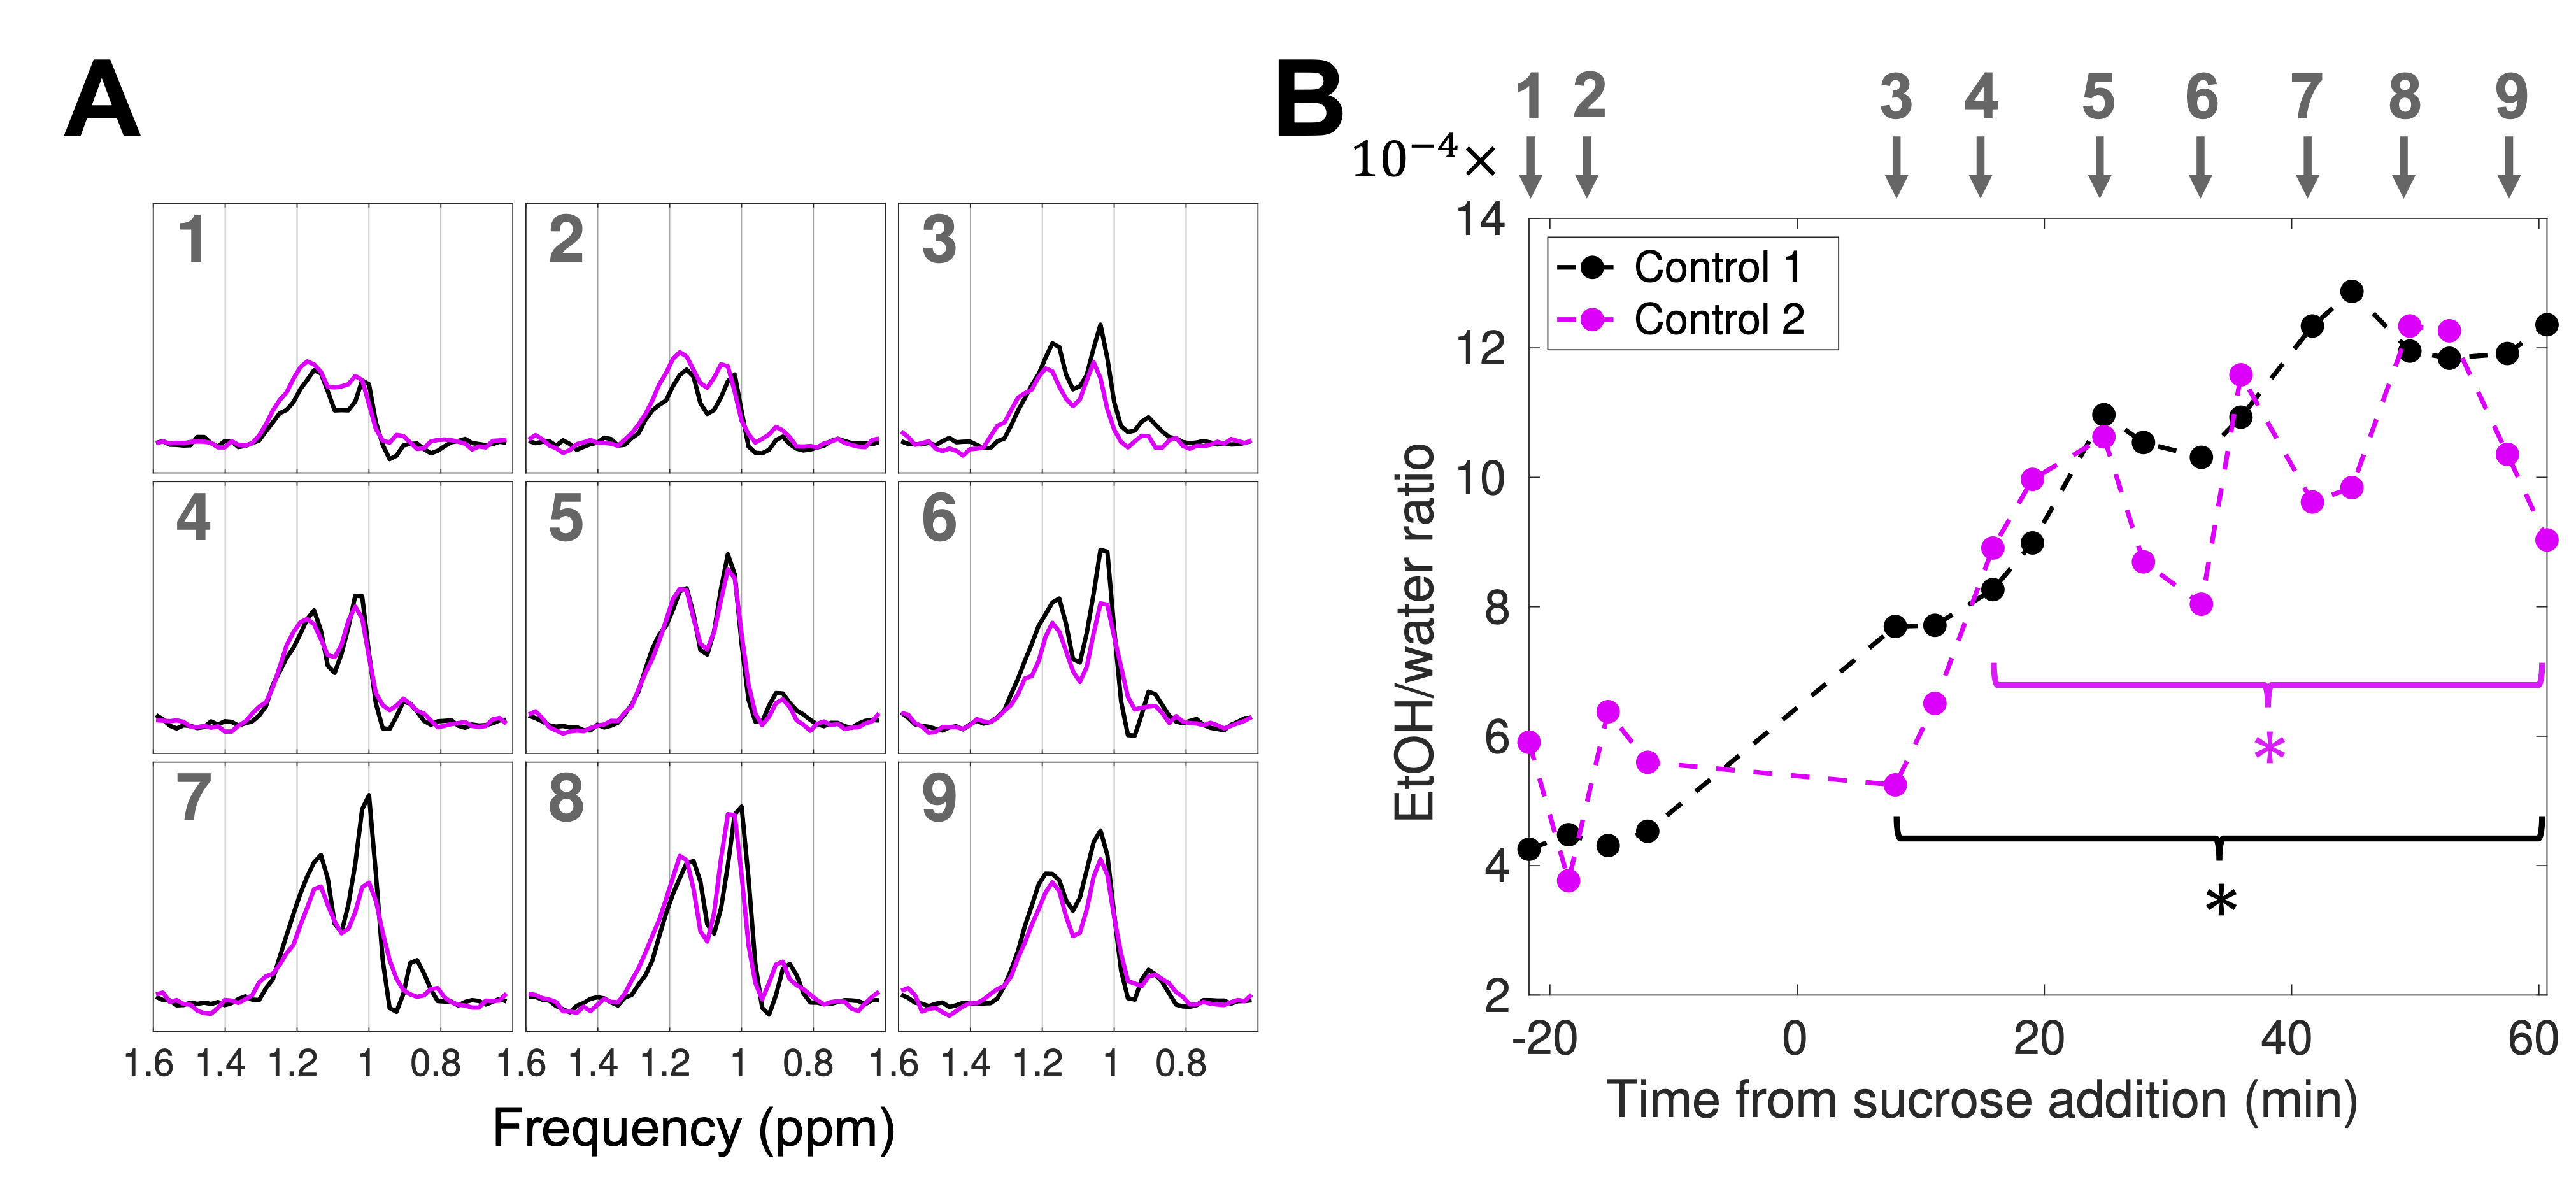
Ethanol production from fermentation11 was quantified using EtOH/water ratios. The spectral baseline was removed between 0.6-1.6 ppm by subtracting a cubic polynomial fit (to 0.6-0.8,1.3-1.6 ppm). The integral between 0.8-1.3 ppm quantified EtOH5.
Effects of time and irradiation on ethanol/water ratios: Differences in the EtOH/water ratio were assessed between time points and control/irradiation experiments using the repeatability coefficient ($$$RC = 2.77 \times \text{standard deviation}$$$)12,13. The within-session $$$RC$$$ was computed from baseline EtOH/water ratios. The between-session $$$RC$$$ was computed from the two control experiments using all values during fermentation.
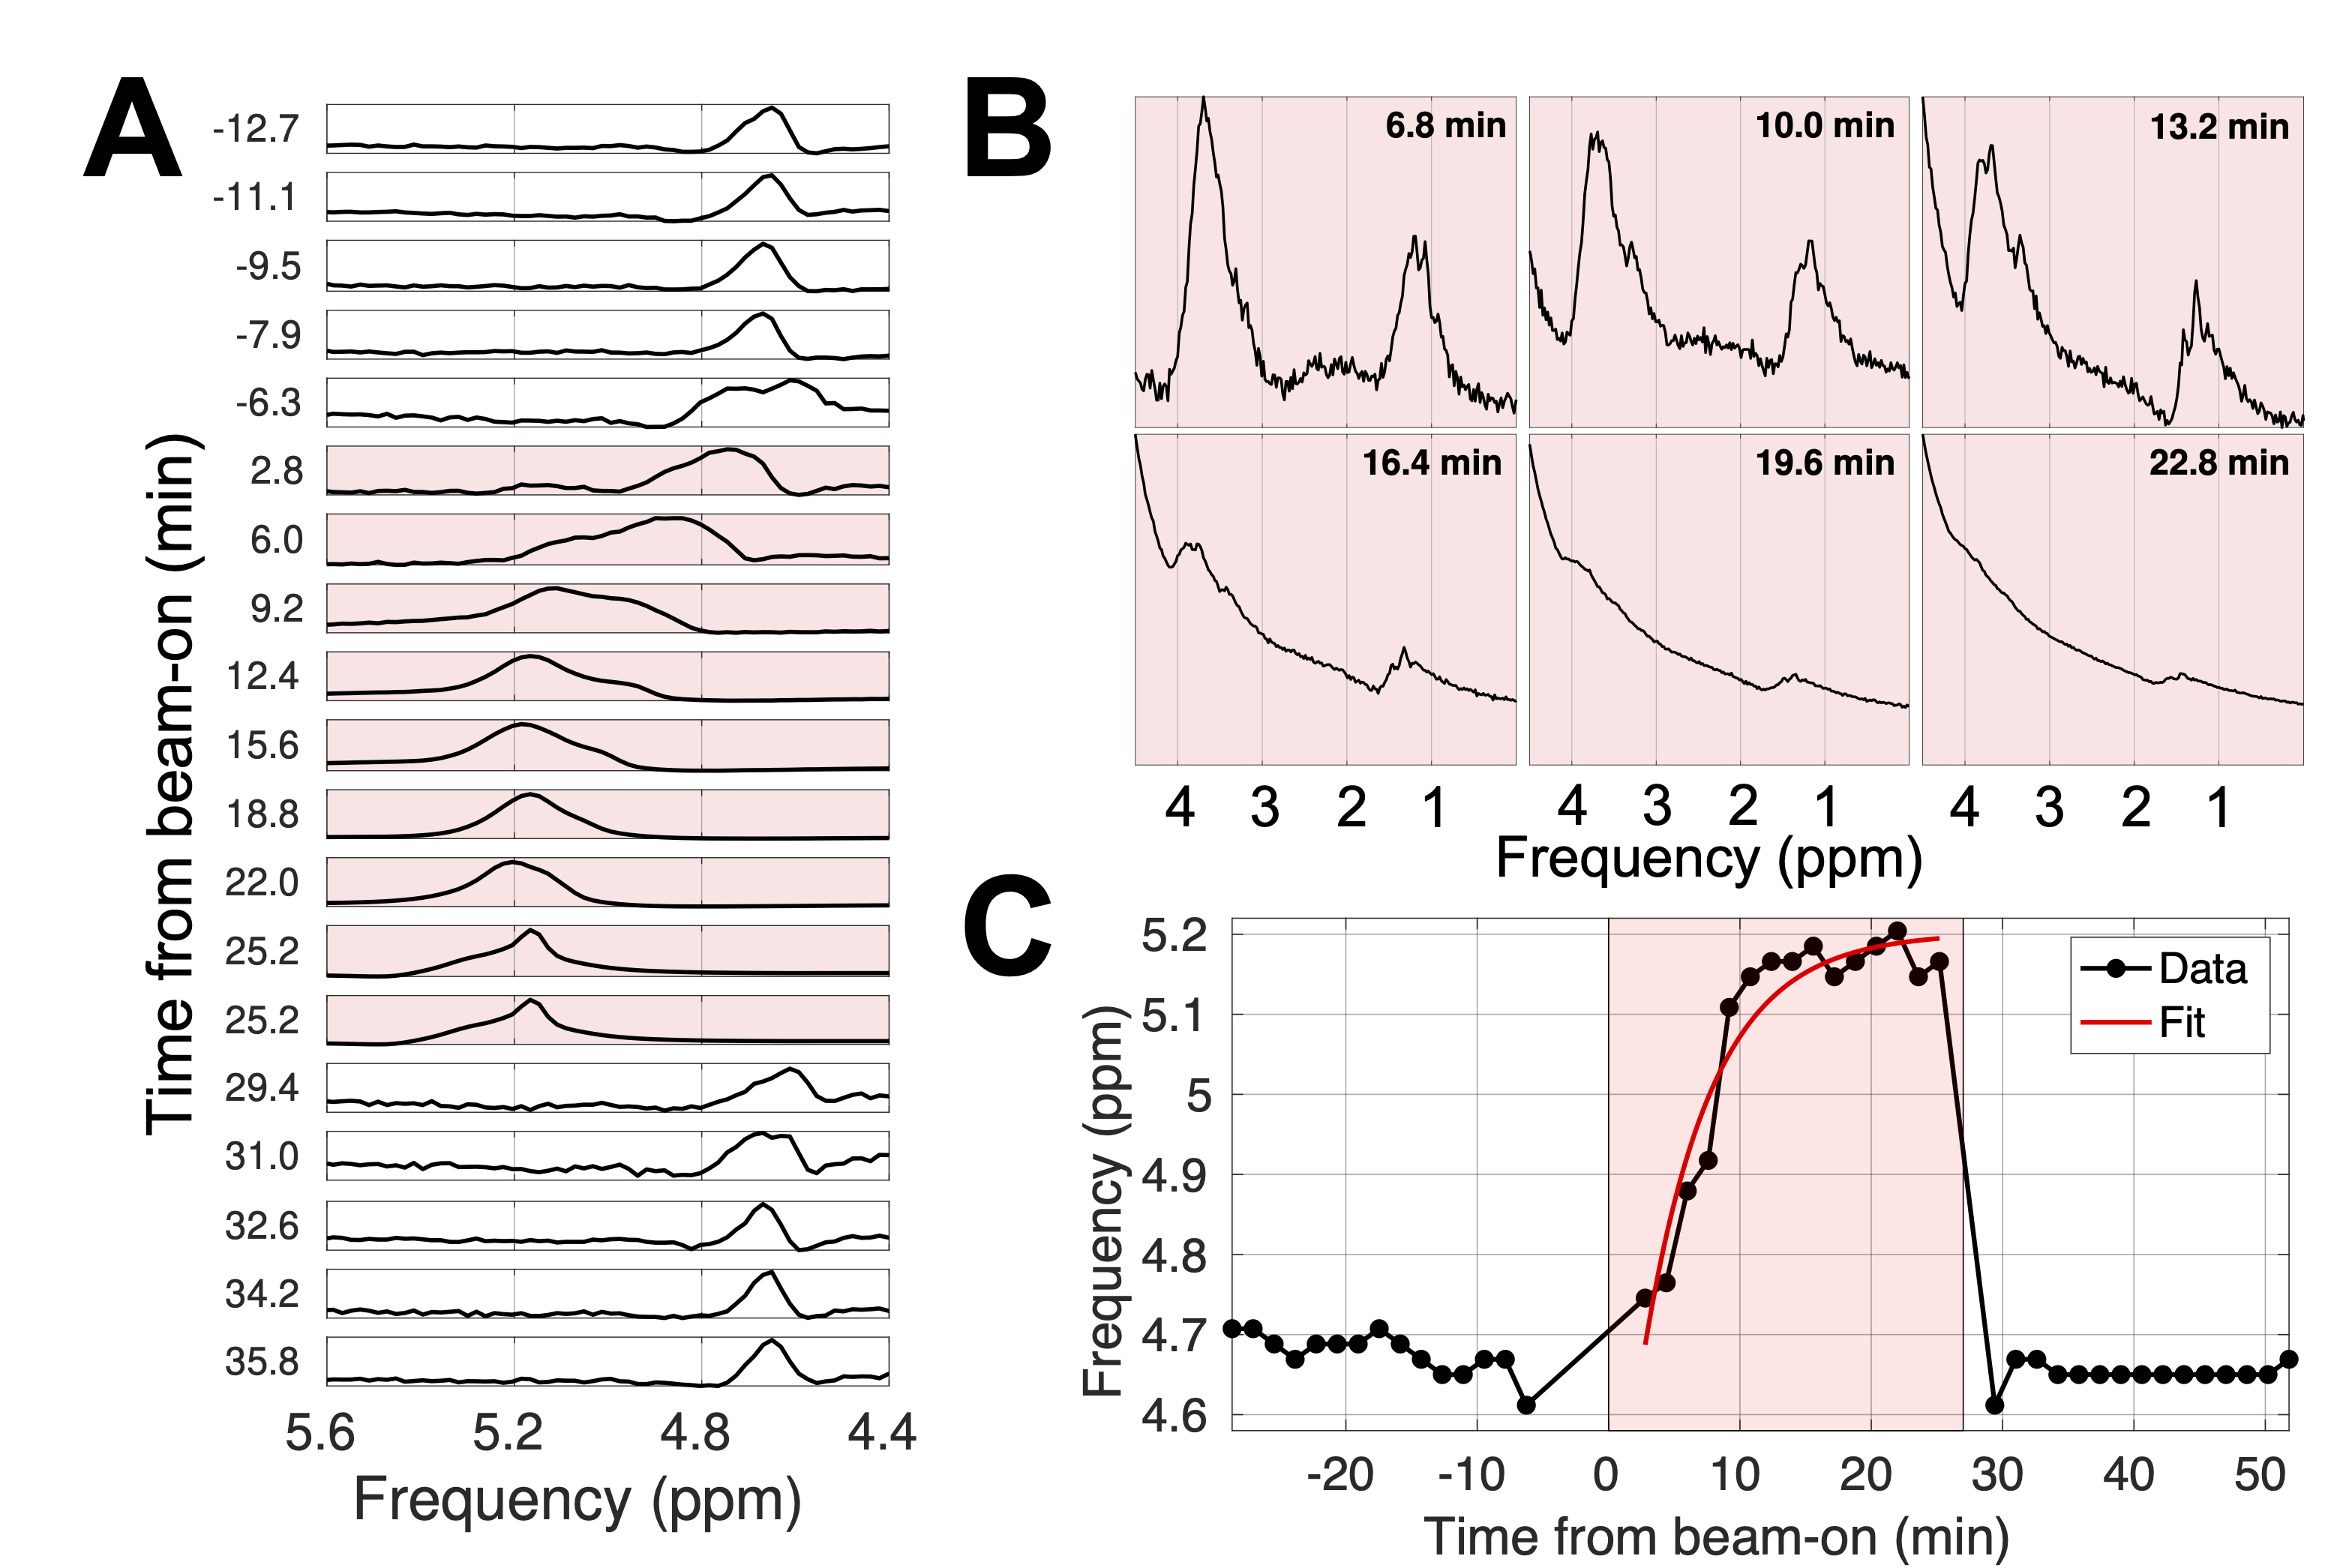
Frequency drift during irradiation: To quantify Larmor frequency drift during irradiation (Figure 5), the residual water peak frequency was fit to $$$f_0 + \Delta f (1-\exp(-t/\tau))$$$ ($$$t$$$ = time from beam-on; $$$f_0$$$, $$$\Delta f$$$, and $$$\tau$$$ are fit parameters). The mean pre-irradiation frequency (over 30 min) was computed.
Results
The 7T and MR-Linac spectra were similar (Figure 2). A 6 Hz (0.09 ppm) water-unsuppressed linewidth was achievable on the MR-Linac.The within-session $$$RC$$$ of the EtOH/water ratio at baseline was $$$0.37 \times 10^{-4}$$$ (Control 1) and $$$3.2 \times 10^{-4}$$$ (Control 2). The between-session $$$RC$$$ was $$$3.6 \times 10^{-4}$$$. The EtOH/water ratio was increased relative to baseline after 7.9 and 15.8 minutes for Control 1 and 2, respectively (Figure 3).
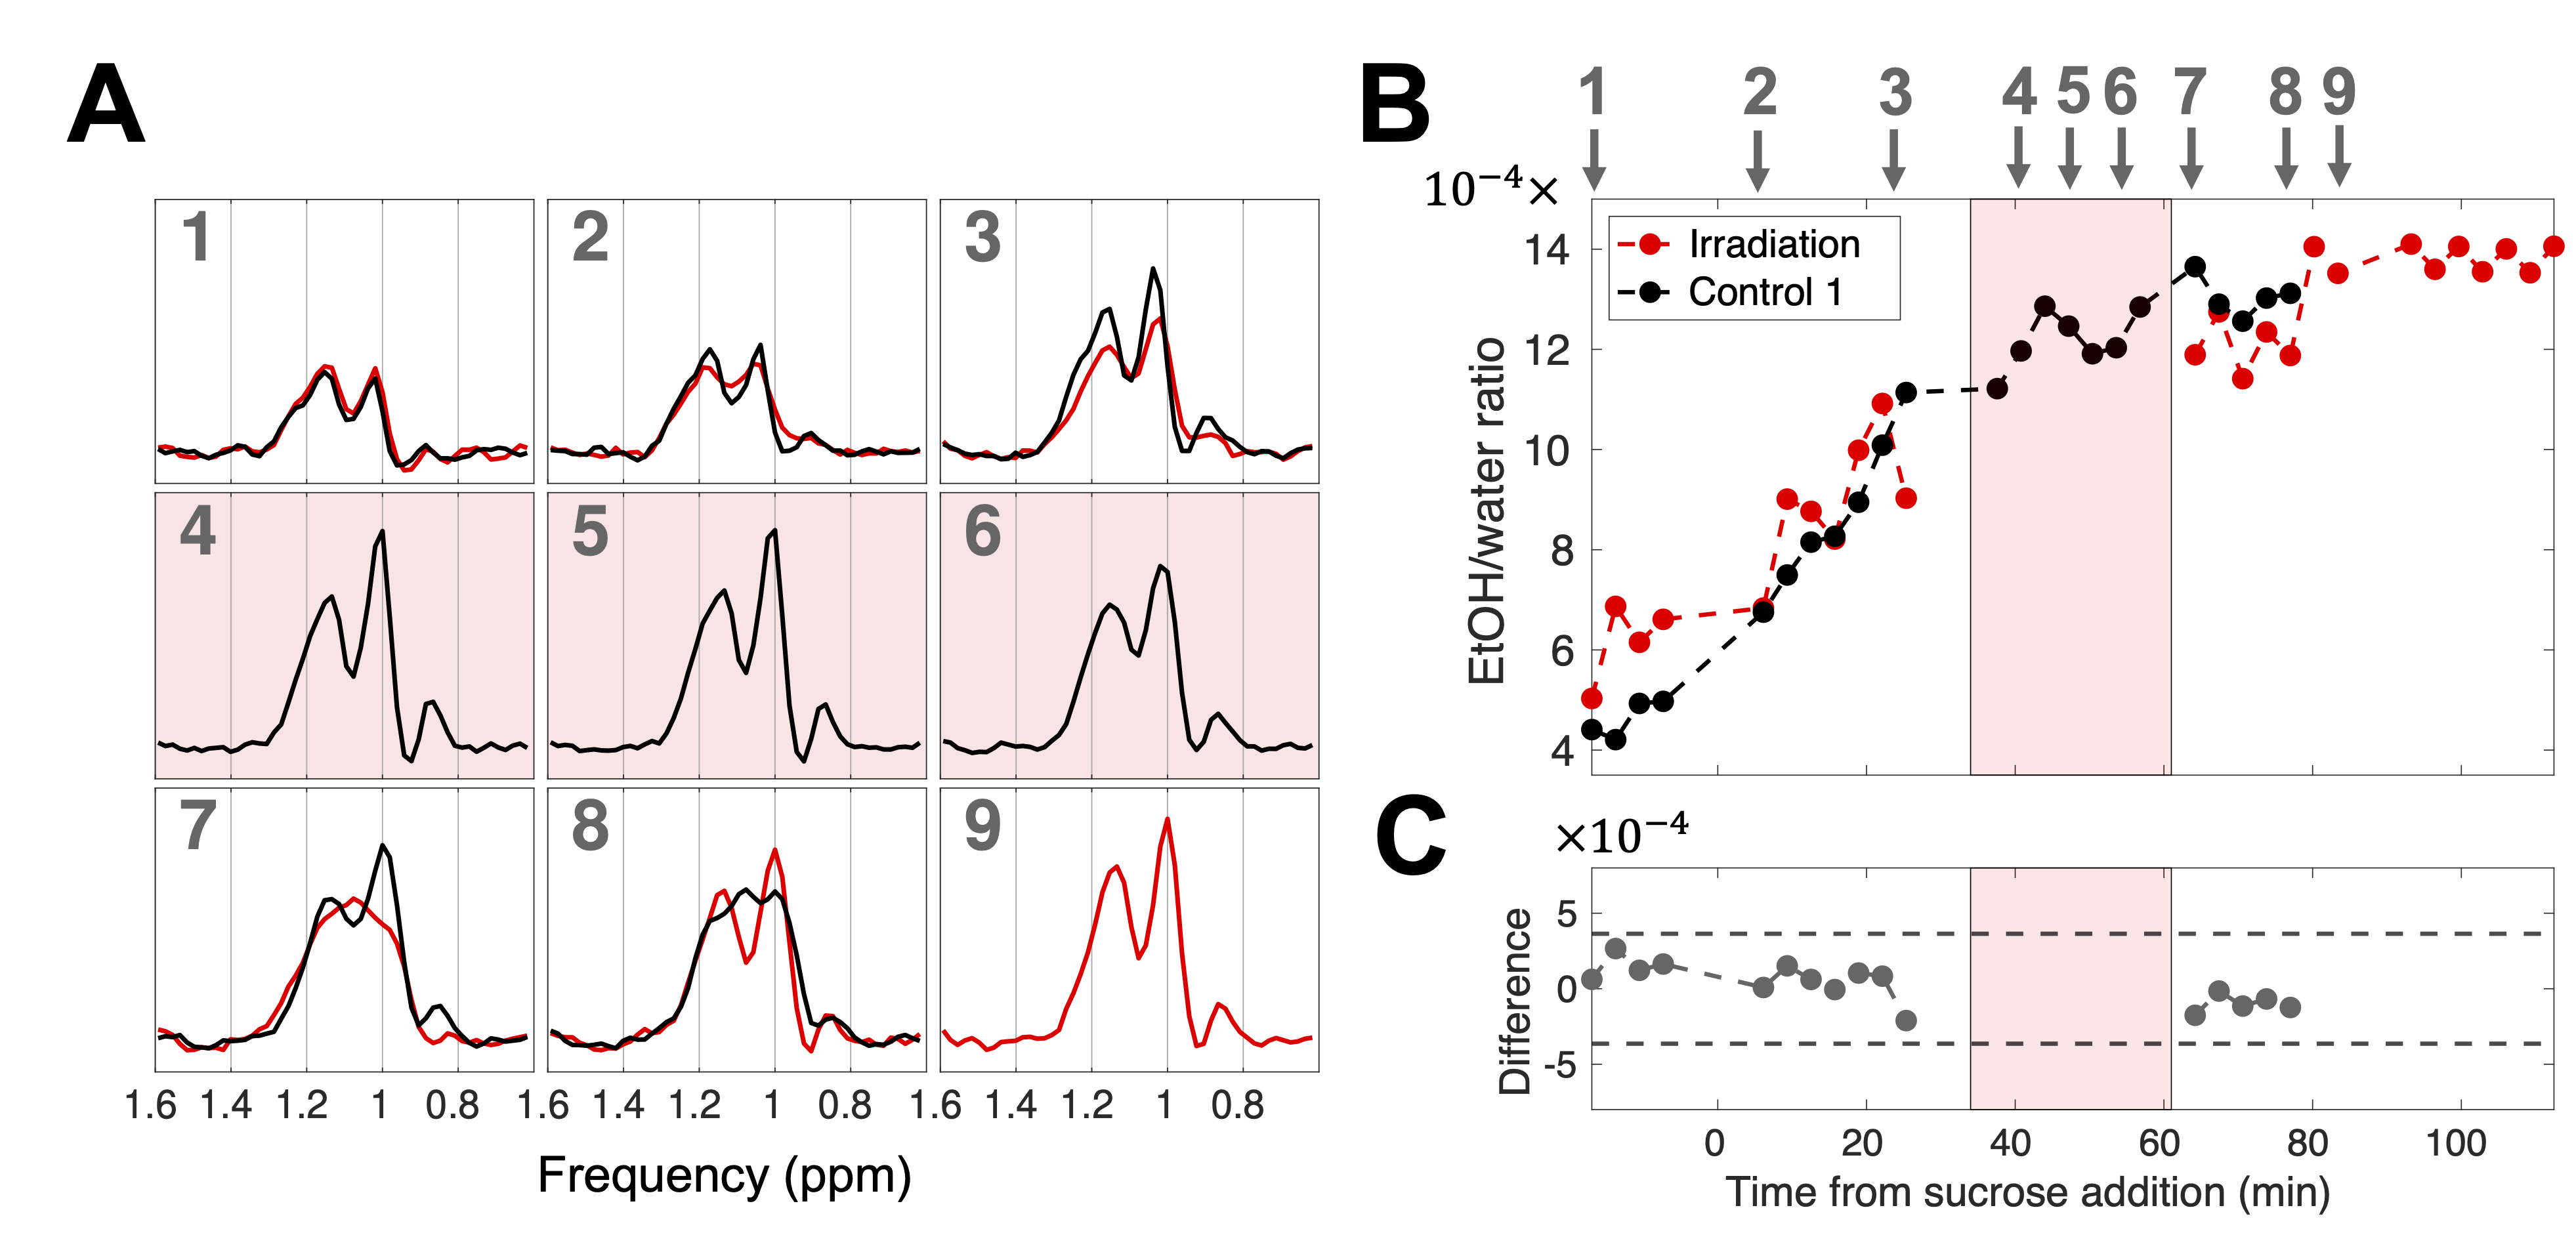
No significant difference was detected in the EtOH/water ratio between experiments Irradiation and Control 1 (Figure 4).
During irradiation, the Larmor frequency of water drifted to 5.20 ppm with an exponential decay constant of $$$\tau = 5.2$$$ minutes, from its mean pre-beam value of 4.68 ppm (Figure 5). After beam-off, the frequency returned to its baseline value within 1.6 minutes.
Discussion
The production of ethanol from yeast fermentation can be detected with dynamic spectroscopy on a 1.5T MR-Linac. We measured no difference in ethanol production between irradiated and untreated yeast within 20 minutes of irradiation with 10,000 MUs (<100 Gy). Increased dose may be necessary, as the median lethal dose could be 600 Gy14. MRS sensitivity to radiation-induced effects could also be improved by minimizing fermentation-produced carbon dioxide in the PRESS voxel and increasing initial sucrose concentration.Irradiation caused a drift in Larmor frequency (Figure 5). This finding contrasts with previous literature reporting that irradiation has minimal effect on image quality (despite signal bursts)15 or apparent diffusion coefficient measurements16. Possibly, radiation-induced currents in the shim coils affect the main magnetic field, although this phenomenon has only been reported in RF coils15,17,18.
Conclusions
These were the first 1H MR spectroscopy experiments reported on a 1.5T MR-Linac. Dynamic MRS on an MR-Linac can measure the production of ethanol during yeast fermentation. Experiments to detect radiation-induced modifications of metabolism are feasible.Acknowledgements
We thank the MR-Linac radiation therapists Shawn Binda, Danny Yu, Renée Christiani, and Anne Carty for assistance with scanning. Dr. Brige Chugh provided helpful feedback on the experimental design. We gratefully acknowledge funding from the Natural Sciences and Engineering Research Council and Canadian Institutes of Health Research.References
1. Liimatainen TJ, Erkkilä AT, Valonen P, et al. 1H MR spectroscopic imaging of phospholipase-mediated membrane lipid release in apoptotic rat glioma in vivo. Magn Reson Med. 2008;59(6):1232-1238. doi:10.1002/mrm.21607
2. Hakumäki JM, Poptani H, Sandmair AM, Ylä-Herttuala S, Kauppinen RA. 1H MRS detects polyunsaturated fatty acid accumulation during gene therapy of glioma: Implications for the in vivo detection of apoptosis. Nat Med. 1999;5(11):1323-1327. doi:10.1038/15279
3. Lehtimäki KK, Valonen PK, Griffin JL, et al. Metabolite Changes in BT4C Rat Gliomas Undergoing Ganciclovir-Thymidine Kinase Gene Therapy-induced Programmed Cell Death as Studied by 1H NMR Spectroscopy in Vivo, ex Vivo, and in Vitro. J Biol Chem. 2003;278(46):45915-45923. doi:10.1074/jbc.M306209200
4. Wald LL, Nelson SJ, Day MR, et al. Serial proton magnetic resonance spectroscopy imaging of glioblastoma multiforme after brachytherapy. J Neurosurg. 1997;87(4):525-534. doi:10.3171/jns.1997.87.4.0525
5. Airoldi C, Tripodi F, Guzzi C, Nicastro R, Coccetti P. NMR analysis of budding yeast metabolomics: a rapid method for sample preparation. Mol Biosyst. 2015;11(2):379-383. doi:10.1039/C4MB00452C
6. Campbell-Burk SL, Shulman RG. High-Resolution NMR Studies of Saccharomyces Cerevisiae. Annu Rev Microbiol. 1987;41(1):595-616. doi:10.1146/annurev.mi.41.100187.003115
7. Salari R, Salari R. Investigation of the Best Saccharomyces cerevisiae Growth Condition. Electron Physician. 2017;9(1):3592-3597. doi:10.19082/3592
8. Rodgers CT, Robson MD. Receive array magnetic resonance spectroscopy: Whitened singular value decomposition (WSVD) gives optimal Bayesian solution. Magn Reson Med. 2010;63(4):881-891. doi:10.1002/mrm.22230
9. Near J, Edden R, Evans CJ, Paquin R, Harris A, Jezzard P. Frequency and phase drift correction of magnetic resonance spectroscopy data by spectral registration in the time domain: MRS Drift Correction Using Spectral Registration. Magn Reson Med. 2015;73(1):44-50. doi:10.1002/mrm.25094
10. Clarke WT, Stagg CJ, Jbabdi S. FSL‐MRS: An end‐to‐end spectroscopy analysis package. Magn Reson Med. 2021;85(6):2950-2964. doi:10.1002/mrm.28630
11. Alba-Lois L, Segal-Kischinevzky C. Yeast Fermentation and the Making of Beer and Wine. Nat Educ. 2010;3(9):17.
12. Raunig DL, McShane LM, Pennello G, et al. Quantitative imaging biomarkers: A review of statistical methods for technical performance assessment. Stat Methods Med Res. 2015;24(1):27-67. doi:10.1177/0962280214537344
13. Shukla‐Dave A, Obuchowski NA, Chenevert TL, et al. Quantitative imaging biomarkers alliance (QIBA) recommendations for improved precision of DWI and DCE‐MRI derived biomarkers in multicenter oncology trials. J Magn Reson Imaging. 2019;49(7):e101-e121. doi:10.1002/jmri.26518
14. Petin VG, Berdnikova IP. Responses of Yeast Cells to Heat Applied Alone or Combined with Gamma-rays. Int J Radiat Biol Relat Stud Phys Chem Med. 1981;39(3):281-290. doi:10.1080/09553008114550361
15. Tijssen RHN, Philippens MEP, Paulson ES, et al. MRI commissioning of 1.5T MR-linac systems – a multi-institutional study. Radiother Oncol. 2019;132:114-120. doi:10.1016/j.radonc.2018.12.011
16. Kooreman ES, van Houdt PJ, Keesman R, et al. ADC measurements on the Unity MR-linac – A recommendation on behalf of the Elekta Unity MR-linac consortium. Radiother Oncol. 2020;153:106-113. doi:10.1016/j.radonc.2020.09.046
17. Burke B, Fallone BG, Rathee S. Radiation induced currents in MRI RF coils: application to linac/MRI integration. Phys Med Biol. 2010;55(3):735-746. doi:10.1088/0031-9155/55/3/013
18. Burke B, Wachowicz K, Fallone BG, Rathee S. Effect of radiation induced current on the quality of MR images in an integrated linac-MR system. Med Phys. 2012;39(10):6139-6147. doi:10.1118/1.4752422
Figures