1885
Preliminary Assessment of Gas Exchange Efficiency in Lung Transplant Patients with Multi-breath Xenon Polarization Transfer Contrast Imaging1University of Pennsylvania, Philadelphia, PA, United States
Synopsis
Quantifying the exchange of hyperpolarized xenon gas between the airways, lung parenchyma, and red blood cells may provide valuable insights into the progression of lung graft failure, enabling earlier diagnosis of chronic lung allograft dysfunction (CLAD). By combining Xenon polarization Transfer Contrast (XTC) imaging with a multi-breath model of fractional ventilation, gas exchange efficiency was assessed in four lung transplant recipients 3-12 months post-surgery in order to identify baseline metrics and trends.
Introduction
Lung transplantation outcomes continue to be the poorest among whole organ transplants, primarily due to high rates of graft failure and a lack of treatment options, with chronic lung allograft dysfunction (CLAD) constituting the leading cause of death long-term. However, though treatments options are limited, earlier CLAD diagnosis could help to enable the initiation of therapeutic management prior to irreversible damage occurring. Unlike the current gold standard clinical assessment, spirometry, which cannot provide localized measures of lung function, hyperpolarized xenon-129 (HXe) MRI, and Xenon polarization Transfer Contrast (XTC) in particular, is capable of quantifying regional gas uptake and exchange, and thus may be more sensitive to early restrictive or obstructive changes associated with CLAD. High-resolution maps of exchange between gas-phase (GP) xenon and xenon dissolved in the tissue/plasma (TP) or red blood cells (RBC) can be calculated from the subsequent loss of GP signal after selective saturation of the desired dissolved-phase (DP) component1, and when combined with local measures of gas volume, represent voxel-wise exchange efficiency, XTP,RBC. In this work, we longitudinally imaged lung transplant recipients 3-12 months after surgery in order to establish baseline XTP,RBC metrics and trends.Methods
With Institutional Review Board (IRB) approval, 2 lung transplant recipients were imaged 3, 6, and 12 months post-transplant, while another 2 subjects were imaged at 3- and 6-month timepoints. Pulmonary function tests (PFTs) were performed the day of imaging, with baseline results derived from the average of the two highest post-transplant FEV1s, as shown in Table 1. A 1.5T scanner (Magnetom Avanto, Siemens) with a flexible 8-channel xenon-129 chest coil (Stark Contrast, Germany) was used for all studies, and a prototype commercial system (XeBox-E10, Xemed LLC, NH) was used to polarize 87% enriched xenon-129.Imaging was performed at end-exhalation using a multi-breath XTC technique consisting of three repeated schemes of 6 wash-in breaths of a HXe mixture and 4 normoxic wash-out breaths with and without saturation of either TP or RBC resonances. The gas mixture consisted of 50 mL HXe supplemented by room air. To maintain consistency throughout imaging, breathing rates and tidal volumes were guided by a coordinator, and inhale and exhale flows were recorded to account for any variations in breathing. Images were acquired via a 3D stack-of-spirals sequence, while TP and RBC saturations consisted of 20 and 40 Gaussian RF pulses, respectively, with a flip angle of 180°, pulse length of 8 ms, and TRsat of 30 ms. Other imaging parameters included: flip angle of 4°, TR/TE = 7.68/0.84 ms, 11 interleaves with 5.12 ms readouts, matrix size = 80x80x8, and FOV = 350x350x200 mm3. The flow measurements, along with the no-saturation, RBC-saturation, and TP-saturation images, were fit voxel-wise to a modified fractional ventilation (FV) model2 to generate maps of tidal volume (TV), functional residual capacity (FRC), FV, and depolarization-per-pulse of TP and RBC (fTP and fRBC). As shown in the equation below, maps for assessing TP and RBC exchange efficiency (XTP and XRBC) were calculated by scaling fTP and fRBC with FRC, the volume of gas at end-exhalation.
$$X_{TP,RBC} = \frac{1 - f_{TP,RBC}}{TR_{sat}} * FRC$$
Results and Discussion
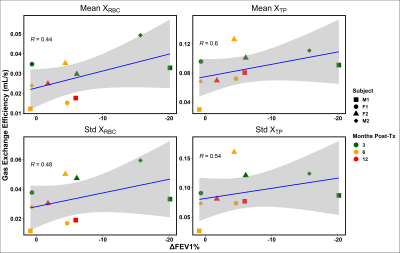
Figure 1 shows representative TV, FRC, FV, XRBC and XTP maps in subject M1 3 months post-transplant. The maps’ fairly homogenous distributions within each slice and lack of apparent ventilation defects are surprisingly consistent with healthy values, despite an approximately 20% lower FEV1 vs. baseline (61.9% vs 77.5%). When compared longitudinally and with the other subjects, however, a slight trend appears between the mean and standard deviation of the gas exchange efficiency maps and % change in FEV1, as illustrated in Figure 2. For almost every subject, FEV1 improved or remained relatively constant between 3 and 6 months post-transplant, and was associated with decreased average gas exchange per voxel and increased homogeneity, perhaps revealing adjustment to a new baseline or return to a previous ‘normal’. F1 was the only subject to exhibit a decrease in FEV1 from month 3 to month 6, although it is yet to be seen whether this is an indication of lung function decline or a difference in sensitivity compared with the HXe metrics, as ‘healthy’ patients tend to show improvement in FEV1 over the first post-transplant year3. Additionally, despite the significantly larger decline in FEV1 at 3 months for the two male patients compared to the female patients, the mean and standard deviations of XTP and XRBC were similar.Conclusion
Multi-breath XTC imaging was performed longitudinally in four recent lung allograft recipients to establish baseline gas exchange efficiency metrics and identify early correlations with spirometry.Acknowledgements
No acknowledgement found.References
[1] Amzajerdian, Faraz, et al (2020). Measuring pulmonary gas exchange using compartment‐selective xenon‐polarization transfer contrast (XTC) MRI. MRM 85(5), 2709-2722.
[2] Hamedani, Hooman, et al (2016). Regional fractional ventilation by using multibreath wash-in 3He MR imaging. Radiology 279(3), 917-924.
[3] Mason, David P., et al (2012). Effect of changes in postoperative spirometry on survival after lung transplantation. The Journal of Thoracic and Cardiovascular Surgery, 144(1), 197-203.e2.
Figures


