1875
Uncertainty quantification for ground-truth free evaluation of deep learning reconstructions1Department of Biomedical Magnetic Resonance, Otto von Guericke University Magdeburg, Magdeburg, Germany, 2Data and Knowledge Engineering Group, Otto von Guericke University Magdeburg, Magdeburg, Germany, 3Faculty of Computer Science, Otto von Guericke University Magdeburg, Magdeburg, Germany, 4MedDigit, Department of Neurology, Medical Faculty, University Hospital, Magdeburg, Germany, 5Center for Behavioral Brain Sciences, Magdeburg, Germany, 6German Centre for NeurodegenerativeDiseases, Magdeburg, Germany, 7Leibniz Institute for Neurobiology, Magdeburg, Germany
Synopsis
Many deep learning-based techniques have been proposed in recent years to reconstruct undersampled MRI – showing their potential for shortening the acquisition time. Before using them in actual practice, they are usually evaluated by comparing their results against the available ground-truth – which is not available during real applications. This research shows the potential of using uncertainty estimation to evaluate the reconstructions without using any ground-truth images. The method has been evaluated for the task of super-resolution MRI, for acceleration factors ranging from two to four – in all three dimensions.
Introduction
Deep learning-based techniques have become an integral part of medical image processing research: from image analysis (classification, segmentation) to image reconstruction (artefact reduction, super-resolution). However, most of the time, the internal working mechanism of such models are unknown – the black-box problem of deep learning – creates scepticism among clinicians1. Hence, the models are typically evaluated by comparing their output with the corresponding ground-truth. As the models are black-box in nature, evaluations on large test datasets with as many use-case scenarios as possible are performed to check the model’s stability, generalisability, and applicability in clinical scenarios. Nevertheless, when used in clinical practice, there is no available ground-truth to compare and evaluate the predictions. Uncertainty quantification2 is a possible solution: assessing the quality of prediction without comparing it against any ground-truth.One of the systematic methods for evaluating deep learning-based image reconstruction models, such as super-resolution models, is creating a difference image by subtracting the predicted image from the ground-truth, to understand through visual inspection which regions of the image have been mispredicted by the network. This work performs a ground-truth-less evaluation of super-resolution methods, with the help of uncertainty quantification.
Methods
Network Models and TrainingIn this research, three deep learning super-resolution models were included: RRDB (Residual-in-Residual Dense Block, the generator of ESRGAN3), UNet4,5, and UNetMSS6. The training and inference were performed using 3D patches, with a patch-size of 643. During training for each epoch, 60 patches were randomly taken from each volume. The loss was calculated using SSIM7 and was minimised using the Adam optimiser with an initial learning rate of 0.001 for 50 epochs.
Uncertainty Mapping Pipeline
An auxiliary system with uncertainty modelling was built to be applied on a trained model by adding infer-dropouts inside the models during inference8. In the RRDB models, the dropouts were placed at the end of each residual dense block. In the case of UNet and UNetMSS, dropouts were added in five locations: after each contraction-path and expansion-path block. The hyperparameters, i.e. dropout rates, were the same across all these locations. The different dropout rates used were {0.01,0.02,0.05,0.1,0.2,0.5}. Initially, the model predictions are generated from low-resolution images using the trained model weights but with different dropout rates. Then, the final uncertainty map is the pixel-wise variance across all these generated images.
Data
The IXI dataset9 was used for this research. The MRIs from the dataset were considered as fully-sampled high-resolution images and were artificially downsampled to generate the low-resolution images, with factors of {2,2.5,3,3.5,4} in all three dimensions, resulting in theoretical acceleration factors of 8,16,27,43, and 64. Different trainings and evaluations were performed for T1w and T2w images, and in both cases, the dataset was split into training:validation:testing with a ratio of 70:12:18
Results
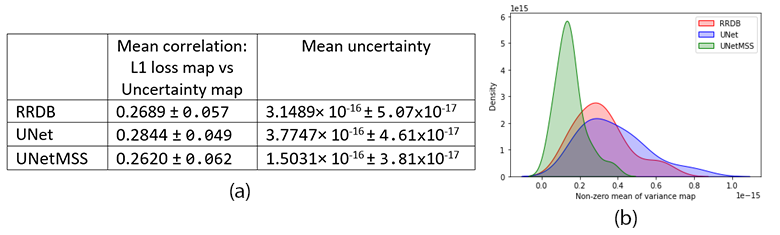
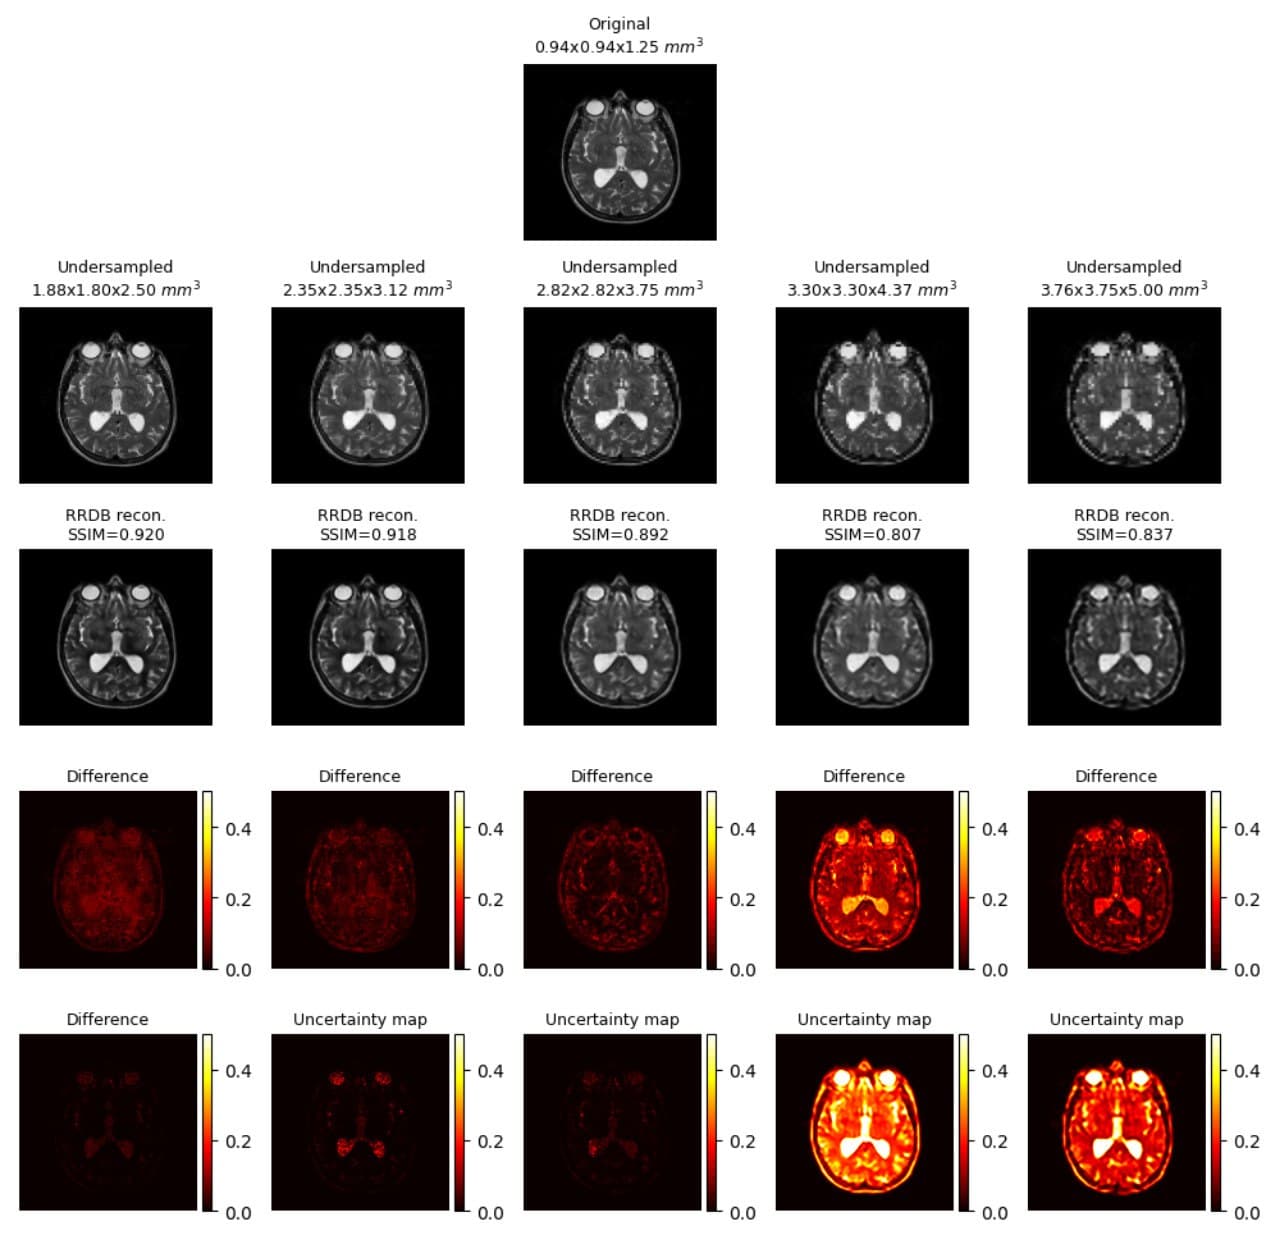
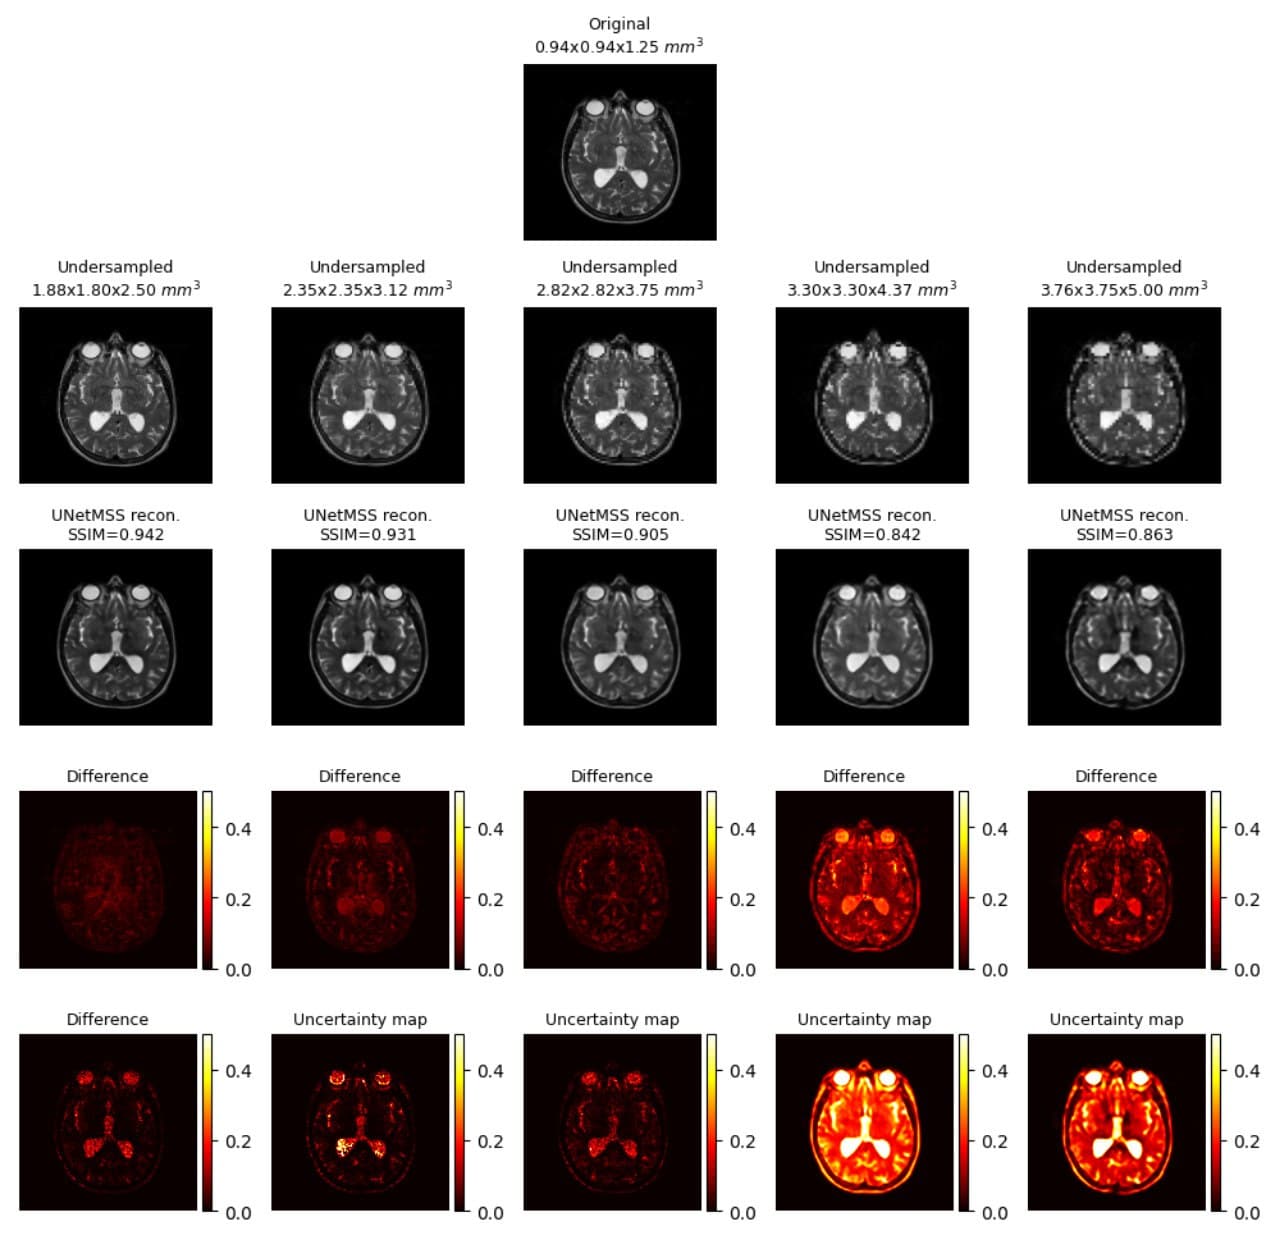
Generated uncertainty maps were evaluated by computing the correlation with the L1 loss maps, shown in Fig.1.a. The same table also shows the mean uncertainty of the models. The mean-variance map for the uncertainty is shown in Fig.1.b with the help of a kernel density estimate plot. It can be observed from the quantitative evaluation that the mean correlation of the UNet model was the highest, whereas the mean uncertainty was the lowest for the UNetMSS model. Moreover, Fig.2-4 show the qualitative results for different models and acceleration factors.Discussion
From the resultant SSIMs (shown in Fig.2-4) and the difference images, it can be said the performance of the models for theoretical acceleration factors of 43 and 64 (undersampling with factors of 3.5 and 4 respectively in all three dimensions) are not good - can not be trusted for real applications - a finding which is also corroborated by the uncertainty maps. The uncertainty maps show good reliability for the other three acceleration factors, as also suggested by the SSIM values (>0.90) - they show the theoretical acceleration factor of 27 (3 in all three dimensions) as the upper-limit in terms of undersampling for these super-resolution models. Even though the difference images and the uncertainty maps do not point to the exact locations in most cases, they agree in terms of overall image quality. Another notable observation was that all three models were uncertain about the structures containing liquids, like cerebrospinal fluid and eyes - warrants further investigation. Finally, for comparison of the three models in terms of uncertainty, this is to be noted that the dropouts placed in the UNet and UNetMSS models are different from those in RRDB - making the results not totally comparable. However, the KDE plot (Fig.1.a) revealed that the distribution was similar for UNet and RRDB, and UNetMSS is better in terms of overall uncertainty. As the dropouts were identical in UNet and UNetMSS, it can be concluded that introducing multi-scale supervision also reduces the uncertainty of the model.Conclusion
This research explores the possibility of evaluating super-resolution results of deep learning-based methods without any available ground-truth with the help of uncertainty quantification. The method was evaluated for the task of super-resolution MRI using UNet, UNetMSS, and RRDB models, for different levels of accelerations ranging from two to four in all three dimensions. The visual comparisons showed the potential of using such techniques for ground-truth free evaluation of super-resolution results.Acknowledgements
This work was in part conducted within the context of the International Graduate School MEMoRIAL at OvGU (project no. ZS/2016/08/80646) and supported by the federal state of Saxony-Anhalt (“I 88”).References
[1] Chatterjee, Soumick, et al. "TorchEsegeta: Framework for Interpretability and Explainability of Image-based Deep Learning Models." arXiv preprint arXiv:2110.08429 (2021).
[2] Abdar, Moloud, et al. “A review of uncertainty quantification in deep learning: Techniques, applications and challenges”. Information Fusion. Elsevier, 2021.
[3] Wang, Xintao, et al. "Esrgan: Enhanced super-resolution generative adversarial networks." Proceedings of the European conference on computer vision (ECCV) workshops. 2018.
[4] Çiçek, Özgün, et al. "3D U-Net: learning dense volumetric segmentation from sparse annotation." International conference on medical image computing and computer-assisted intervention. Springer, Cham, 2016.
[5] Sarasaen, Chompunuch, et al. "Fine-tuning deep learning model parameters for improved super-resolution of dynamic MRI with prior-knowledge." arXiv preprint arXiv:2102.02711 (2021).
[6] Zeng, Guodong, et al. "3D U-net with multi-level deep supervision: fully automatic segmentation of proximal femur in 3D MR images." International workshop on machine learning in medical imaging. Springer, Cham, 2017.
[7] Wang, Zhou, et al. "Image quality assessment: from error visibility to structural similarity." IEEE Transactions on Image Processing, vol. 13, no. 4 (2004): 600-612.
[8] Gal, Yarin, and Zoubin Ghahramani. "Dropout as a bayesian approximation: Representing model uncertainty in deep learning." international conference on machine learning. PMLR, 2016.
[9] IXI Dataset by brain-development.org. URL: https://brain-development.org/ixi-dataset/
Figures