1873
Benchmarking Accelerated MRI: A Head-to-Head Comparison of Deep Learning Reconstruction and Super-Resolution Techniques1Department of Electrical and Computer Engineering, Weber State University, Ogden, UT, United States, 2Lvis Corporation, Palo Alto, CA, United States, 3Department of Electrical Engineering, Stanford University, Stanford, CA, United States, 4Department of Radiology, Stanford University, Stanford, CA, United States
Synopsis
Deep-learning (DL) can be used to extend compressed sensing (CS) to learn the regularization function in a data-driven manner. In contrast, super resolution (SR) algorithms have been used to transform rapidly-acquired low-resolution images into higher-resolution images. This work compares DL-CS with DL-SR for accelerated MRI on a test dataset of 50 patients with conventional image quality metrics and clinically-relevant quantitative T2 relaxation measurements. We demonstrate that DLCS approaches outperform DLSR approaches for accelerated MRI.
Introduction
Deep-learning (DL) has been used in research studies for accelerated MR imaging, with two varying approaches. One approach extends compressed sensing (CS) with DL to learn the regularization function in a data-driven manner. The other uses low-quality to high-quality image-to-image translations, with an example of transforming rapidly-acquired low-resolution images into higher-resolution using super-resolution (SR) algorithms. However, no systematic comparison has been performed to compare DL-CS with DL-SR for accelerated MRI. Here, we benchmark these two methods on a test dataset of 50 patients with conventional image quality metrics and clinically-relevant quantitative T2 relaxation measurements.Methods
Imaging data were acquired with informed consent and IRB approval from 225 subjects (119 male, age:44±18, weight: 78±19kg) undergoing a diagnostic knee MRI scan. A 3D quantitative double-echo in steady-state (qDESS) sequence was added to their 3T imaging protocol (parameters: matrix=416×512, field-of-view=16×16cm, slice thickness=1.6cm, TE/TR=5.7/17.9ms, bandwidth=±32.5kHz, scan time=5mins). The qDESS scan was also used to calculate the quantitative T2 relaxation time maps according to prior validated1. qDESS images were acquired with 2×1 parallel imaging, which maintained adequate diagnostic quality. Fully-sampled k-space data was synthesized using autocalibrating reconstruction with Cartesian imaging, which served as the ground truth.CS sparsely samples data across the entire k-space producing images with incoherent aliasing artifacts while SR densely samples the center of k-space producing low-resolution images (Fig. 1). We compared 3x, 6x, and 8x accelerations. For both DLCS and DLSR reconstructions, undersampling was performed in the phase (ky) and slice dimensions (kz). For CS sampling, a 16×16 autocalibration region was fully sampled along with random 2D uniform k-space sampling2. For the SR sampling, the phase and slice dimensions were down-sampled to a low-frequency center3. Both methods generated input images using zero-filling (ZF) with inverse Fourier transforms and coil sensitivity maps. Since undersampling was performed in (ky-kz), 416 slices were available per patient.
Data was split by patient between training (132 scans, 50,000+ slices), validation (45 scans, 18,000+ slices), and testing (50 scans, 20,000+ slices) sets. DLCS reconstruction followed prior validated procedures and used 3D ResNet proximal blocks with 3 slices each2. Two state-of-the-art DLSR algorithms (Very Deep SR [VDSR]3, and Enhanced Deep SR [EDSR]4 were used to perform patch-wise training with 32×32×32 blocks.
Quantitative benchmarks were computed with traditional image quality metrics of peak signal-to-noise ratio (PSNR) and structural similarity (SSIM) of the inferred images against the ground-truth images. Image blurring averaged in the y-z dimension was quantified using the blur metric as described previously5 and statistical comparisons were conducted with Kruskal-Wallis tests and Dunn posthoc tests.
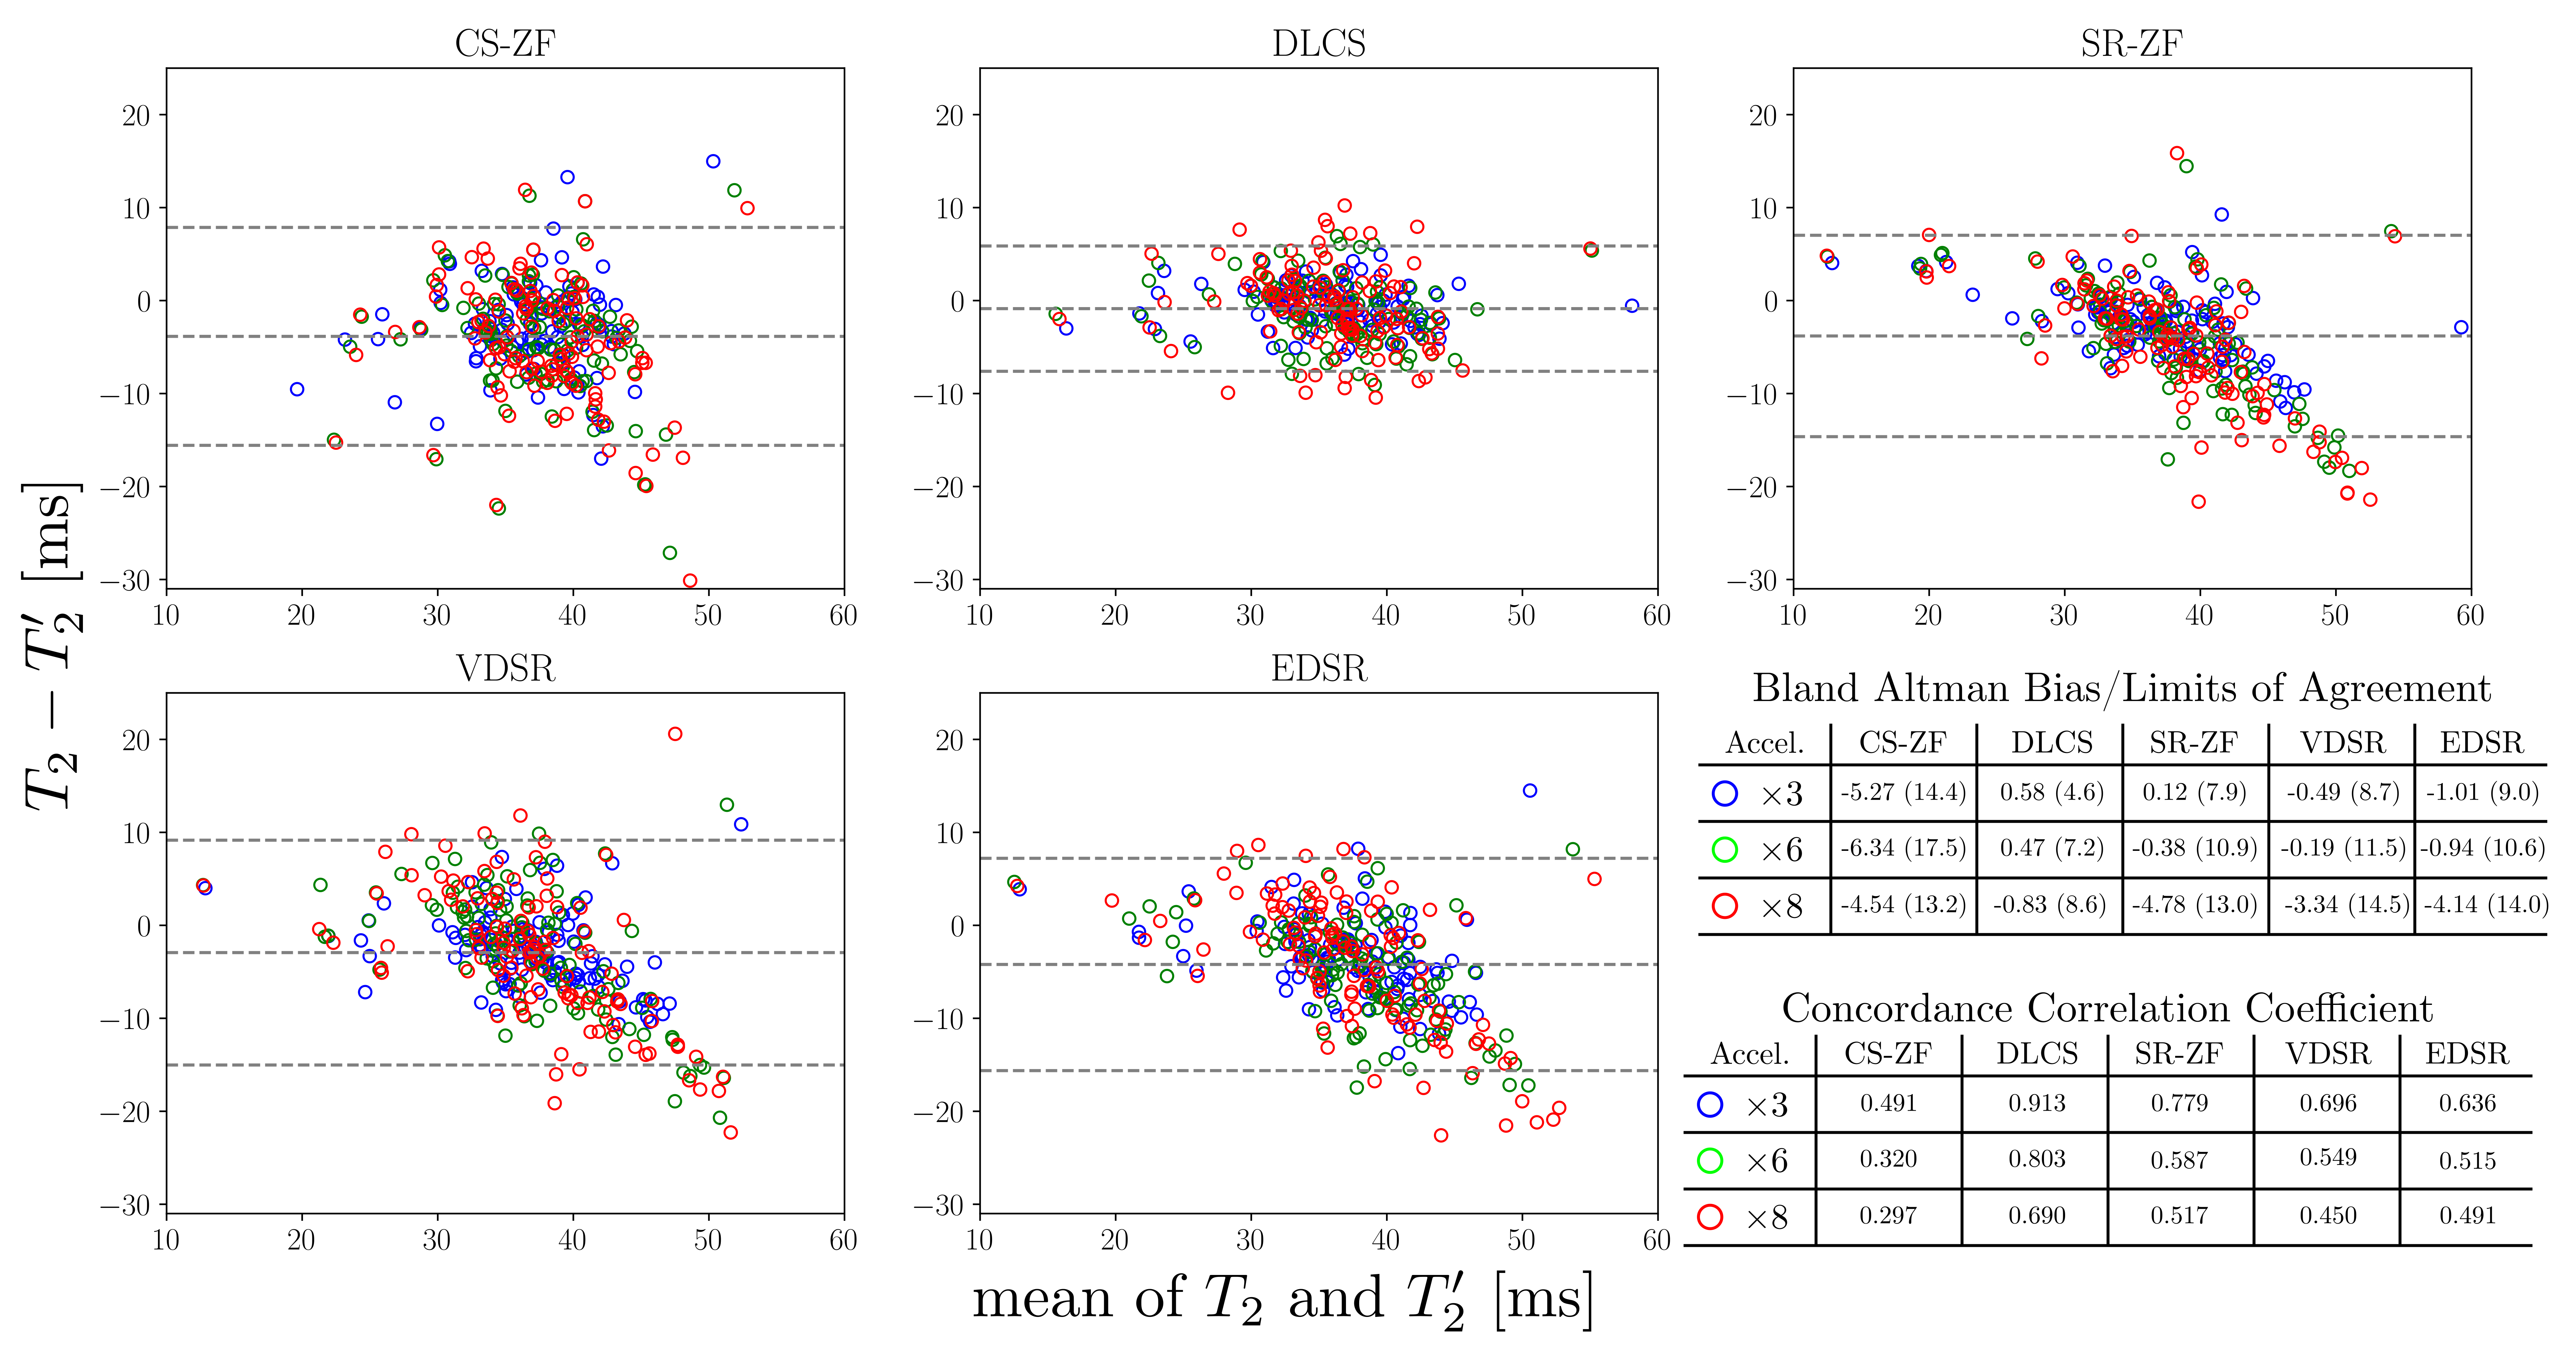
Manual segmentations for femoral, tibial, and patellar cartilage were performed on all test-set images to compute tissue-specific cartilage T2 values in the inferred and ground-truth images. Bland-Altman plots, concordance correlation coefficients, and student’s t-test were computed to assess systematic differences in T2 values compared to the reference.
Results
Axial and sagittal multi-planar reformations for all reconstruction methods in a patient with an arthroscopically-confirmed full-thickness chondral lesion and a meniscus tear show that these pathologies can be seen clearly in the DLCS, VDSR, and EDSR reconstructions (Fig. 2). The DLCS images were the most visually appealing across the three reconstructions and two ZF initializations for all accelerations and image orientations.The conventional image quality metrics of PSNR and SSIM for the two qDESS echoes and different reconstruction methods (Fig. 3) showed that reconstruction performance degraded as the accelerations increased. The DLCS, VDSR, and EDSR methods were comparable for the first qDESS echo that has a higher baseline SNR but DLCS had slightly degraded SSIM compared to VDSR and EDSR. In contrast, the blur metric demonstrated that DLCS had significantly lower blurring (sharpest images) compared to both the SR methods at all accelerations (p<0.001). The DLCS blurring rivaled that of the ground-truth images.
While VDSR and EDSR produced comparable PSNR and SSIM values as DLCS, they produced error offsets in T2 values (Fig. 4). DLCS had the lowest Bland-Altman bias and limits-of-agreement, and the highest concordance correlations coefficients (0.7+), amongst all accelerations and reconstruction methods. Unlike DLCS, both VDSR and EDSR had significantly biased T2 values for all accelerations (p<0.05).
Discussion
The data presented here demonstrate the DLCS reconstruction outperforms state-of-the-art VDSR and EDSR reconstruction techniques based on visual inspection, evaluation of the blurring metrics, and lack of biases in cartilage T2 values. We surmise that enforcing data consistency in DLCS maintains T2 accuracy while the SR zero-filled images already have large T2 biases.When comparing the reconstructions using conventional metrics such as PSNR and SSIM, DLCS had comparable or slightly worse metrics. However, these metrics were created for natural images and have been shown to inadequately depict true MRI quality and diagnostic utility6. Thus using such image-level quality metrics along with clinically-relevant metrics such as blurring and T2 relaxation that assesses pixel-level parametric accuracy may provide improved methods for evaluating true reconstruction quality.
Conclusion
Using a combination of conventional image quality metrics, blurring metrics, and clinically-relevant quantitative parameter maps, we demonstrate that DLCS approaches outperform DLSR approaches for accelerated MRI.Acknowledgements
Funding from: R01 AR077604, R01 EB002524, and K24 AR062068 from the NIH; the Precision Health and Integrated Diagnostics (PHIND) Seed Grant from Stanford University; Philips, GE Healthcare.References
[1] Sveinsson, B., et al. "A simple analytic method for estimating T2 in the knee from DESS." Magnetic Resonance Imaging 38 (2017): 63-70.
[2] Sandino, Christopher M., et al. "Compressed sensing: From research to clinical practice with deep neural networks: Shortening scan times for magnetic resonance imaging." IEEE Signal Processing Magazine 37.1 (2020): 117-127.
[3] Chaudhari, Akshay S., et al. "Super-resolution musculoskeletal MRI using deep learning." Magnetic Resonance in Medicine 80.5 (2018): 2139-2154.
[4] Lim, Bee, et al. "Enhanced deep residual networks for single image super-resolution." Proceedings of the IEEE Conference on Computer Vision and Pattern Recognition Workshops. 2017.
[5] Chaudhari, Akshay S., et al. "Utility of deep learning super‐resolution in the context of osteoarthritis MRI biomarkers." Journal of Magnetic Resonance Imaging 51.3 (2020): 768-779.
[6] Knoll, Florian, et al. "Advancing machine learning for MR image reconstruction with an open competition: Overview of the 2019 fastMRI challenge." Magnetic Resonance in Medicine 84.6 (2020): 3054-3070.
Figures