1868
Pressure Pain Activation Revealed in Simultaneous Brain, High-Res Brainstem, and High-Res Spinal Cord fMRI.1Stanford University, Stanford, CA, United States
Synopsis
We present a novel fMRI acquisition that mitigates susceptibility-induced off-resonance and simultaneously captures brainstem, spinal cord, and brain. Brainstem and spinal cord are imaged in high spatial resolution whereas brain resolution is standard. This fMRI acquisition is applied in a noxious pressure-pain experiment from which we observe activation in brain, spinal cord, and brainstem pons & medulla.
Introduction
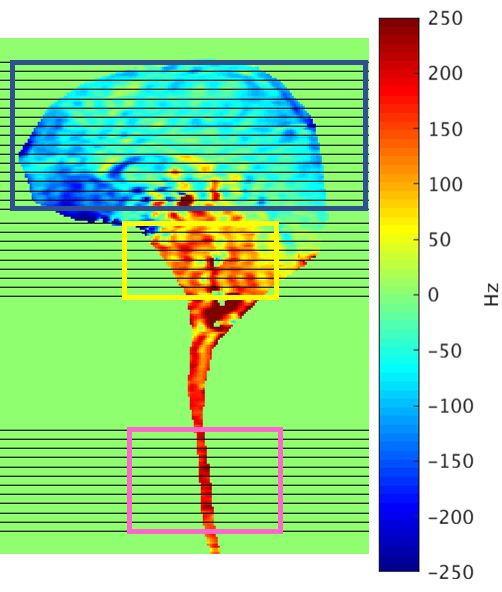
To thoroughly investigate the entire central nervous system, high spatial resolution fMRI is crucial for differentiating brainstem nuclei and spinal cord dorsal and ventral horns. But longer readout duration, required for high resolution, will worsen off-resonance caused by susceptibility-induced field gradients. (Fig.1)We present a novel fMRI acquisition that mitigates susceptibility-induced off-resonance and simultaneously captures brainstem, spinal cord, and brain. Brainstem and spinal cord are imaged in high spatial resolution whereas brain resolution is standard. This fMRI acquisition is applied in a noxious pressure-pain experiment from which we observe activation in brain, spinal cord, and brainstem pons & medulla.
Background
Brainstem is the critical link between cortical brain regions and spinal cord. Nuclei in brainstem, for instance, are relays for transmitting pain signals between spinal cord dorsal horn and various brain regions: amygdala, thalamus, somatosensory, insular, anterior cingulate, prefrontal cortices. Similarly to spinal cord, fMRI of brainstem is challenging due to 1) signal loss from susceptibility-induced field gradients, 2) physiological noise from cardiac & respiratory cycles, 3) small organ size.Methods
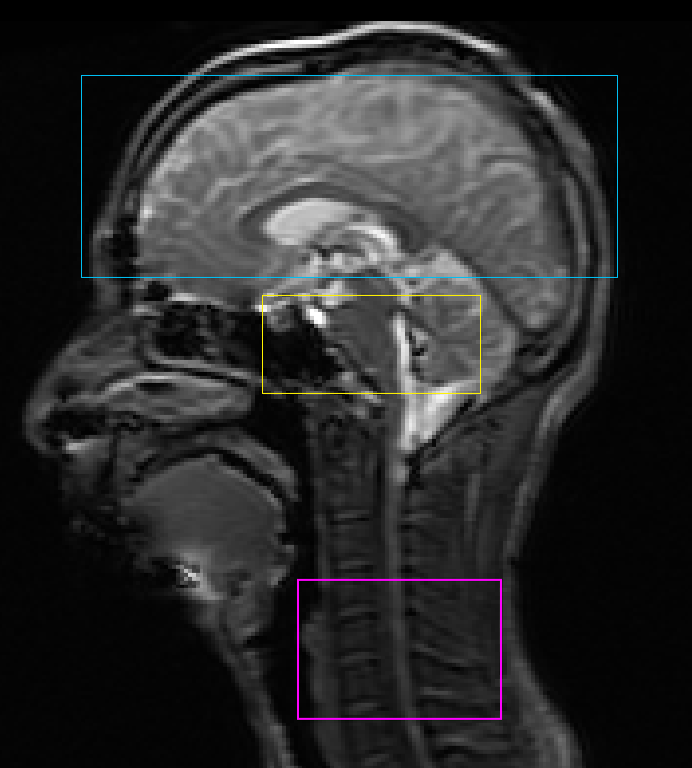
Using a dynamic shimming procedure previously reported [1], that optimizes linear x, y, z shims and center frequency per slice, T2*-weighted images are collected by GE 3T Discovery 750 scanner. fMRI sequence parameters: EPI GRAPPA (R=2), flip angle=80°, FOV for brain/brainstem/spinal cord = 22/8/8cm, matrix=64x64, readout BW=±125 kHz, TE/TR=30ms/2.5s, #slices=38 (17 brain, 9 brainstem, 12 spinal cord centered at C5), slice thickness/spacing=5/0mm (Fig.2). We use slice-select excitation pulse in brain, and echo-planar pulse in brainstem & spinal cord slices.A mechanical pressure pain fMRI experiment is designed to induce activation in brain, brainstem, and spinal cord. Scan duration is 6 minutes during which thirty cycles are repeated. Each cycle consists of 3s on-period and 7s baseline-period. During the on-period, a pneumatically driven device delivers pressure to subject’s left thumbnail at 5.5kg/cm2. Cardiac and respiratory data are collected during scan. High-resolution structural scans are collected for location reference: T1-weighted brain scan, T2-weighted brainstem scan at the same slice locations as the fMRI scan, and T2-weighted spinal cord scan.
Physiological noise is removed from all images via RETROICOR [2]. Images are corrected for slice timing and motion. For spinal cord data, mean CSF signal is removed using custom software. Images are then spatially smoothed: 5×5×5 mm3 FWHM Gaussian kernel for brain, 2×2×2mm3 for brainstem, 2×2×5mm3 for spinal cord. Brain images are spatially normalized to standard MNI152 template space, spinal cord images to PAM50 space.
Activation analysis of each region (brain, brainstem, spinal cord) is carried out separately using FSL FEAT [3]. For each analysis, the stimulus is modeled by the same task waveform: on-period convolved with a double-gamma HRF. Temporal derivative of the task waveform is included in our model to account for possible temporal shifts. Six motion regressors are used to remove their confounds. For spinal cord analysis, motion outliers are also modeled as confounds.
Results
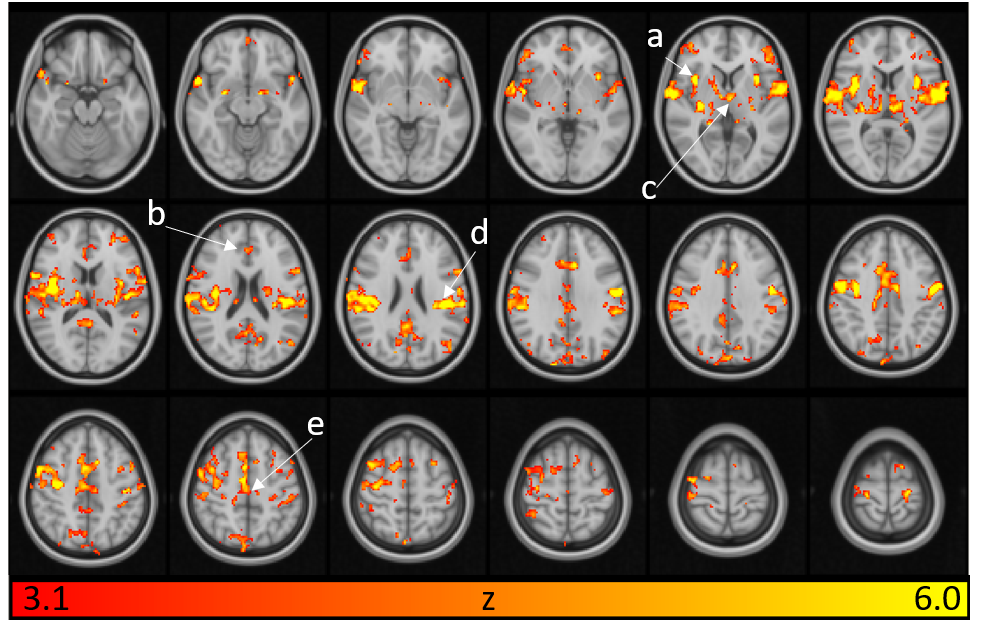
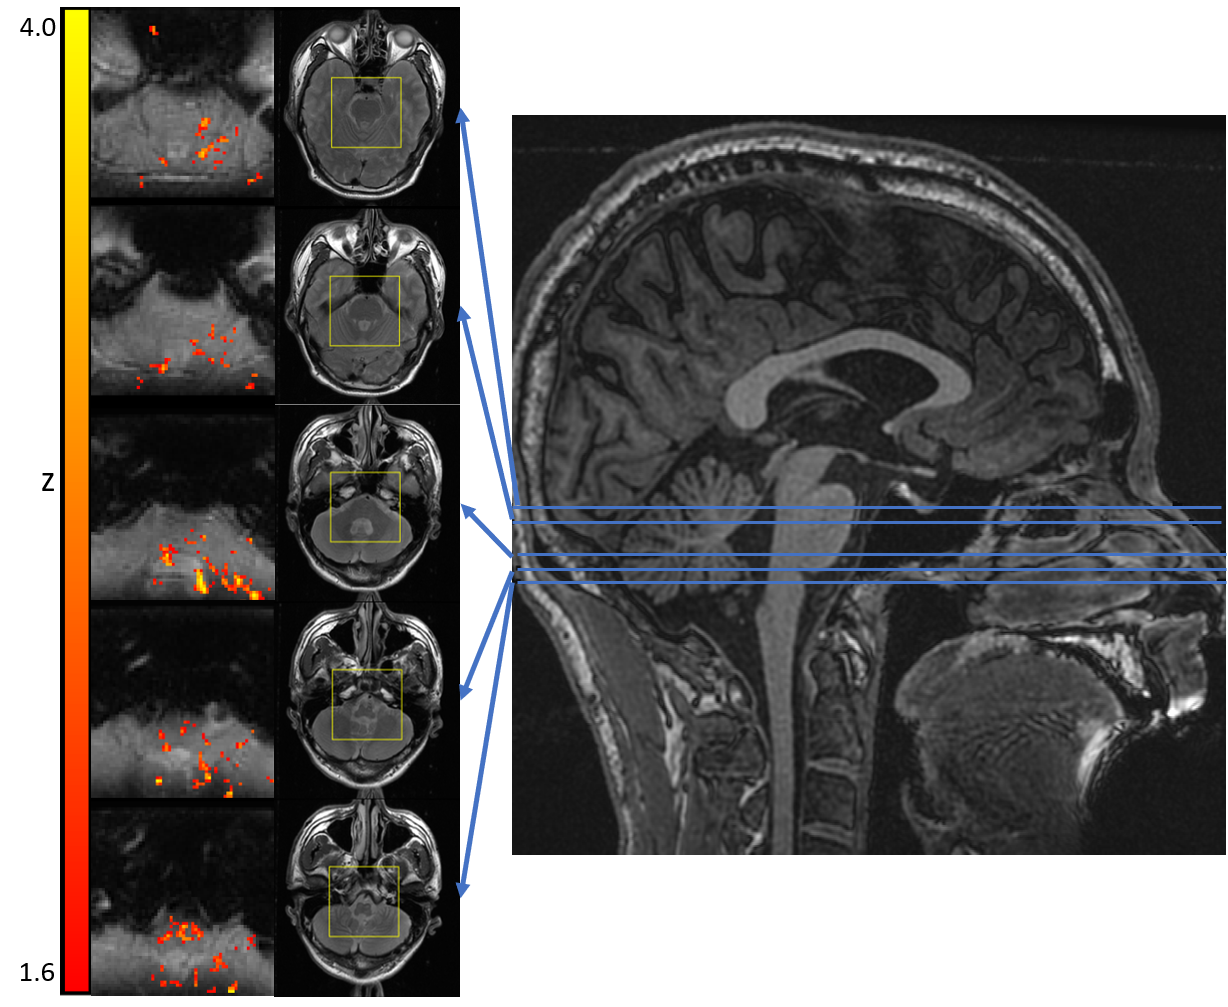
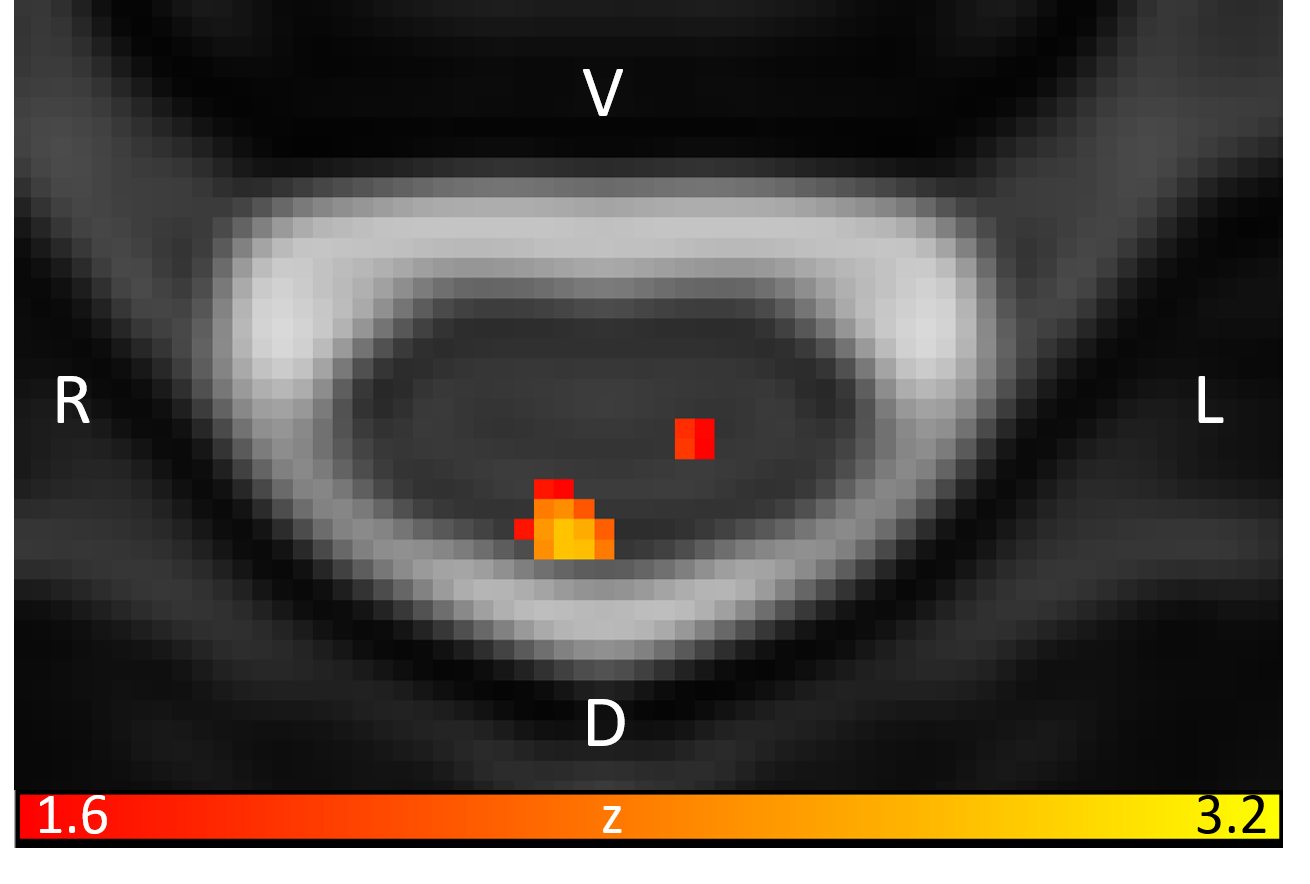
Brain regions that are related to pain processing are activated by mechanical pressure pain (Fig.3). Figure 4 shows brainstem activation, their corresponding axial locations on T2 images, and sagittal locations on a T1 image. Figure 5 shows spinal cord activation in segment level C6 which receives signal from the thumb.Conclusion
Our mechanical pressure pain fMRI results validate feasibility of simultaneous brain, high-res brainstem, and high-res spinal cord neuroimaging.Moving Forward
There are a number of areas that can be optimized to improve image quality: 1) develop local shim coils to improve shimming; to further immunize susceptibility-induced signal dropout and distortion, [4] 2) develop method for co-registration of reduced-FOV brainstem images to standard template, 3) cardiac or respiratory gated acquisition to reduce motion in brainstem and spinal cord, 4) shift brainstem slice center to include cerebellum, then increase field-of-view in brainstem if necessary to accommodate larger brains.Acknowledgements
R01 NS109450, P41 EB0015891, K24 DA029262References
1. Islam H, Law CSW, Weber KA, Mackey SC, Glover GH. Dynamic per slice shimming for simultaneous brain and spinal cord fMRI. Magn Reson Med. 2019 Feb;81(2):825-838. doi: 10.1002/mrm.27388. Epub 2018 Oct 4. PMID: 30284730; PMCID: PMC6649677.
2. Woolrich, M. W., Ripley, B. D., Brady, M., & Smith, S. M. (2001). Temporal Autocorrelation in Univariate Linear Modeling of FMRI Data. NeuroImage, 14(6), 1370–1386. http://doi.org/10.1006/nimg.2001.0931
3. Glover GH, Li TQ, Ress D. Image-based method for retrospective correction of physiological motion effects in fMRI: RETROICOR. Magn Reson Med 2000;44:162–167.
4. Hsu JJ, Glover GH. Mitigation of susceptibility-induced signal loss in neuroimaging using localized shim coils. Magn Reson Med. 2005 Feb;53(2):243-8. doi: 10.1002/mrm.20365. Erratum in: Magn Reson Med. 2005 Apr;53(4):992. PMID: 15678531.
Figures