1866
Diffusivity-limited q-space trajectory imaging1Department of Biomedical Engineering, Linköping University, Linköping, Sweden, 2Center for Medical Image Science and Visualization (CMIV), Linköping University, Linköping, Sweden, 3Department of Mathematics, Linköping University, Linköping, Sweden
Synopsis
Q-space trajectory imaging (QTI) characterizes microstructures through the statistical moments of the diffusion tensor distribution. A constrained estimation framework named QTI+ was recently proposed to achieve mathematically and physically acceptable estimates of these moments. Here we consider expanding QTI+ with a new set of conditions based on the theoretical maximum value of water diffusivity. We show where these conditions are violated for different bulk diffusivity values, and how the new constraints affect the QTI scalar maps. The results show violations occurring almost exclusively in voxels containing gray matter and CSF. Imposing the constraints produces metrics closer to the expected values.
Introduction
Q-space trajectory imaging (QTI)1 is a framework utilizing diffusion measurements with time varying magnetic field gradients and a diffusion tensor distribution (DTD)2 model for the tissue microstructure. The DTD model assumes Gaussian diffusion within the subdomains making up the tissue. Consequently, all experimental parameters of each diffusion magnetic resonance (dMR) experiment are captured by a measurement tensor $$$B_{ij}$$$. In the limit of small $$$B_{ij}$$$, the MR signal can be represented via cumulant expansion as$$\text{ln}\,S\approx{}\text{ln}\,S_0–B_{ij}\hat{D}_{ij}+\frac{1}{2}B_{ij}B_{kl}C_{ijkl}$$
where $$$S$$$ is the acquired signal, $$$S_0$$$ is the signal for null diffusion gradients, and $$$\hat{D}_{ij}$$$ and $$$C_{ijkl}$$$ are, respectively, the second order mean and fourth order covariance tensors of the DTD.
Herberthson et al.3 recently introduced a framework called QTI+ which improved the method’s robustness to noise and reduced its demand on the number of images to be acquired3,4. This is accomplished by imposing relevant positivity constraints in QTI as was done for other diffusion MR models5. While QTI+ ensures the fulfilment of non-negativity conditions on the $$$\hat{D}_{ij}$$$ and $$$C_{ijkl}$$$ tensors, in this work we consider applying complementary constraints which prohibit water diffusivity to exceed its theoretical physical value. We include these constraints into the QTI+ framework, and observe how they influence the obtained scalar maps.
Methods
The QTI± frameworkThe relevant independent conditions for imposing a maximum bulk diffusivity $$$D0_{max}$$$ to every subdomain in the DTD are as follows, with the letter indicating the tensor upon which the condition is enforced:
d) $$$D0_{max}\,I_{ij} - \hat{D}_{ij} \succeq 0$$$
c1) $$$C_{\alpha\alpha}\leq{}\frac{D0^2_{max}}{4}\,\,\text{and}\,-\frac{D0^2_{max}}{4}\leq{}C_{\alpha\beta}\leq{}\frac{D0^2_{max}}{4}\,\text{for}\,1\leq{}\alpha,\beta\leq 3, \text{where}\,\, C_{\alpha\beta}\,\text{is a 6x6 representation of}\,C_{ijkl}\,\, \text{in a suitable basis}$$$
c2) $$$\lambda_i\leq{}\frac{3}{4}D0^2_{max}\,\,\text{where}\,\lambda_i, i=1,2,3,4,5,6\,\text{are}\,\text{the}\,\text{eigenvalues}\,\text{of}\,C_{\alpha\beta}$$$
m) $$$(M_{ijkl}-D0^2_{max}\delta_{ij}\delta_{kl})u_i u_j v_k v_l\leq{}0,\,\text{for}\,\text{all}\,\text{vectors}\,u\,\text{and}\,v,\,\text{where}\,\, M_{ijkl}=C_{ijkl}+\hat{D}_{ij}\otimes \hat{D}_{kl}\,\text{is}\,\text{the}\,\text{second}\,\text{moment}\,\text{tensor}.$$$
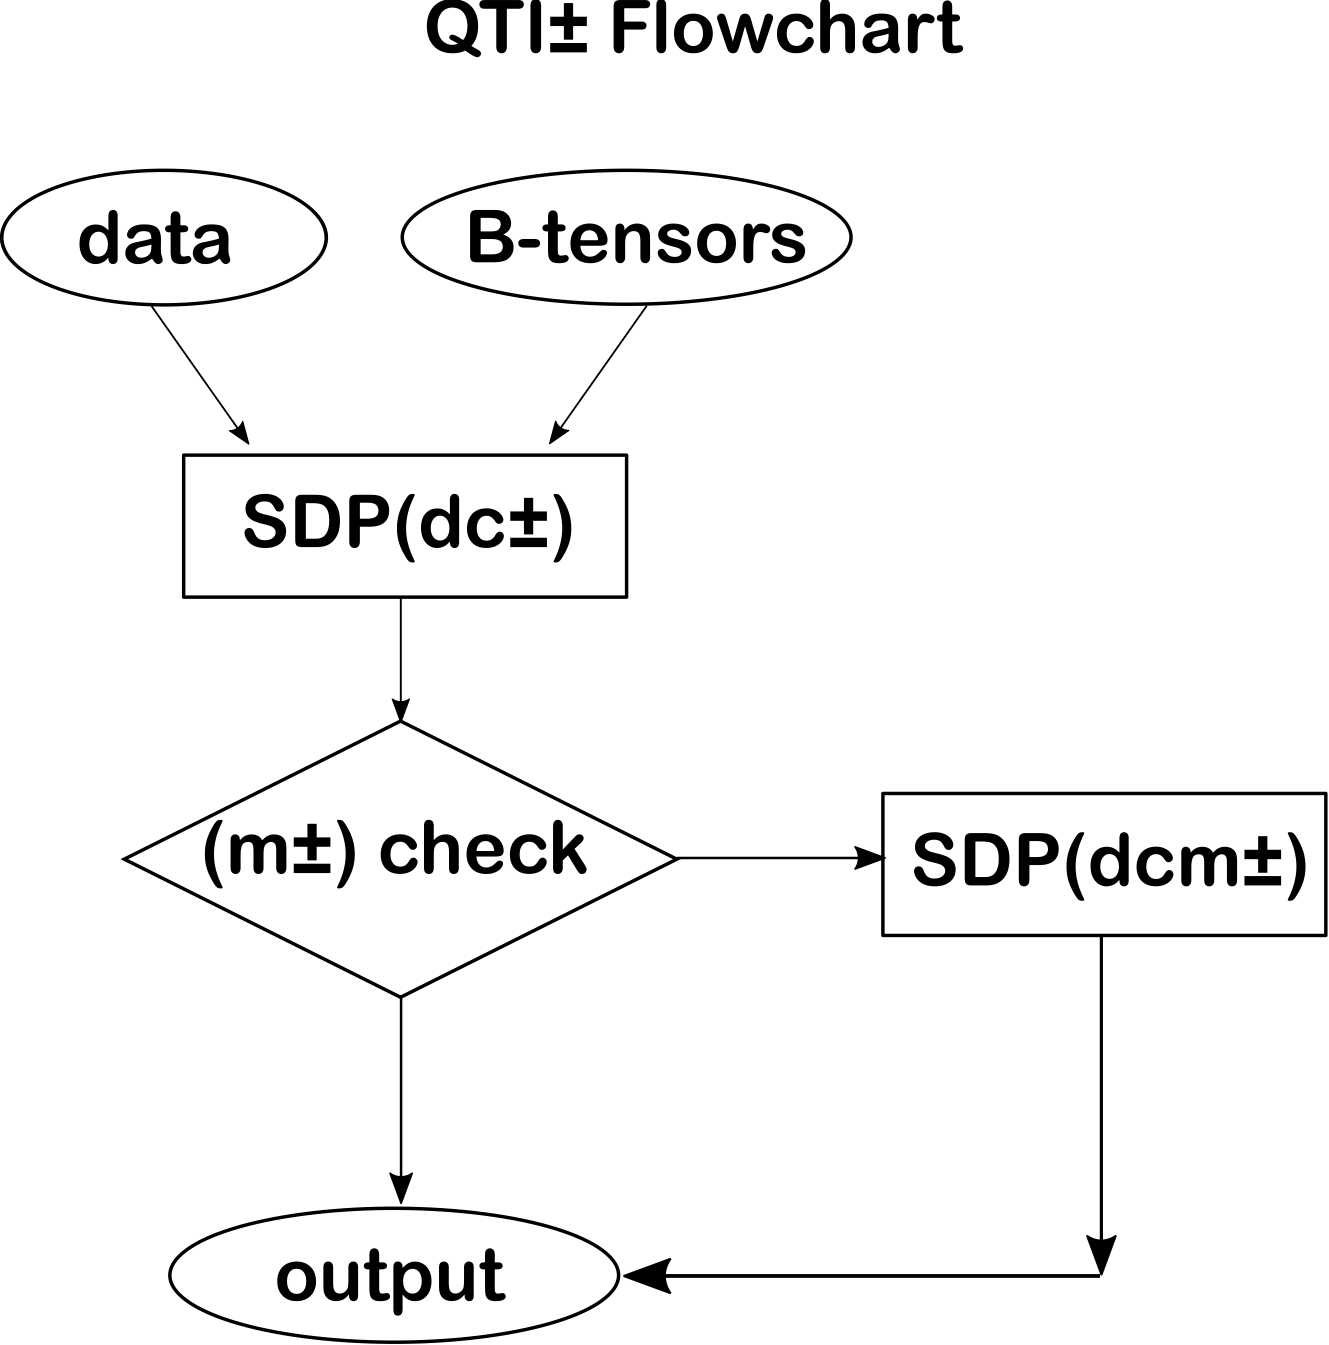
As for the positivity conditions considered in QTI+, the above conditions can be imposed using Semidefinite Programming (SDP). We refer to the resulting framework as QTI±, which is illustrated in Figure 1. We refer to the steps in which conditions d) and c1), c2) are imposed and where conditions d), c1), c2), and m) are imposed as SDP(dc±) and SDP(dcm±), respectively. The “$$$\pm$$$” sign indicates that both the positivity constraints from QTI+ and the constraints from this work are imposed.
Data
To study the effect of including the additional constraints, we employed the same data and protocols as detailed in Herberthson et al.3, where a publicly available dataset6 comprising 217 diffusion volumes was subsampled to obtain datasets containing 81, 56, and 39 volumes.
Experiments
The constraints considered in QTI± require selecting the maximum allowed diffusivity $$$D0_{max}$$$. To address the question of what that value should be, we investigated how 5 different bulk diffusivity $$$D0$$$ values used as $$$D0_{max}$$$ affect the results. The considered values were derived from the work of Holz et al.7. First, we determined where the conditions are violated, both across different $$$D0_{max}$$$ and different subsamplings of the employed dataset, and then verified how imposing the conditions changed the scalar maps derived from the estimated $$$\hat{D}_{ij}$$$ and $$$C_{ijkl}$$$ tensors.
Results
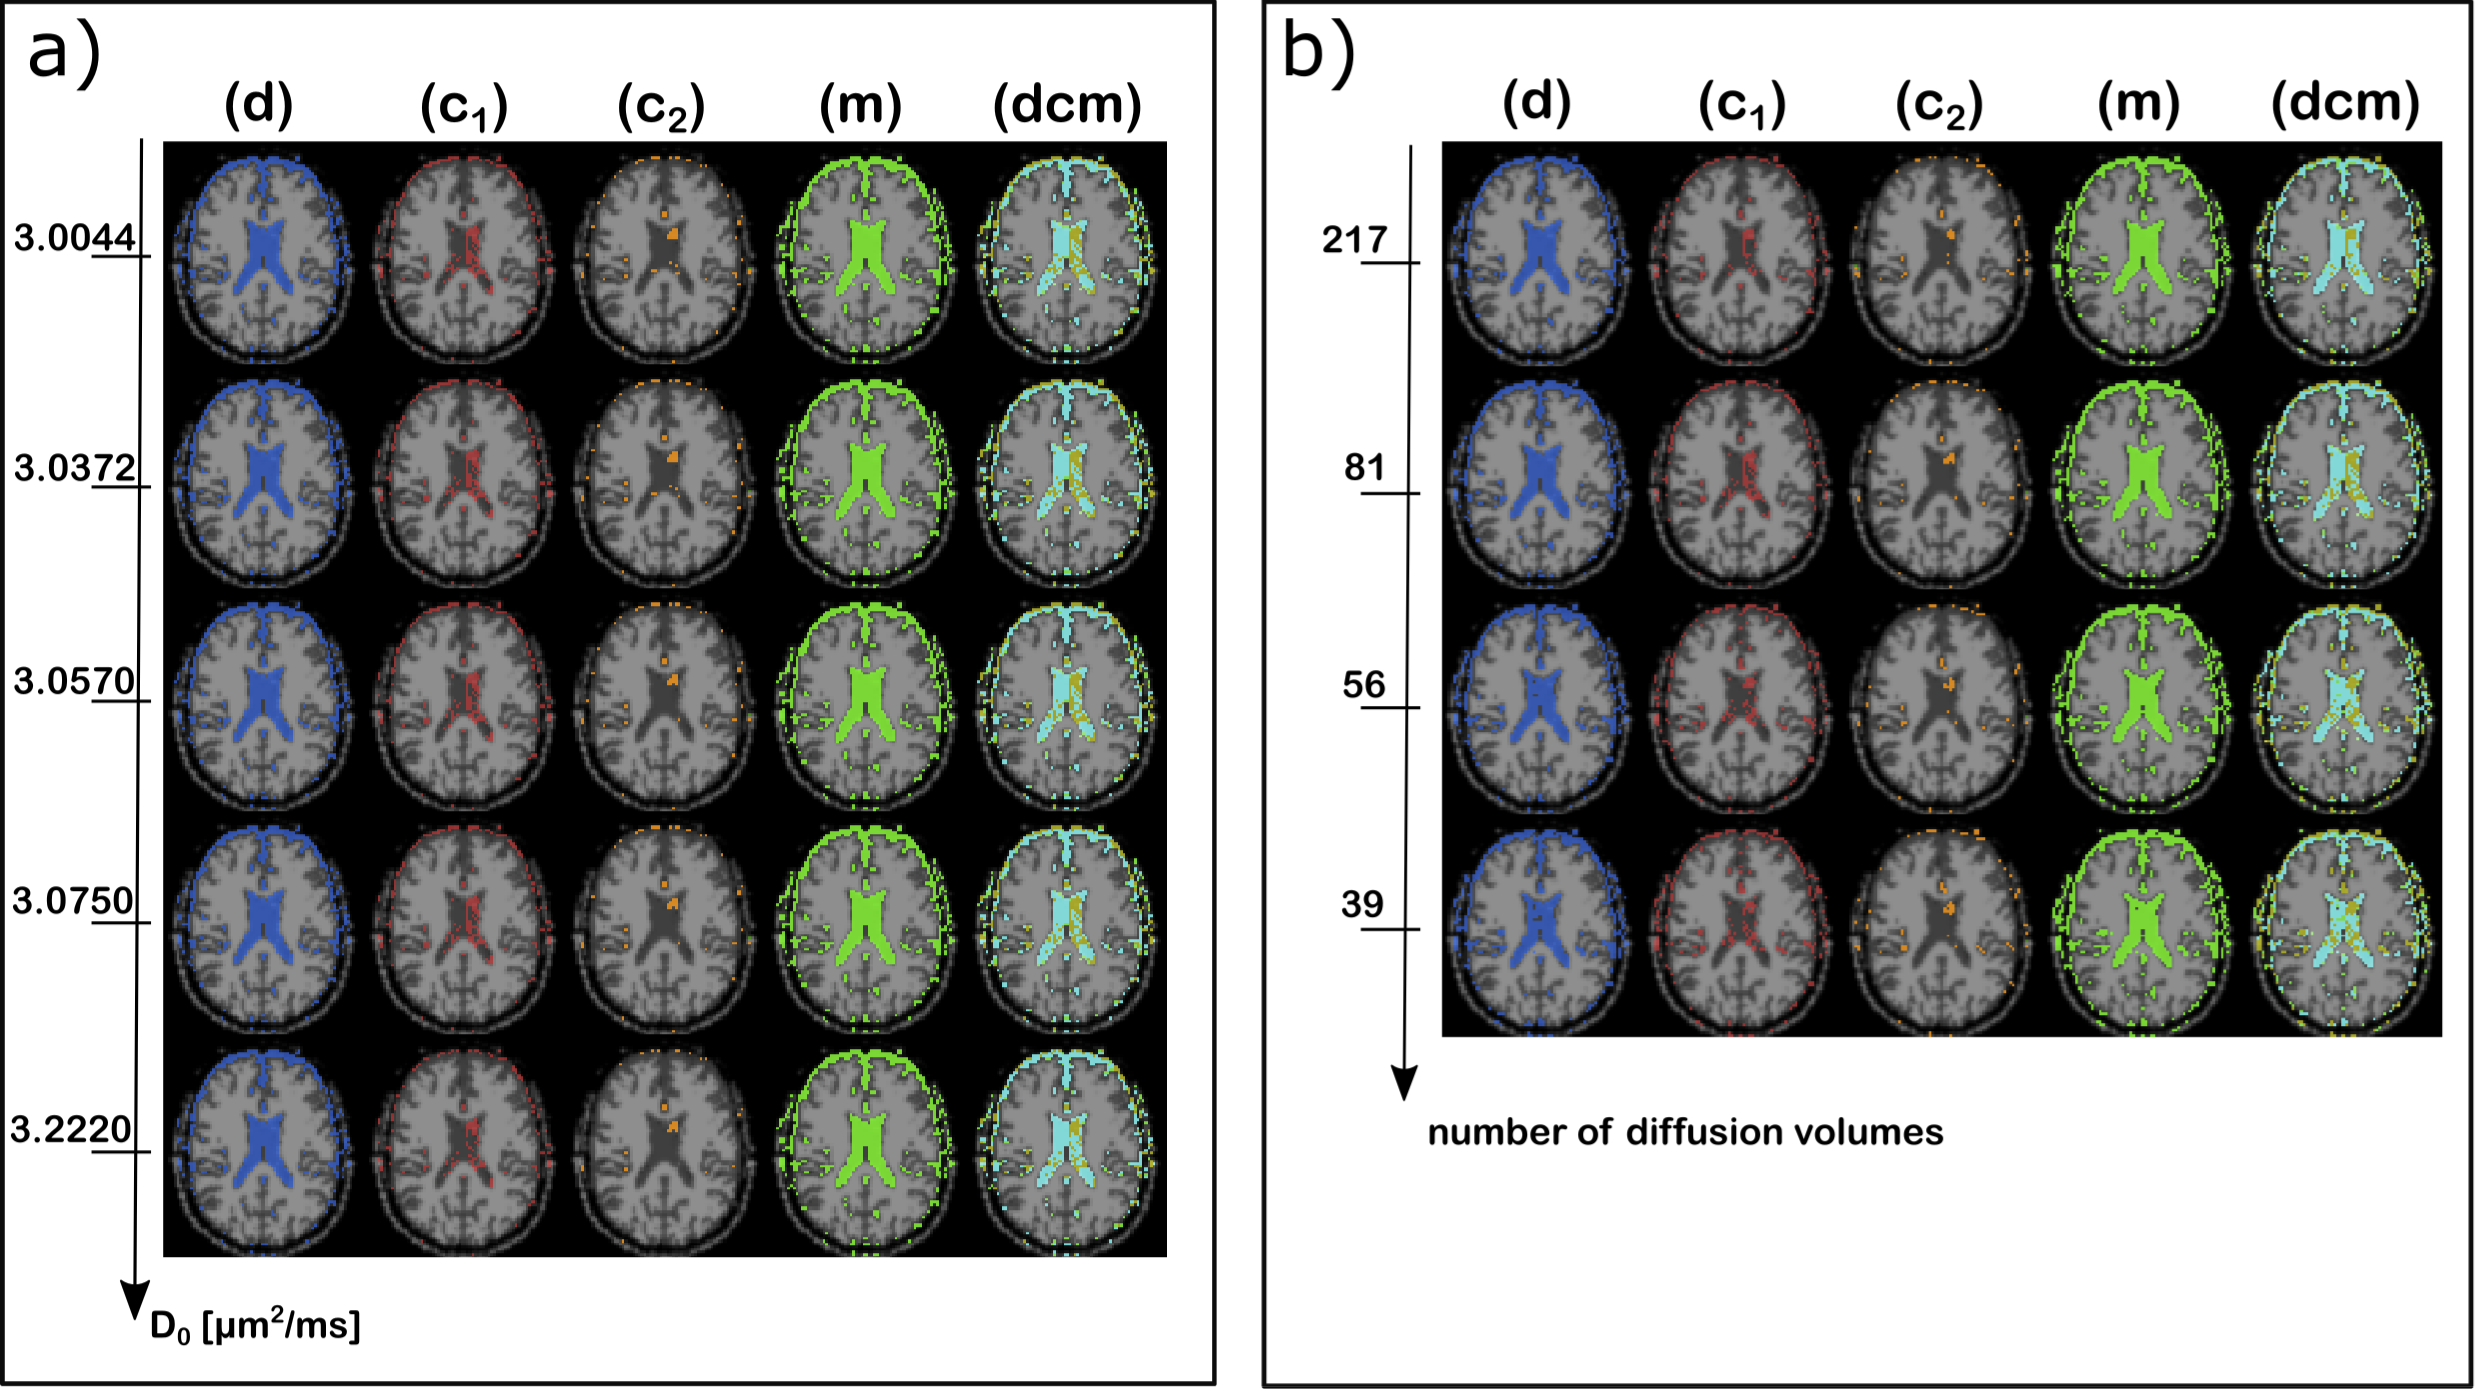
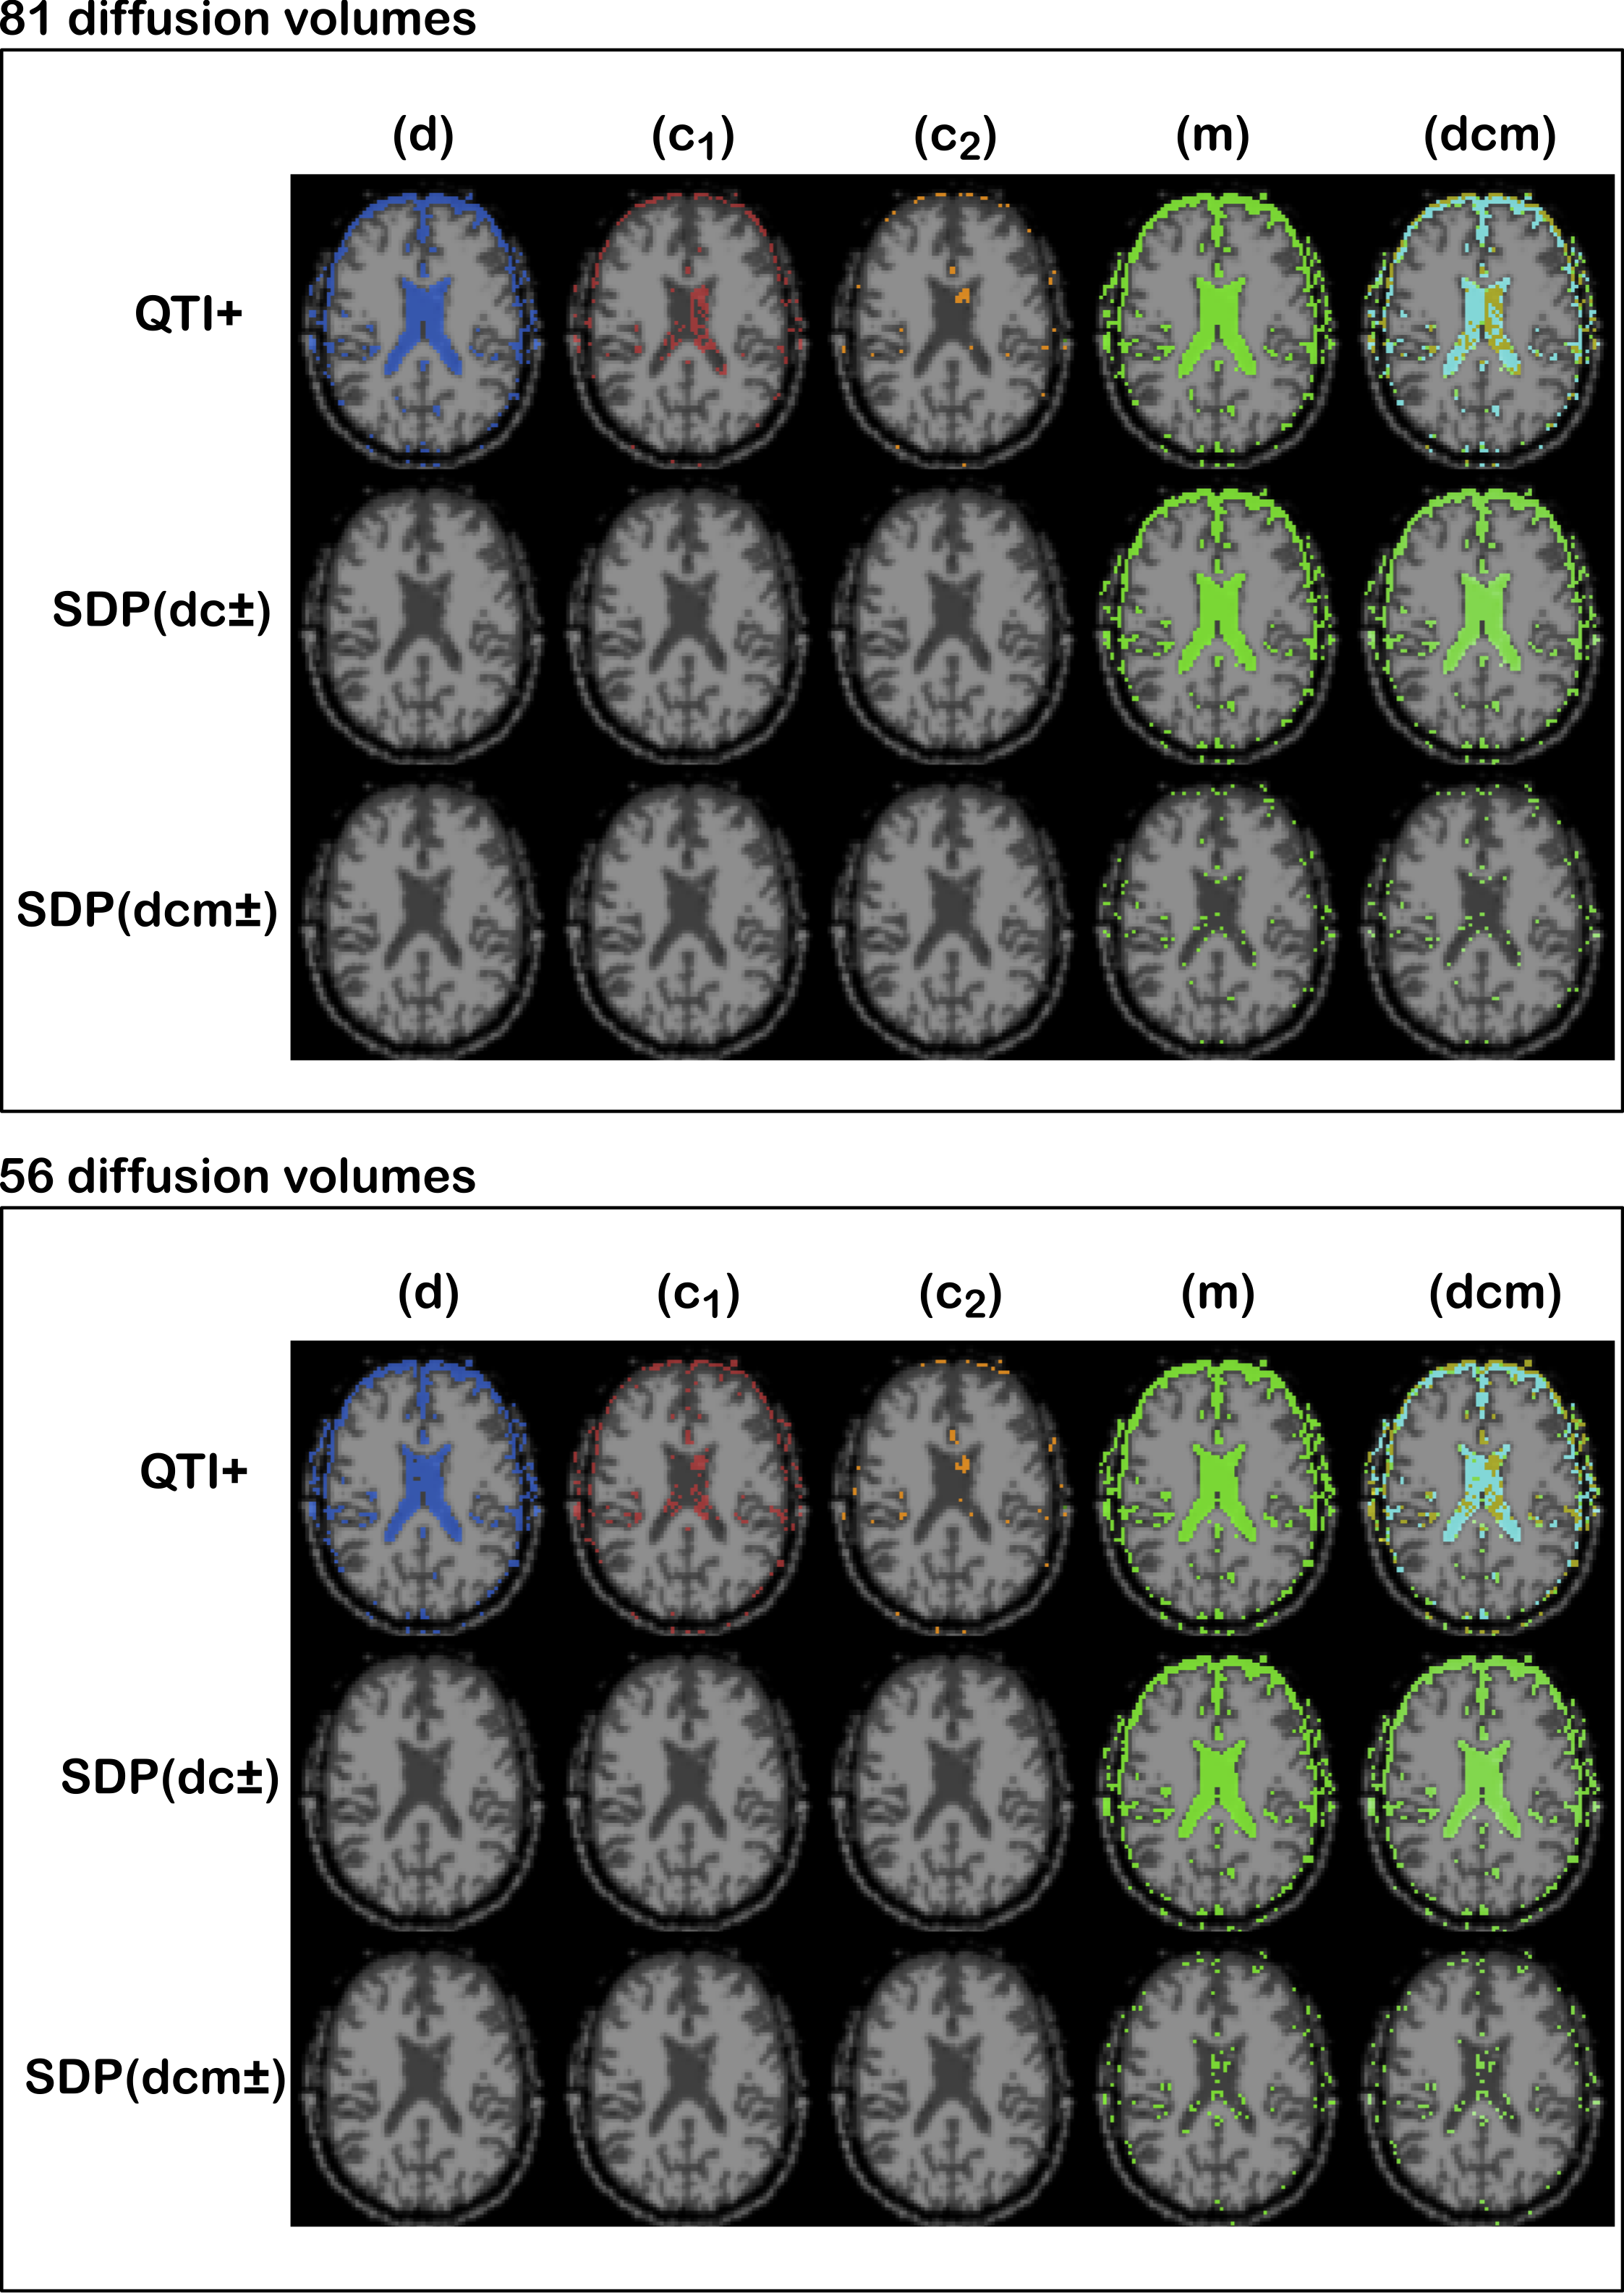
Figure 2 shows the location of voxels where violations of conditions d), c1), c2), and m) occur, respectively. In panel a), the violations are shown for different $$$D0_{max}$$$ values on the QTI+ results obtained for the 81-volume dataset. In panel b), the violations are shown for the same $$$D0_{max} = 3.0750\, \mu{}m^2/ms$$$ on the datasets having different number of volumes. The results show consistency of violations both across $$$D0_{max}$$$ and datasets. The violations are found in voxels containing gray matter and CSF.Figure 3 shows the effect of imposing the speed limit conditions ($$$D0_{max}=3.0750\,\mu{}m^2/ms$$$) on the 81 and 56 volumes datasets. We note that while imposing conditions d) alongside c1) and c2) results in the estimated tensors completely observing these constraints, imposing condition m) proves less effective.
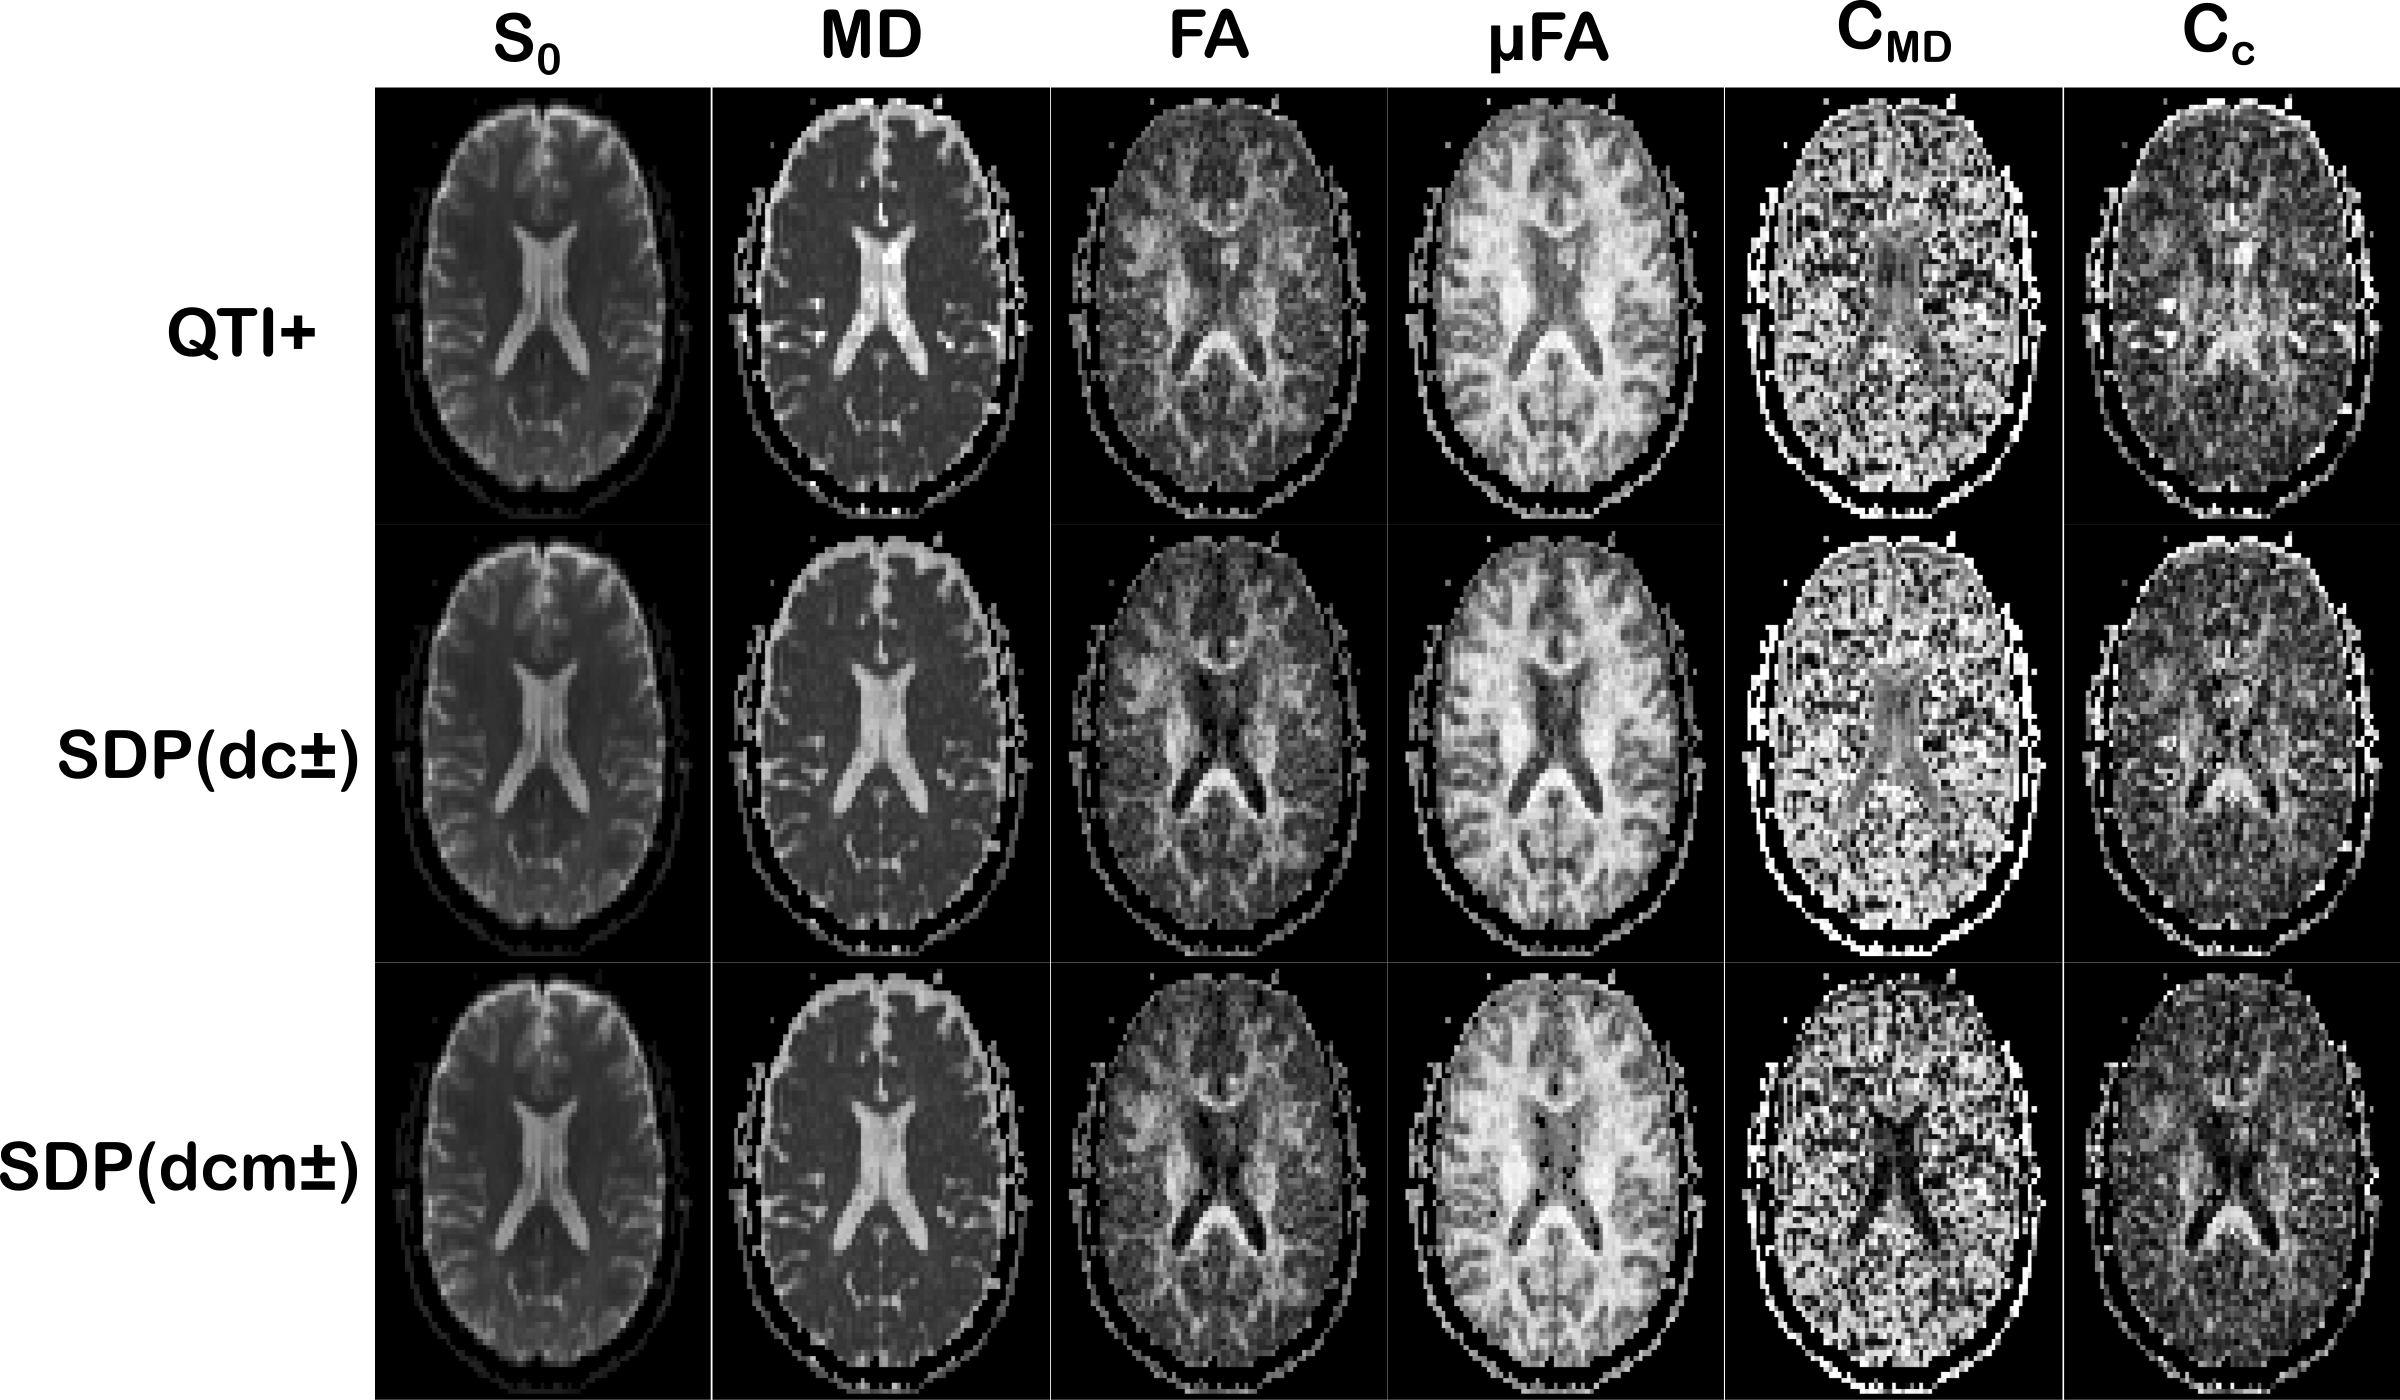
Figures 4 and 5 show the QTI-derived maps as computed from QTI+, SDP(dc±), and SDP(dcm±) for the datasets with 81 and 56 volumes, respectively. The results in Figure (4) depict the improved estimations for SDP(dcm±) of the macro and micro anisotropy ($$$FA$$$ and $$$\mu{}FA$$$), size variance ($$$C_{MD}$$$), and orientational coherence ($$$C_c$$$) metrics in the ventricles, where they are expected to have low values. This allows, for example, easier delineation of the anatomical regions near the ventricles from the $$$FA$$$ maps, which would otherwise be indistinguishable in the QTI+ results, and the suppression of the CSF flow artifact identifiable as a bright spot in the $$$FA$$$ and $$$\mu{}FA$$$ maps obtained with QTI+. The results in Figure (5) also exhibit improved $$$FA,$$$ $$$C_{MD}$$$, and $$$C_c$$$ estimates for SDP(dc±), while also showing that imposing condition m) could introduce numerical errors in the computation of $$$\mu{}FA$$$.
Discussion & Conclusion
The violations of the constraints considered in this work seem to be limited to areas not commonly targeted by standard clinical acquisition protocols. The signal values being close to the Rician noise floor and/or other processes such as CSF flow could influence the data, and imposing constraints seems to alleviate this problem, at least when sufficient diffusion data are collected. When fewer diffusion-weighted volumes are available, pre-processing steps such as noise bias correction8 could further improve the results.In conclusion, we showed how incorporating additional constraints into the QTI+ framework could further improve the estimated parameters, including the QTI derived scalar maps.
Acknowledgements
The authors thank Ida Blystad for the interpretation of the images and Tom Dela Haije for his comments on the work. This project was financially supported by Linköping University Center for Industrial Information Technology (CENIIT), LiU Cancer, Sweden's Innovation Agency (VINNOVA) ASSIST, the Swedish Foundation for Strategic Research (RMX18-0056), and Analytic Imaging Diagnostic Arena (AIDA).References
1. Westin, C.F., Knutsson, H., Pasternak, O., Szczepankiewicz, F., Özarslan, E., van Westen, D., Mattisson, C., Bogren, M., O'Donnell, L.J., Kubicki, M., Topgaard, D., Nilsson, M. Q-space trajectory imaging for multidimensional diffusion MRI ofthe human brain. NeuroImage 2016;135:345
2. Jian, B., Vemuri, B.C., Özarslan, E., Carney, P.R., Mareci, T.H. A novel tensor distribution model for the diffusion-weighted MR signal. NeuroImage 2007;37(1):164-176.
3. Herberthson M, Boito D, Haije TD, Feragen A, Westin CF, Özarslan E. Q-space trajectory imaging with positivity constraints (QTI+). Neuroimage. 2021 Sep;238:118198. doi: 10.1016/j.neuroimage.2021.118198. Epub 2021 May 21. PMID: 34029738.
4. Boito D., Herberthson M., Dela Haije T., Özarslan E. Enforcing positivity constraints in q-space trajectory imaging (QTI) allows for reduced scan time. In Proc Intl Soc Mag Reson Med, volume 29, page 0404, 2021.
5. Dela Haije, T., Özarslan, E., Feragen, A. Enforcing necessary nonnegativity constraints for common diffusion MRI models using sum of squares programming. NeuroImage 2020;209:116405.
6. Szczepankiewicz F., Hoge S., Westin CF. Linear, planar and spherical tensor-valued diffusion MRI data by free waveform encoding in healthy brain, water, oil and liquid crystals. Data Brief. 2019;25:104208.
7. Holz M., Heil S., Sacco A. Temperature-dependent Self-diffusion Coefficients of Water and Six Selected Molecular Liquids for Calibration in Accurate 1H NMR PFG Measurements. Physical Chemistry Chemical Physics. 2000. 10.1039/B005319H.
8. Koay C.G., Özarslan E., Basser P.J. A signal transformational framework for breaking the noise floor and its applications in MRI. J. Magn. Reson., 197 (2009), pp. 108-119, 10.1016/j.jmr.2008.11.015
Figures