1865
Single-Shot Multi-b-value (SSMb) Diffusion-weighted MRI Using Spin Echo and Stimulated Echoes with Variable Flip Angles
Guangyu Dan1,2, Kaibao Sun1, Qingfei Luo1, and Xiaohong Joe Zhou1,2,3
1Center for Magnetic Resonance Research, University of Illinois at Chicago, Chicago, IL, United States, 2Department of Biomedical Engineering, University of Illinois at Chicago, Chicago, IL, United States, 3Departments of Radiology and Neurosurgery, University of Illinois at Chicago, Chicago, IL, United States
1Center for Magnetic Resonance Research, University of Illinois at Chicago, Chicago, IL, United States, 2Department of Biomedical Engineering, University of Illinois at Chicago, Chicago, IL, United States, 3Departments of Radiology and Neurosurgery, University of Illinois at Chicago, Chicago, IL, United States
Synopsis
In diffusion-weighted imaging with multiple b-values, the acquisition times using a spin-echo EPI sequence can be long because each b-value requires a new shot. The lengthy acquisition time imposes issues with patient compliance and increases venerability to motion-induced errors in quantitative analysis. We herein report a novel pulse sequence that acquires multiple diffusion-weighted images with difference b-values in a single shot by utilizing the combination of a spin echo and a train of stimulated echoes with variable flip angles. This sequence has been demonstrated in a quantitative diffusion phantom and the human brain to realize a 4-fold scan time reduction.
Introduction
Diffusion-weighted images are typically acquired using a single-shot spin-echo echo-planar imaging (SE-EPI) sequence due to its robustness against motion and high time efficiency1. Stimulated-echo acquisition mode (STEAM) has also been used to support a long diffusion time (Δ) during the mixing time (TM) without excessive signal loss due to T2 decay2-4. Either SE-EPI or STEAM acquires only one diffusion image per TR. The sequence must be repeated in diffusion-weighted imaging (DWI) studies requiring multiple b-values, leading to long acquisition times, patient compliance issues, and motion-induced image misregistration5. Herein, we demonstrate a Single-Shot Multi-b-value (SSMb) DWI sequence that can produce multiple images with different b-values in one TR by utilizing the combination of a spin echo and a train of stimulated echoes with variable flip angles.Methods
Pulse sequence design: The SSMb sequence (Figure 1) consists of three modules. The first module – the diffusion-weighted spin-echo and stimulated-echo (DW-SESTE) preparation module – contains a pair of 90° RF pulses to produce and restore half of the magnetization along the longitudinal axis, while leaving the other half in the transverse plane. The first half (GD) of a Stejskal-Tanner gradient pair is introduced between the two 90° RF pulses. The second module – the spin-echo echo-planar imaging (SEPI) module – provides the second half (GD) of the Stejskal-Tanner gradient pair to rephase the transverse magnetization, forming a spin echo that is acquired by the first echo-train readout (ET1). The third module – the variable-flip-angle stimulated-echo EPI (VFA-STEPI) module – employs n low-flip-angle pulses to re-excite the stored longitudinal magnetization, each followed by a GD and an EPI readout train to sample the transverse magnetization at or near the stimulated echo, resulting in a total of n stimulated-echo echo-train readouts (ET2, ET3, …, ETn+1) all having the same TE. These stimulated-echo signals, together with the spin-echo signal in the second module, produce (n+1) diffusion images acquired with different diffusion times, hence different b-values.The (n+1) images experience different degrees of T1 weighting. To compensate for this effect and the compounded effect of the varying flip angle of the proceeding RF pulses in the stimulated-echo train, a calibration scan was performed without the diffusion-weighting gradients. The corrected image intensity was obtained by dividing the signal intensity in the SSMb diffusion image by the calibration signal intensity at the corresponding echo.
Image acquisition and analysis: The SSMb sequence was implemented on a GE MR750 3T scanner. For demonstration, n = 3 was chosen with flip angles of 35.3°, 45.0°, and 90.0°, respectively. Axial SSMb images of an NIST diffusion phantom consisting of 13 compartments were acquired with b-values = [37, 395, 733, 1071] s/mm2, TR = 4 s, FOV = 20×20 cm2, matrix size = 128×128, slice thickness = 5 mm, and scan time = 32 s. For comparison, images were also acquired using a conventional diffusion-weighted SE-EPI sequence (SE-DWI) with the same b-values, but applied in different TRs (or shots). For each pulse sequence, an ADC map was obtained from a mono-exponential model. Pearson correlation coefficient was calculated to evaluate the linear correlation between the measured ADC values from the SSMb and SE-DWI scans.
With IRB approval, healthy volunteers were scanned in two experiments to demonstrate the SSMb’s capability of acquiring images with multi-b-values in a single acquisition [b-values = (16, 195, 364, 533) s/mm2, NEX = 1, and scan time = 4 s] and to evaluate the ADC accuracy using the same protocol as in the phantom experiment, respectively. For comparison, SE-DWI images were also acquired using similar imaging parameters. For ADC evaluation, histograms of voxel-wise ADC values covering the entire brain in a given slice were plotted.
Results
Figures 2a and 2b show the ADC measurement results from the phantom with the SSMb and the conventional SE-DWI sequences, respectively. ADCs measured by SSMb from individual compartments were plotted against those by SE-DWI in Figure 2c, which shows a high Pearson correlation coefficient (r = 0.999). Figure 3 displays a set of brain diffusion-weighted images acquired by using the SSMb sequence with four b-values in a single-shot and the corresponding images by SE-DWI in four shots. SSMb provided a 4-fold scan time reduction (16 s to 4 s) without degrading the image quality other than a lower SNR efficiency by ~29%. SSMb was also capable of multislice, interleaved acquisitions as shown in Figure 4. Brain ADC maps estimated from the SSMb and SE-DWI sequences exhibited similar a contrast (Figures 5a and 5b). Furthermore, the histograms of the ADC values from the two sequences showed a high degree of consistency (Figure 5c).Discussion and Conclusion
We have demonstrated a single-shot multi-b-value DWI sequence using the combination of a spin echo and a train of stimulated echoes with variable flip angles. This method not only enables rapid and spatially co-registered diffusion-weighted imaging, but also illustrates the feasibility of changing diffusion weighting by varying the diffusion time. Quantitative evaluations using ADC have shown an excellent agreement between the proposed sequence and a conventional sequence using spin-echo EPI. The demonstrations on phantom and human brain provide a proof of concept of the SSMb technique whose clinical applications will be explored in the future.Acknowledgements
This work was supported in part by the National Institutes of Health (Grant Nos. 5R01EB026716-01 and 1S10RR028898-01). The content is solely the responsibility of the authors and does not necessarily represent the official views of the National Institutes of Health. We thank Drs. Diego Hernando and Yuxin Zhang from University of Wisconsin-Madison for providing the original DW-STEAM sequence, Dr. Arnaud Guidon from GE Healthcare for facilitating pulse sequence collaboration, Dr. Stephen E. Russek for providing the NIST/NIBIB diffusion phantom, and Drs. Zheng Zhong and Muge Karaman for helpful discussions.References
1. Le Bihan D, Poupon C, Amadon A, et al. Artifacts and pitfalls in diffusion MRI. Magn. Reson. Med. 2006;24(3):478–488.2. Zhang Y, Wells SA, Triche BL, et al. Stimulated-echo diffusion-weighted imaging with moderate b values for the detection of prostate cancer. Eur. Radiol. 2020;30(6):3236-3244.
3. Bernstein MA, Kevin FK, Zhou XJ. Handbook of MRI pulse sequences. Elsevier. 2004.
4. Dan G, Li W, Zhong Z, et al. Diffusion in sephadex gel structures: Time dependency revealed by multi-sequence acquisition over a broad diffusion time range. Mathematics. 2021;9(14):1688.
5. Zhang Y, Wells SA, Hernando D. Stimulated echo based mapping (STEM) of T1, T2, and apparent diffusion coefficient: validation and protocol optimization. Magn. Reson. Med. 2019;81:167–181.
Figures
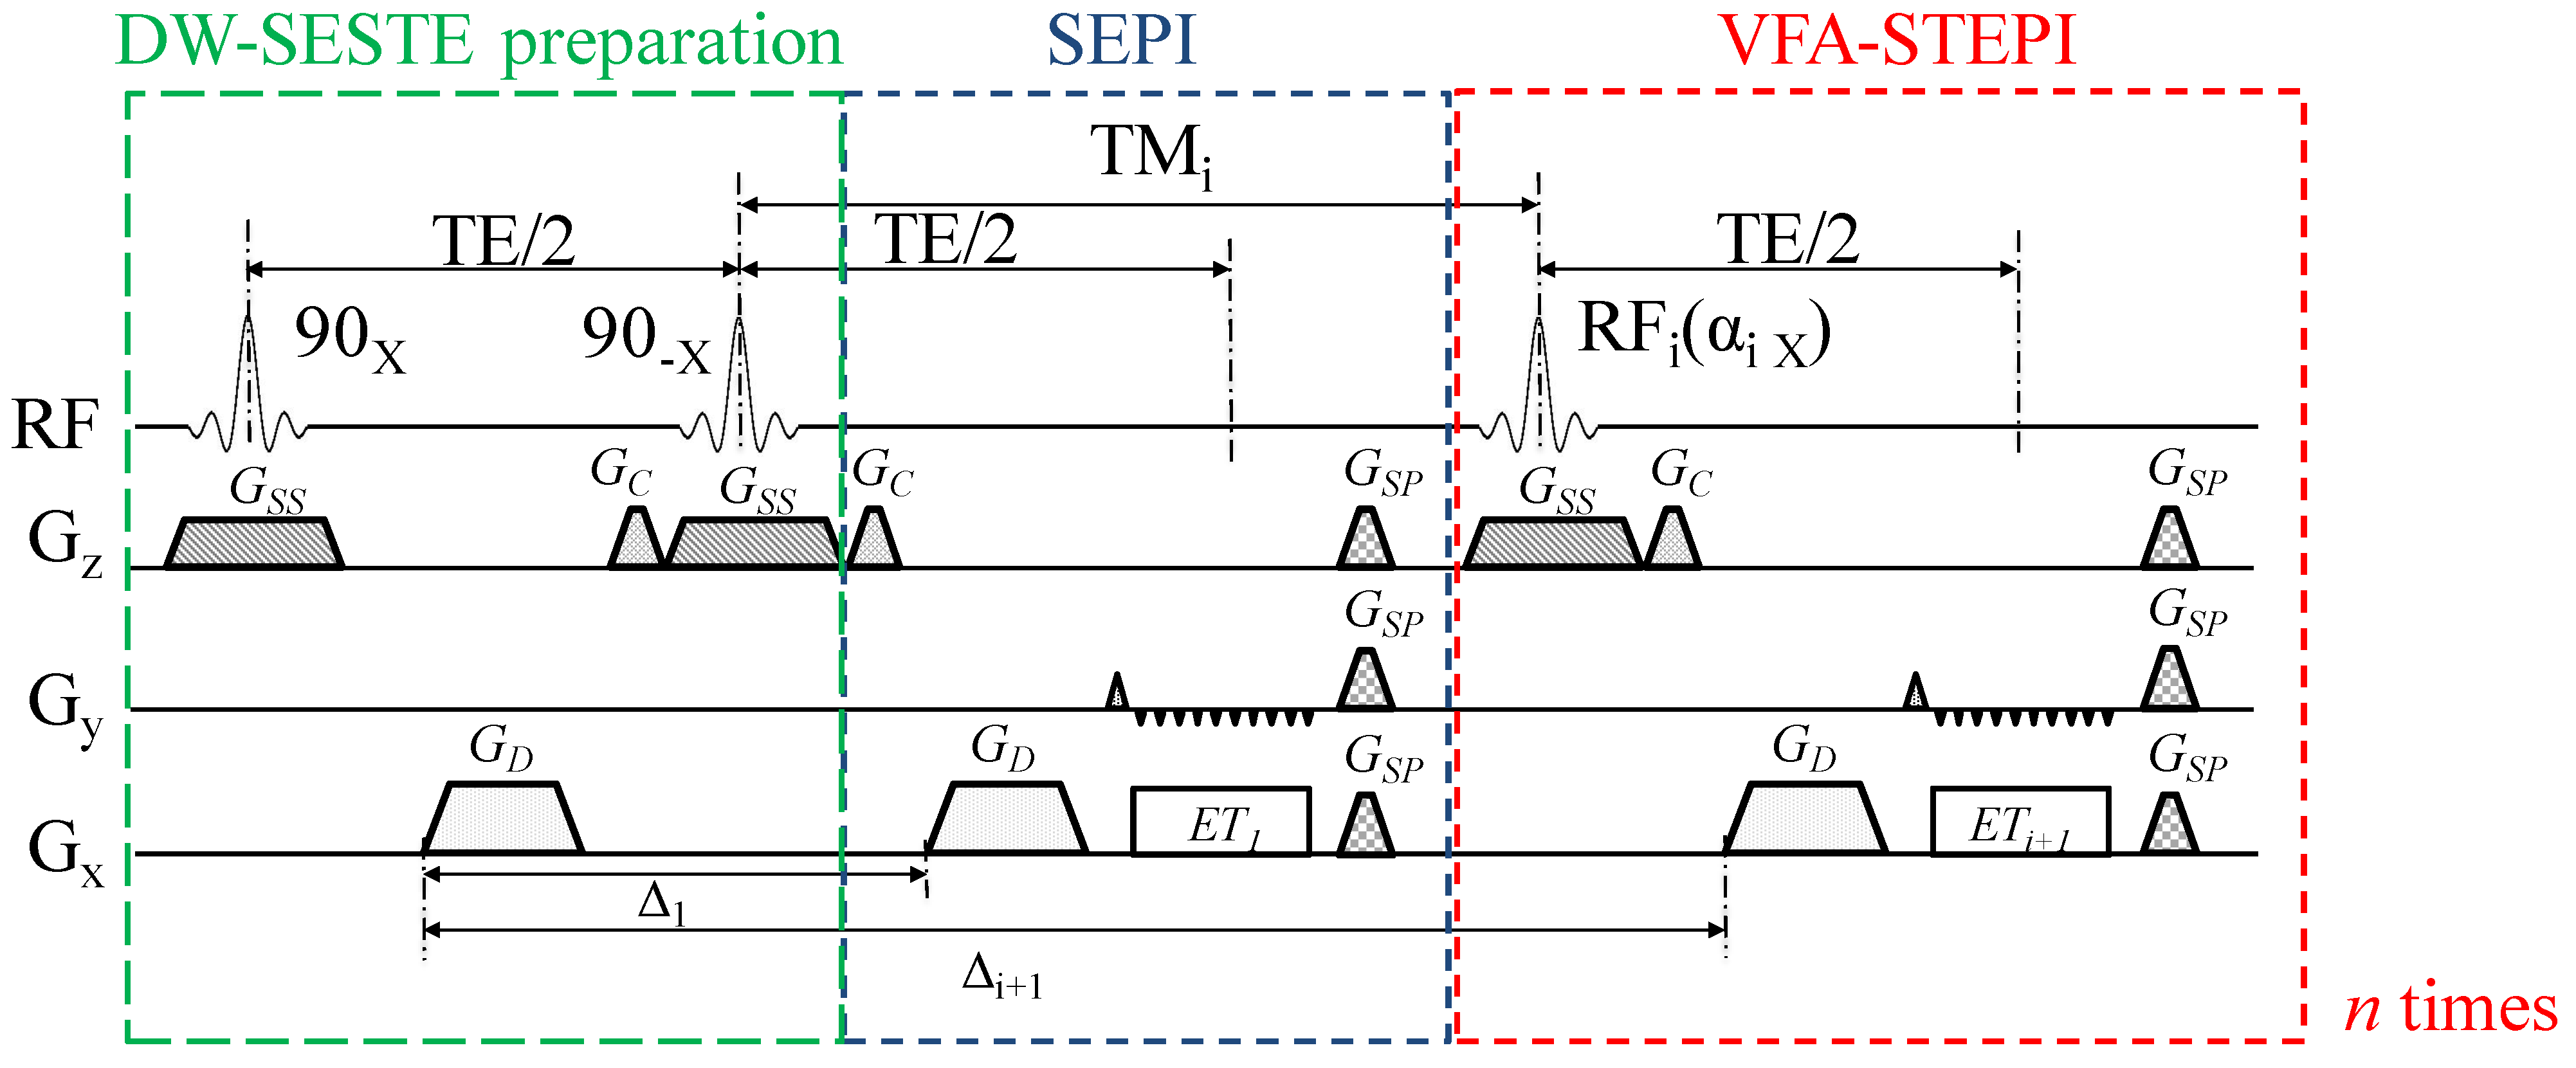
Figure 1. A diagram of the SSMb
sequence. n+1 echo-planar images with
different diffusion weighting are acquired in a single TR. The sequence
contains a DW-SESTEPI preparation module, a SEPI module, and a VFA-STEPI module,
as explained in the text. The amplitude of the spoiler gradient GSP
is set differently throughout the sequence to prevent the formation of unwanted
spin echoes. GC, crusher gradient; GSS,
slice-selection gradient; ETi, the ith echo-train
readout; Δi, separation between the dephasing diffusion gradient and
the ith rephasing diffusion gradient.

Figure 2. a): NIST phantom ADC map
estimated from the diffusion-weighted images acquired using the SSMb
sequence. b): Corresponding ADC map estimated
from the diffusion images acquired by the commercial SE-DWI sequence. c): Mean
ADC values from the SSMb sequence vs. those from the SE-DWI sequence. The ADCs
were measured within an ROI of 1.98 cm2 in each compartment. The
black diagonal line serves as a reference representing equal measurements. The
red bars indicate the errors. The Pearson correlation coefficient was r =
0.999.
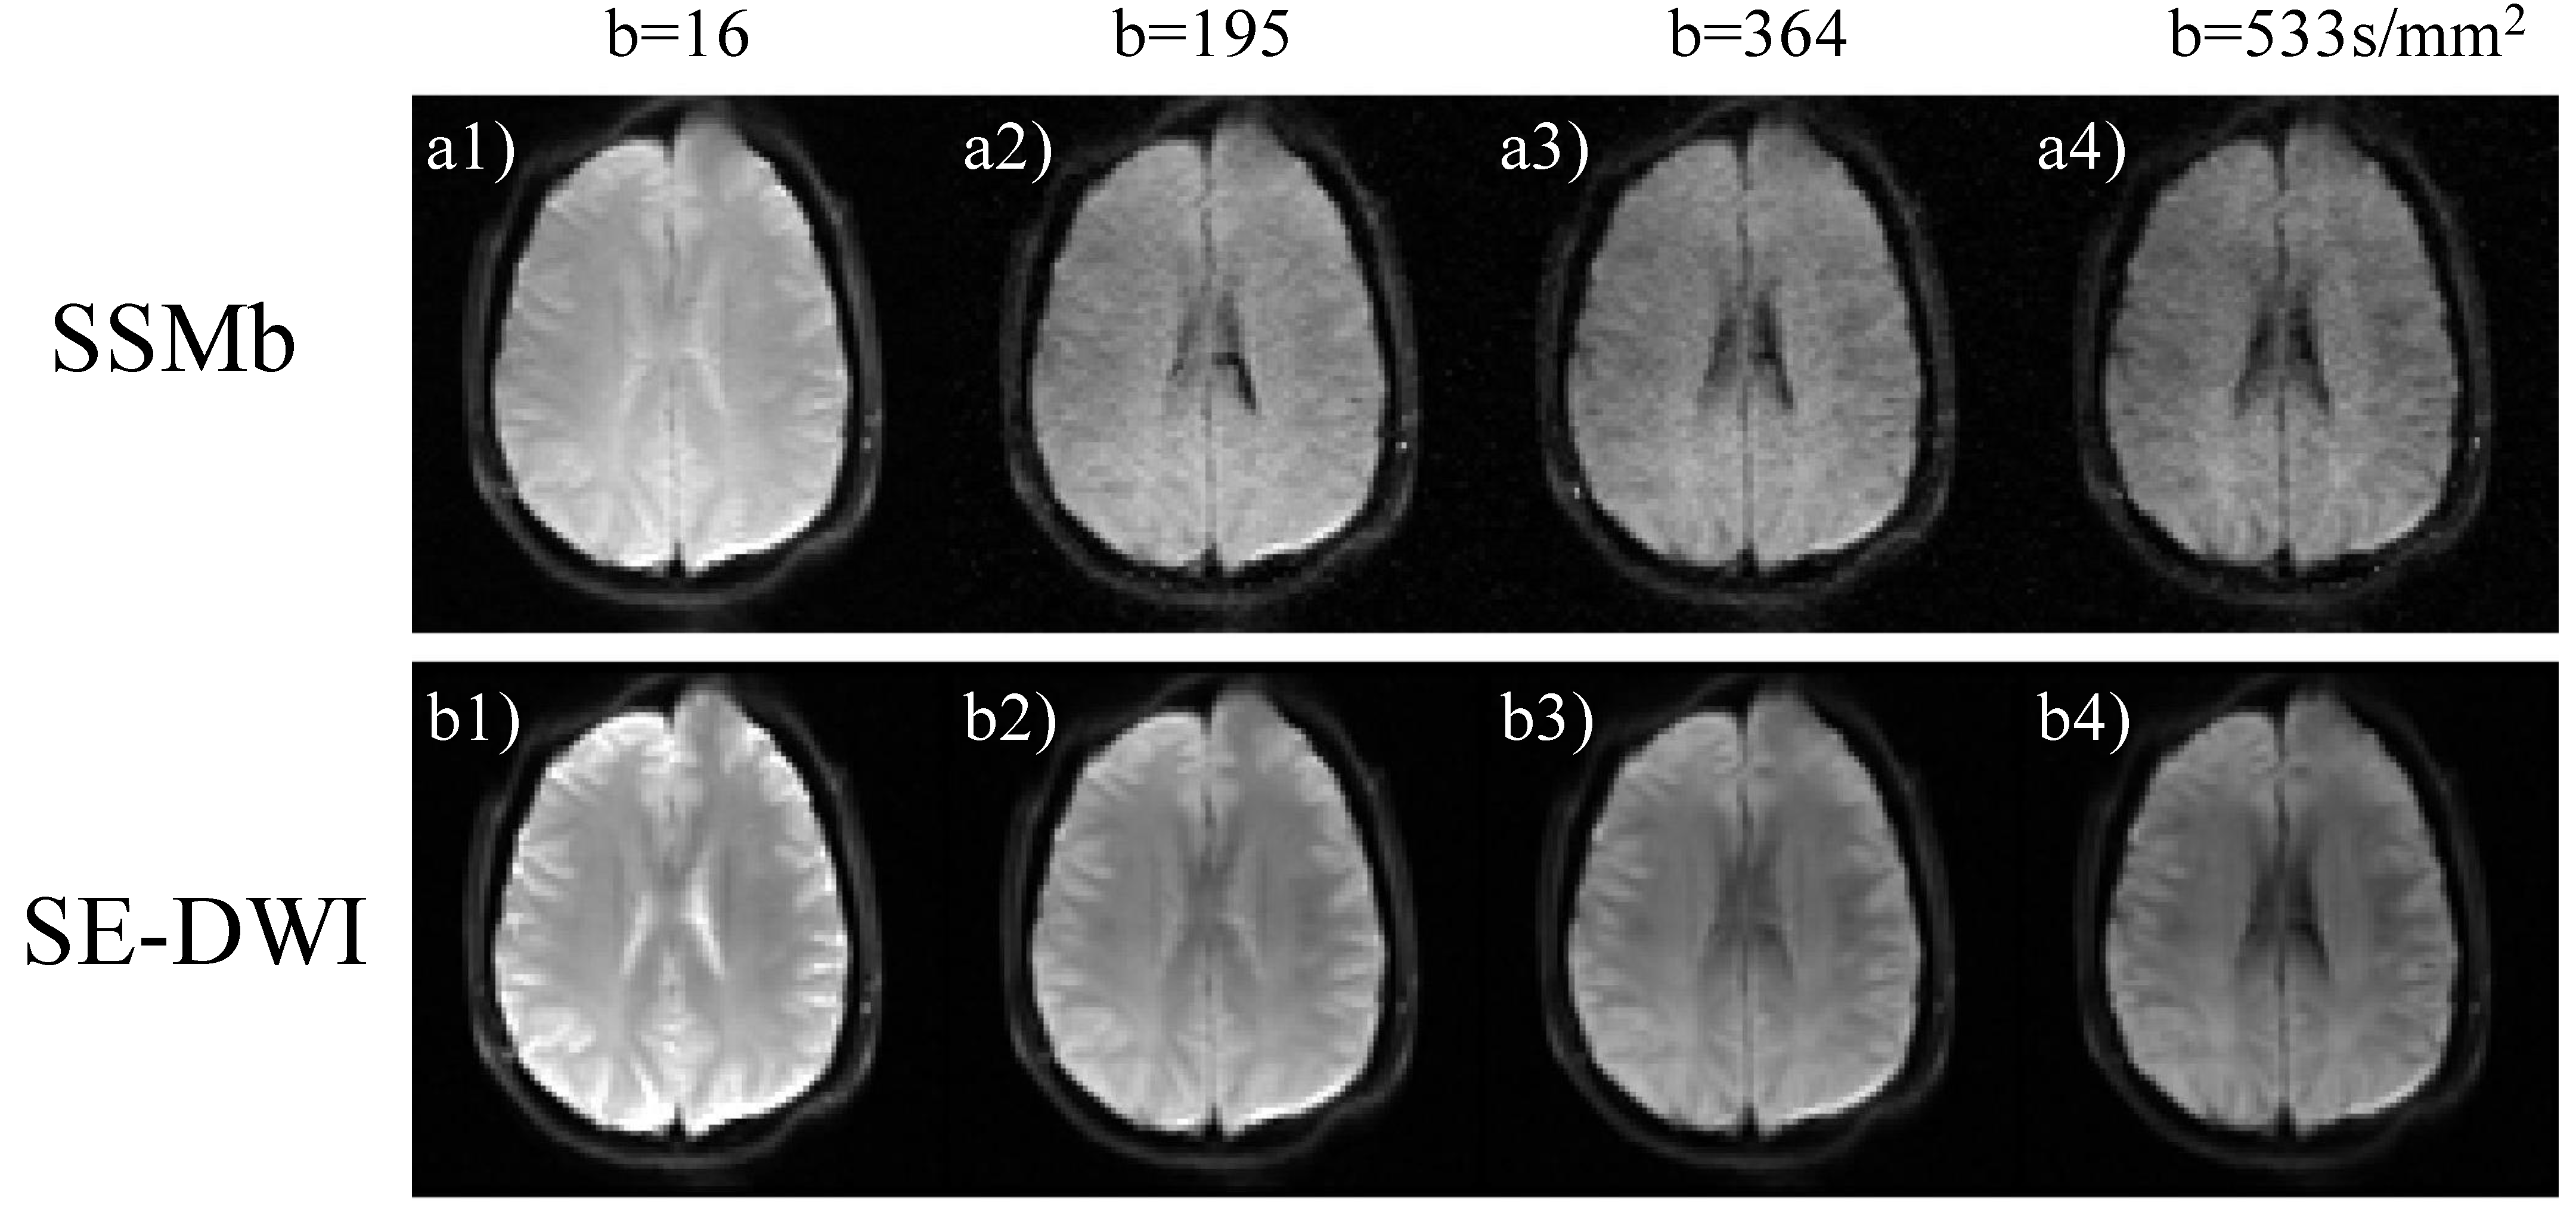
Figure 3. a1) – a4): A set of
representative axial diffusion-weighted images from the brain acquired by using
the SSMb
sequence in one shot (4 s) from a healthy human
subject (male, 34-year-old). The four images in the first row were acquired by
the SEPI readout and the 3 subsequent VFA-STEPI readouts, respectively. b1) – b4):
The corresponding diffusion-weighted images acquired by using the conventional SE-DWI
sequence in four separate shots (16 s). Diffusion gradients were applied along
the right/left direction.
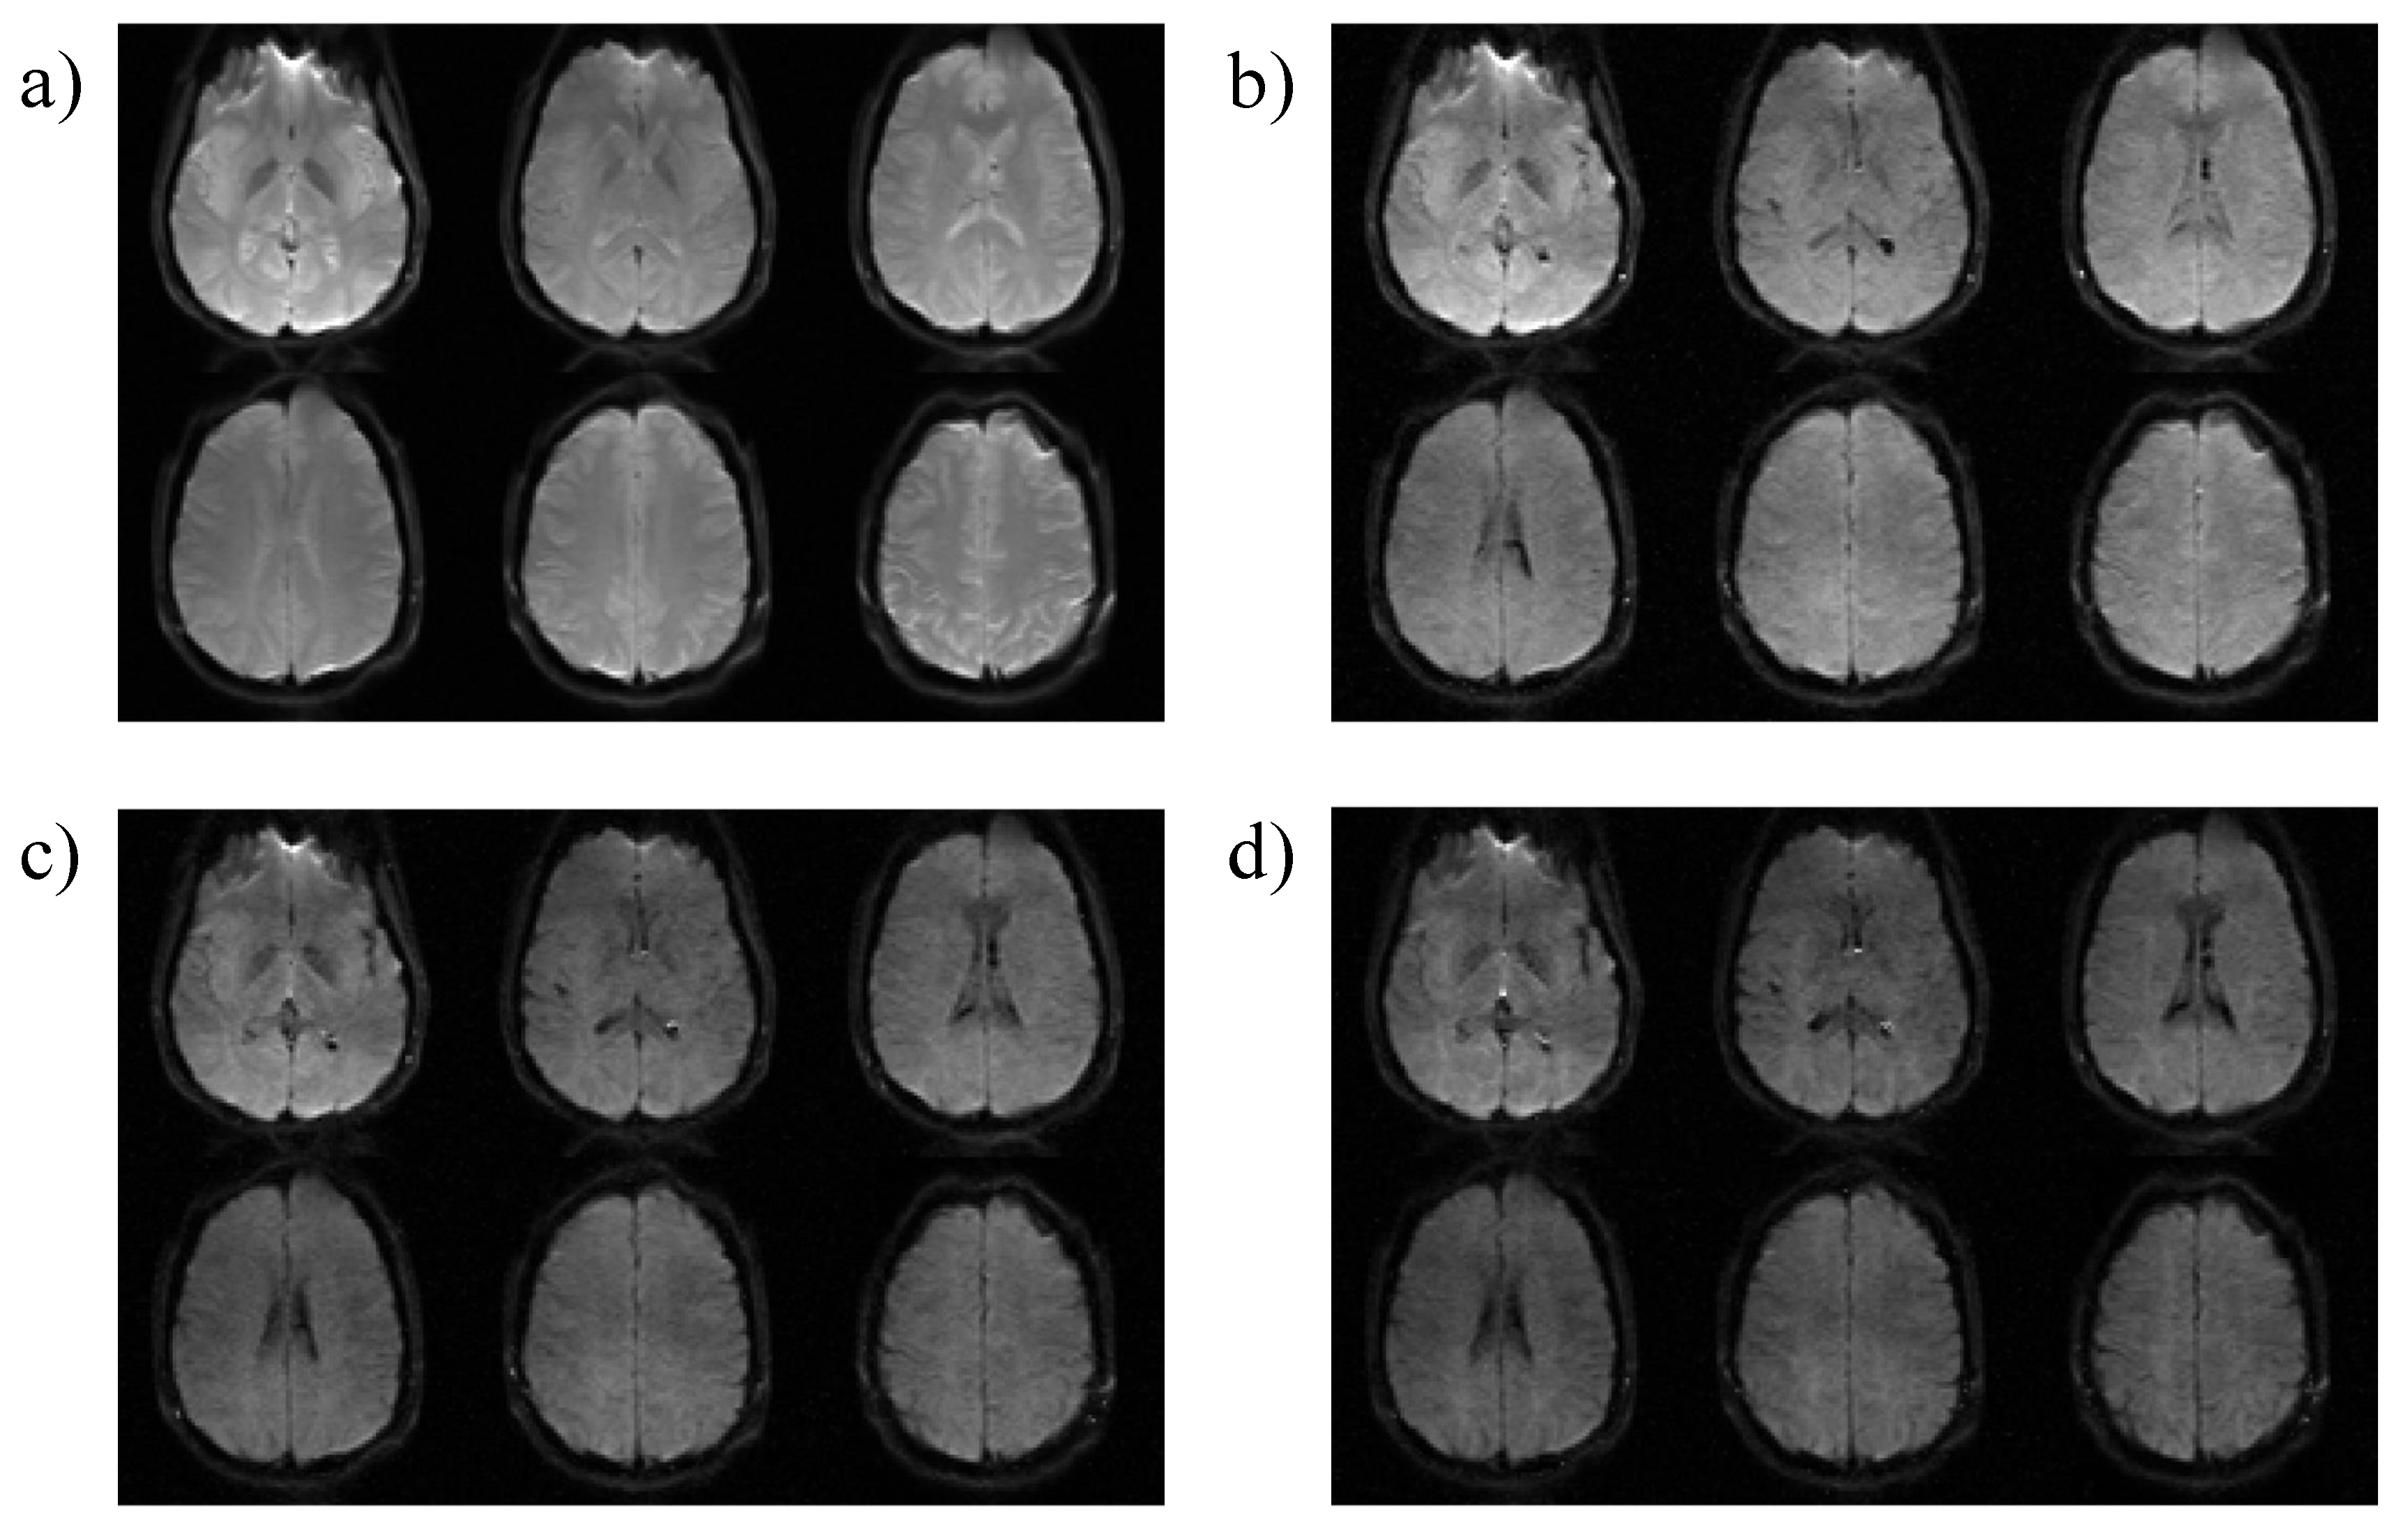
Figure 4. Six contiguous axial diffusion-weighted
images of the brain acquired by the SSMb sequence from a healthy human subject
in one TR (4 s). a): b-value = 16 s/mm2, acquired by ET1
in the SEPI module; b): b-value = 195 s/mm2, c): 364 s/mm2,
and d): 533 s/mm2 acquired by ET2, ET3,
and ET4 in the VFA-STEPI module, respectively. Diffusion
gradients were applied along the right/left direction.

Figure
5. a): A representative brain ADC map estimated from the diffusion-weighted images acquired using the SSMb
sequence. b): A correspodning ADC map produced
by the SE-DWI sequence for comparison. c): ADC histograms from SSMb (orange) and SE-DWI (blue), illustrating a high degree
of consistency. The purple bar
represents the overlapping area.
DOI: https://doi.org/10.58530/2022/1865