1864
Characterization of SNR for radial spin echo imaging1Biomedical Engineering, Tel Aviv University, Tel Aviv, Israel, 2New-York University Langone Medical Center, New York, NY, United States, 3Sagol School of Neuroscience, Tel Aviv University, Tel Aviv, Israel
Synopsis
To optimize the use of radial spin-echo sequences, SNR characterization for relevant T1 and T2 ranges is required. In this work, we studied the interplay between the number of excitations (Nexc) and the turbo factor (NTF - number of echoes within each TR) on the SNR of images acquired using the RAISE (RAdIal Spin Echo) sequence. SNR was evaluated for phantom and in-vivo images. Phantom analysis focused on SNR per T1 and T2 ranges appropriate for known gray and white matter relaxation times. Selected parameter sets were later used for in vivo scans for qualitative evaluation.
Introduction
Radial sampling offers several advantages. One is its relative robustness to motion artifacts. A second advantage is the ability to acquire images at arbitrary field of views (FOVs), i.e., meaning, field of views that are located inside the imaged object, without being affected by aliasing artifacts.1,2 This has the potential to increase protocol flexibility, and reduce scan time, or alternatively increase image resolution while maintaining original scan time. Obtaining high spatial resolution images could benefit many applications, one of them is the imaging of small CNS structures.3,4 To optimize the use of these sequences, SNR characterization for T1 and T2 ranges relevant for brain tissues is required. In this work, we studied the effect of the interplay between the number of excitations (Nexc) and the turbo factor (NTF - number of echoes within each TR) on the SNR of images acquired using the RAISE5 (RAdIal Spin Echo) sequence - a spin-echo T2 weighted protocol. SNR was evaluated for phantom and in vivo images. Phantom analysis focused on SNR per T1 and T2 ranges appropriate for known gray and white matter relaxation times. Parameter sets that produced the maximal evaluated SNR were later used כםר in vivo scans for qualitative evaluation.Methods
All scans were performed on a 3T Siemens Prisma scanner at Tel-Aviv University.Phantom Scans
Phatnom scans were performed using the ISMRM-NIST system phantom6,7. Data were acquired using the RAISE sequence. Scan parameters were: slice thickness=1 mm, matrix size=192x192, voxel size=1x1x1 mm3, TE/TR=10/2200 ms, Nexictations=128/64, Nturbo factor=8/6/4, acquisition BW=430 Hz/Px, Nrepeatitions = 16.
Brain Scans
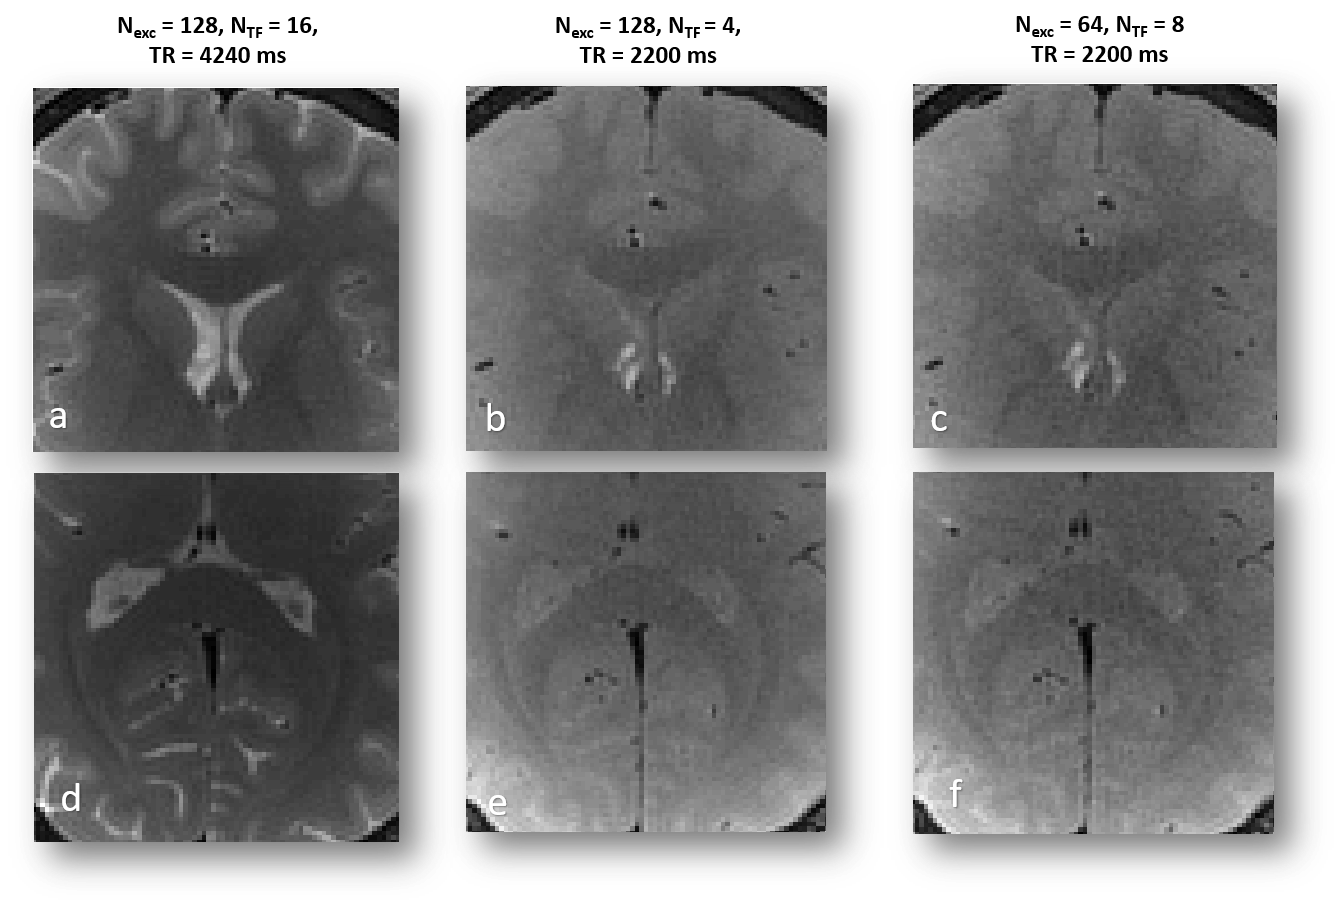
In vivo scans were performed after obtaining informed consent and under the approval of the local Helsinki and ethics committees. Brain imaging was done for two healthy volunteers. Data were acquired using the same RAISE sequence. Scan parameters for the first volunteer (full FOV) were: slice thickness=1 mm, matrix size=192x192, voxel size=1x1x1 mm3, TE/TR=10/2200 ms, Nexc=128/64, NTF=8/6/4, acquisition BW=430 Hz/Px, Nrepeatitions = 1. For the second volunteer, three parameter sets were tested on two different internal FOVs. Common parameters for all scans were: slice thickness=1 mm, matrix size=80x80, voxel size=1x1x1 mm3, TE=10 ms, acquisition BW=430 Hz/Px, Nrepeatitions = 1. Three parameters were changed between scans: TR=4240/2200/2200 ms, Nexc=128/128/64, NTF=16/8/8. TR for the first parameter set was increased because of SAR limitations.
SNR evaluation
SNR was evaluated by performing repeated “identical” acquisitions of the phantom using the gold standard method, according to which the SNR of a single voxel is equal to the ratio between the mean value and the standard deviation of the signal intensity time course.
Statistical analysis
Paired t-test was used to compare the SNR values resulting from applying parameter sets (Nexc=128,NTF=4) and (Nexc=64,NTF=6) for each of the six selected ROIs.
Results
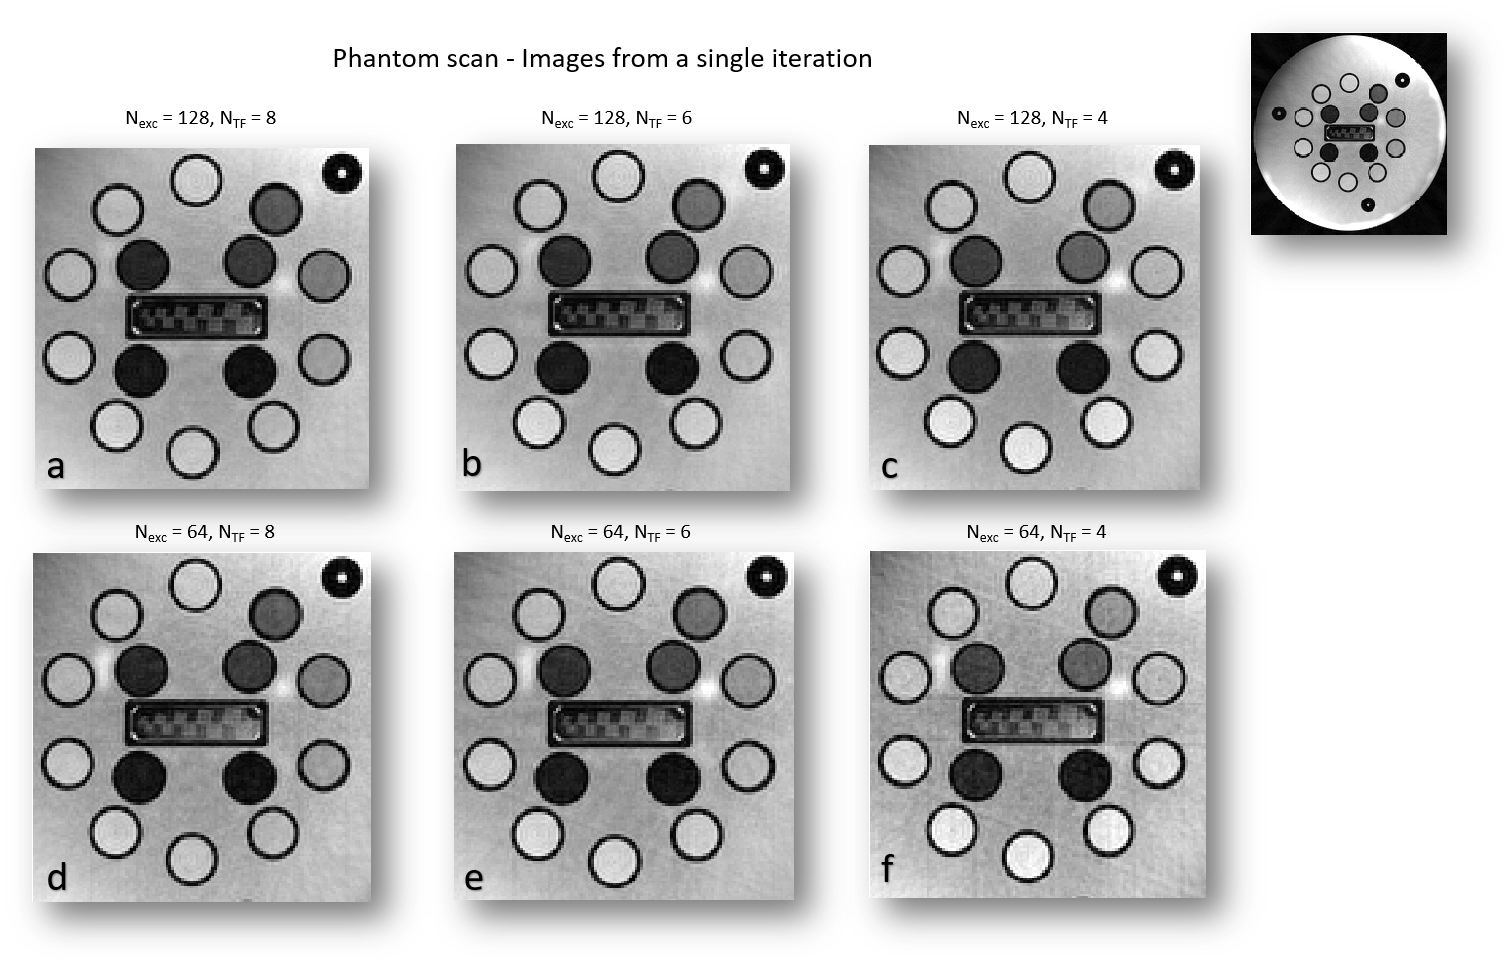
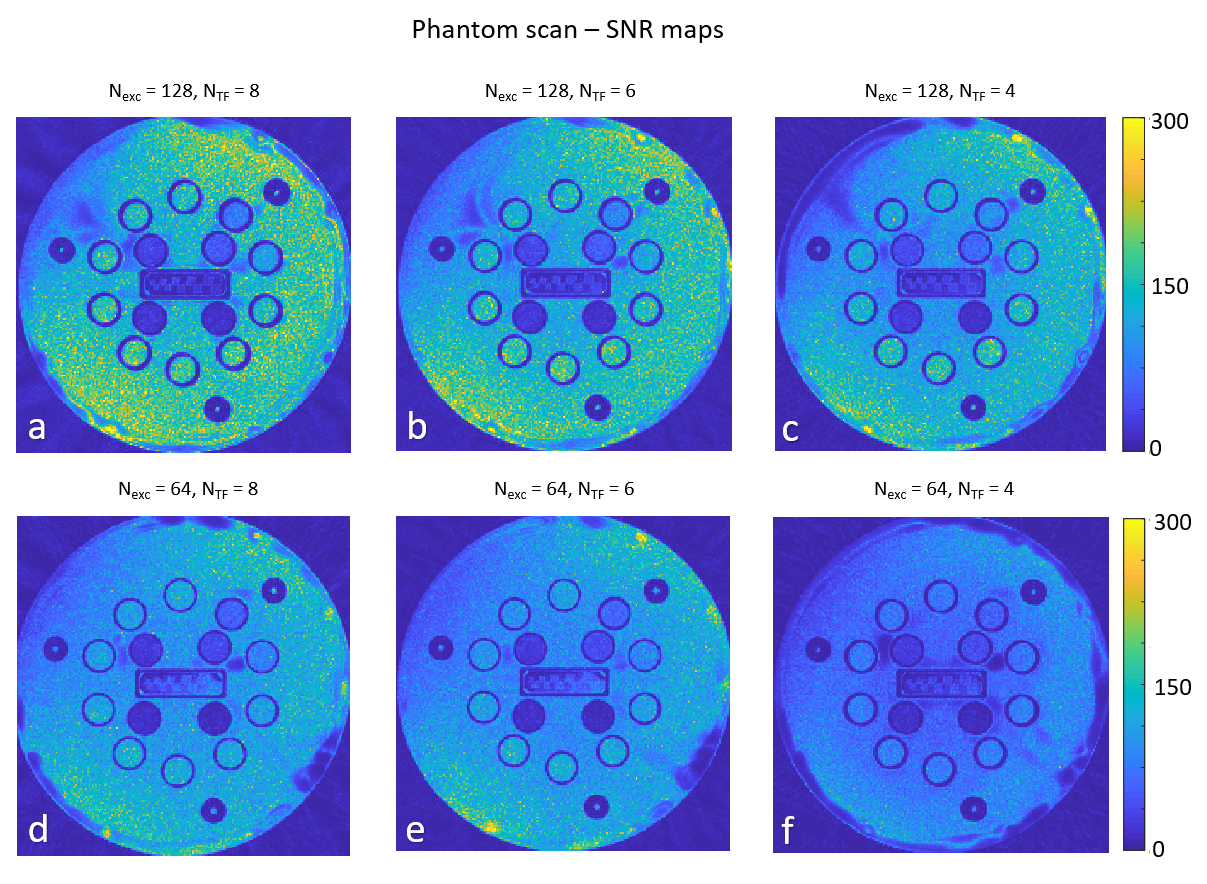
Fig. 1 shows images that were acquired from the first out of 16 iterations performed for each parameter set. Parameter sets vary in the number of excitations (Nexc) and in the Turbo factor (NTF) used. Total number of spokes is equal to (Nexc x NTF).Fig. 2 shows the SNR maps that were evaluated per each parameter set. Generally speaking, SNR decreases as the number of spokes decreases; however, as can be seen when comparing (c) and (d), who were obtained using the same total number of spokes, the balance between Nexc and NTF affects the resulting SNR; the SNR map shown in (c), which was evaluated from images that were acquired with more excitations and a lower turbo factor, generally contains higher values than the SNR map shows in (d), although the number of spokes used is equal in both.
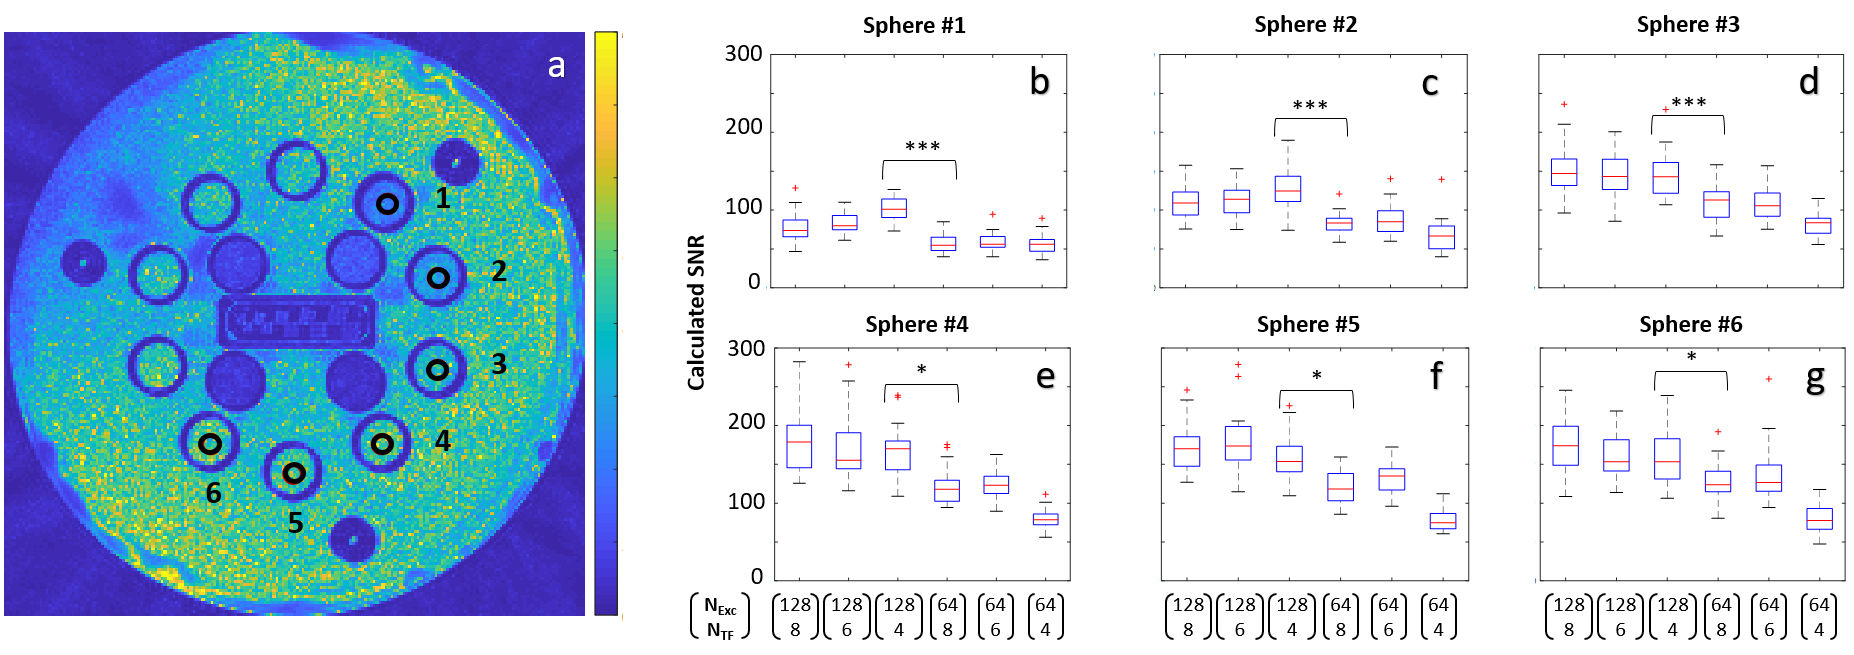
Fig 3a shows marked ROIs for six selected spheres (reference T1\T2 values: sphere 1 – 503.30/33.25 ms, sphere 2 - 703.51/49.26 ms, sphere 3 – 937.12/70.57 ms, sphere 4 – 1202.40/99.89 ms, sphere 5 – 1774.24/188.16 ms, sphere 6 - 1801.61/192.23 ms). Fig. 3b – 3g show SNR Measurements for the selected spheres, per each parameter set.
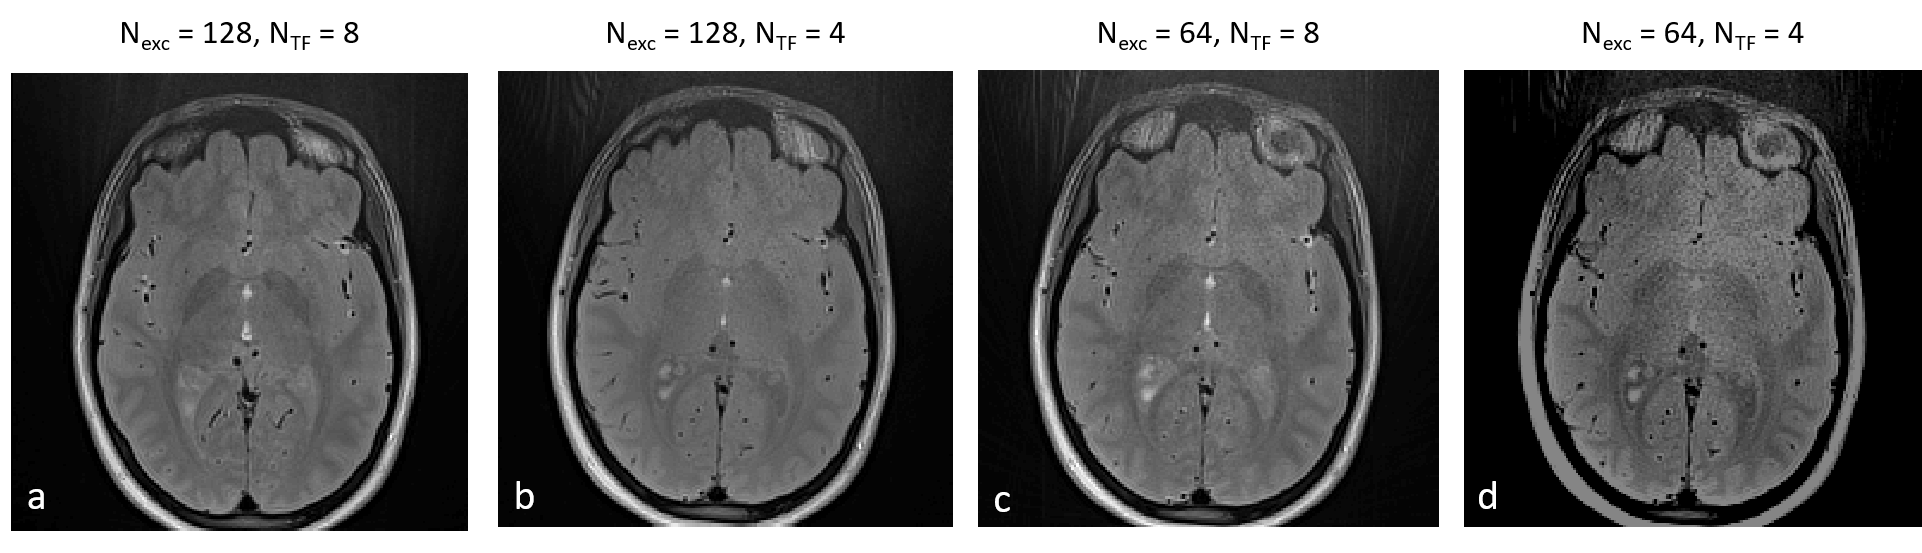
In vivo demonstration of selected parameter sets can be seen in Fig. 4 and in Fig. 5. Fig. 4 shows a demonstration of a full FOV in vivo brain scans using four parameter sets. Fig. 5 presents images from two partial FOV in vivo brain scans using three tested parameter sets. The six pairs of SNR value groups resulting from applying parameter sets (Nexc=128,NTF=4) and (Nexc=64,NTF=6) for each of the six selected ROIs were found to be significantly different (p-value < 0.0005 for all pairs).
Discussion
Several aspects should be taken into consideration when determining scan parameters for RAISE. High SAR levels and long scan times are limiting factors on the way to achieve high quality images. Increasing Nexc increases SNR, but also linearly increases scan time. Increasing NTF has the potential to increase SNR (but not always, as can be seen in fig. 3b-c), and also to achieve better T2 contrast and produce heavily T2-weighted images thanks to the participation of later echoes (as seen in fig. 5a, 5d). However, increasing the turbo factor costs in SAR, which can be translated into again an increase in scan time. Further work is required to test SNR dependence in additional parameters, such as acquisition bandwidth and partition order.Acknowledgements
No acknowledgement found.References
1. Block KT, Chandarana H, Milla S, et al. Towards Routine Clinical Use of Radial Stack-of-Stars 3D Gradient-Echo Sequences for Reducing Motion Sensitivity. 2014;18(2):87-106.
2. Block KT. Advanced Methods for Radial Data Sampling in Magnetic Resonance Imaging Dissertation. 2008.
3. Trampel R, Bazin PL, Pine K, Weiskopf N. In-vivo magnetic resonance imaging (MRI) of laminae in the human cortex. Neuroimage. 2019;197(April 2017):707-715. doi:10.1016/j.neuroimage.2017.09.037
4. Li Z, Chen YA, Chow D, Talbott J, Glastonbury C, Shah V. Practical applications of CISS MRI in spine imaging. Eur J Radiol Open. 2019;6(May):231-242. doi:10.1016/j.ejro.2019.06.001
5. Ben-Eliezer N, Sodickson DK, Shepherd T, Wiggins GC, Block KT. Accelerated and motion-robust in vivo T 2 mapping from radially undersampled data using bloch-simulation-based iterative reconstruction. Magn Reson Med. 2016;75(3):1346-1354. doi:10.1002/mrm.25558
6. Keenan KE, Biller JR, Delfino JG, et al. Recommendations towards standards for quantitative MRI (qMRI) and outstanding needs. J Magn Reson Imaging. 2019;49(7):e26-e39. doi:10.1002/jmri.26598
7. Russek SE, Boss MA, Jackson EF, et al. Characterization of NIST/ISMRM MRI System Phantom. in Proceedings of the 20th meeting of the International Society of Magnetic Resonance in Medicine, Melbourne, Australia 2012
Figures