1857
Anti-angiogenic therapy in recurrent glioblastoma uncouples tumor hyperperfusion measures from spectroscopic measures of Lac/c-Cr1Neurosurgery, Massachusetts General Hospital, Boston, MA, United States, 2A. A. Martinos Center for Biomedical Imaging, Charlestown, MA, United States, 3Radiology, Massachusetts General Hospital, Boston, MA, United States, 4Neuroradiology, Massachusetts General Hospital, Boston, MA, United States, 5Neuro-oncology, Massachusetts General Hospital, Boston, MA, United States
Synopsis
Patients with recurrent glioblastoma (rGBM) are often started on anti-angiogenic therapy, making it challenging to determine disease progression with standard MR methods. We performed a prospective analysis on 14 patients with rGBM utilizing MR spectroscopy and DSC-perfusion imaging to investigate metabolic changes before and 4 weeks after anti-angiogenic therapy. We found that anti-angiogenic therapy significantly decreases relative tumor hyperperfusion values of CBV and CBF and uncouples a correlation between CBV and CBF with Lac/c-Cr. Baseline hyperperfusion values can stratify longer-term from shorter-term survivors at nine months. Further investigation into the early stages of anti-angiogenic therapy are warranted.
Introduction
Glioblastoma (GBM) is an aggressive primary central nervous system (CNS) tumor without a cure. Patients with recurrence are often started on anti-angiogenic therapy such as bevacizumab, a humanized monoclonal antibody targeting soluble vascular endothelial growth factor, which is associated with decreased contrast enhancement via vascular pruning or normalization1. While this therapy has been shown to improve progression free but not overall survival2,3, it remains challenging to detect tumor progression by standard MR imaging methods. The purpose of this longitudinal study was to investigate early metabolic changes after starting anti-angiogenic therapy via MR spectroscopy measures of tumor growth (ie, lactate or choline normalized to creatine in contralateral normal appearing white matter (Lac/c-Cr, Cho/c-Cr)) and correlate with tumor hemodynamics derived from perfusion imaging.Methods
14 patients (mean age: 63.2 years, range 54-75 years, 8 male) had serial MR spectroscopy and perfusion imaging before and 4 weeks after anti-angiogenic therapy was started. The MR spectroscopic imaging protocol include a 3D LASER (localization by adiabatic selective refocusing) sequence on a 3T Siemens scanner or a 2D PRESS (point resolved spectroscopy) with phase encoding sequence on a 1.5T GE scanner (TE= 135 ms, TR=1700/1500 ms, Siemens resolution = 1 cc, acquisition time = 7 min; GE resolution = 1.44 cc, acquisition time = 8 min). Post-processing was completed using LCModel 6.3 with pre-defined basis sets.These patients also underwent dynamic susceptibility contrast (DSC) MR perfusion imaging. After intravenous injection of 0.1 mmol/kg of a gadolinium-containing contrast agent, serial imaging was acquired with the following parameters: TR= 1500 ms, TE = 40/30 ms (GE/Siemens), FOV= 220x220 mm2, matrix = 128x128, slice thickness = 5 mm, and slice gap = 1 mm. DSC imaging was processed using NordicIce to generate leakage-corrected relative cerebral blood volume (rCBV), cerebral blood flow (rCBF), and mean transit time (MTT). Enhancing regions were outlined on high resolution T1-weighted images using 3D Slicer. Given the known tumor heterogeneity in glioblastoma, the hyperperfusion region was selected as described others4,5 using an average of the highest ten perfusion voxel values within the enhancing area.
The area under the ROC curve analysis was used to determine predictors of survivorship at 9 months in relation to the perfusion and spectroscopic measurements.
Results
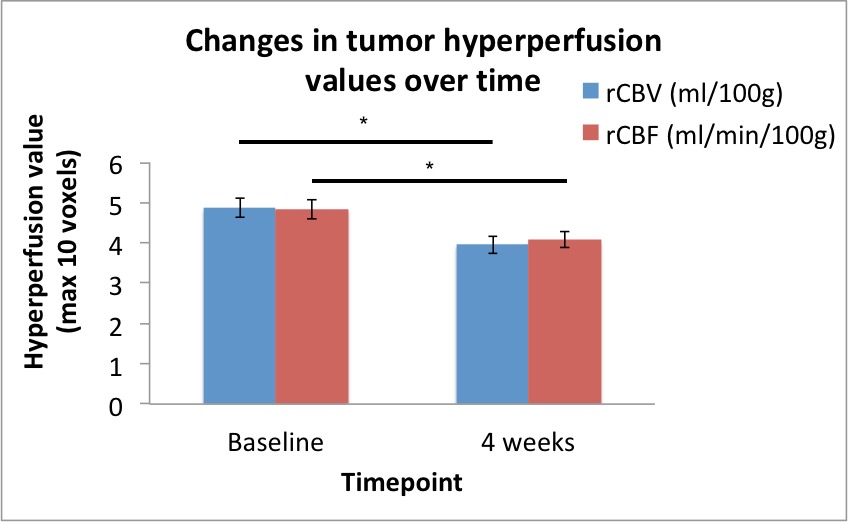
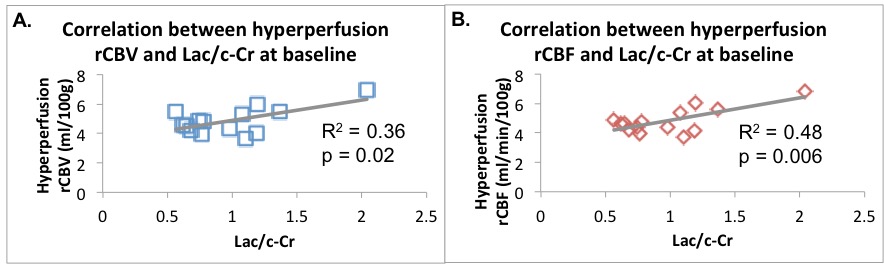
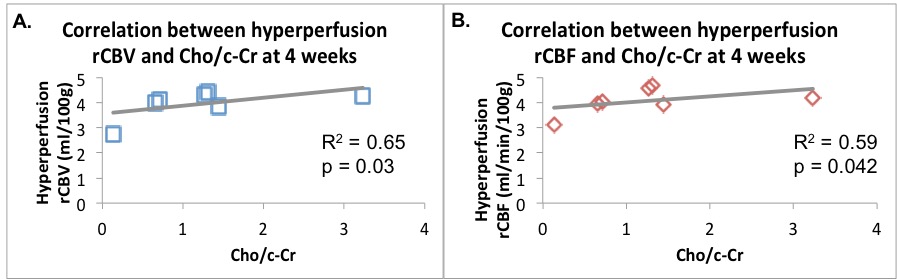
Following anti-angiogenic therapy, there was a significant decrease in rCBV and rCBF (p = 0.006 and p = 0.009, respectively, Figure 1). There were no significant group differences in timepoints for MTT (p = 0.28) or MR spectroscopic measures of Lac/c-Cr (p = 0.38). There was a trend towards increased Cho/c-Cr at 4 weeks (p = 0.055).At baseline, there was a significant positive correlation between the Lac/c-Cr and rCBV (p = 0.022, Figure 2A) and rCBF (p = 0.006, Figure 2B) but not MTT (p = 0.37) across all patients. There was no correlation between perfusion parameters and Choline (Cho)/c-Cr (all p > 0.73). Four weeks after starting anti-angiogenic therapy, a correlation between Lac/c-Cr and rCBV or rCBF (p = 0.20 and 0.29, respectively) could no longer be detected across all patients. Interestingly there was a trend towards positive correlation between Lac/c-Cr and MTT (p = 0.06). Furthermore, there was a significant positive correlation between rCBV and rCBF with Cho/c-Cr (p = 0.030 and p= 0.042, respectively, Figure 3) and only a trend between Cho/c-Cr and MTT (p = 0.088) across all patients.
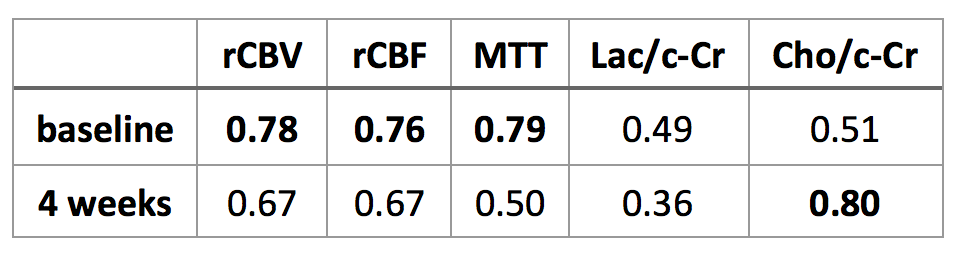
With respect to survivorship analysis, we found that the hemodynamic parameters of rCBV, rCBF, and MTT were able to stratify patients who survived past 9 months prior to bevacizumab-based therapy initiation (AUCs 0.76-0.79, Table 1). Only intratumoral levels of Cho/c-Cr at the 4 week timepoint were able to stratify patients based on 9 month survivorship (AUC 0.80, Table 1).
Discussion
Intratumoral hyperperfusion parameters of rCBV and rCBF correlate significantly with MR spectroscopy measures of Lac/c-Cr at baseline, suggesting a tight coupling between tumor growth/metabolism and perfusion demands. However, after anti-angiogenic therapy is initiated, there is an uncoupling between these perfusion parameters and Lac/c-Cr, likely due to the effect of bevacizumab on tumor vasculature. The positive trend between MTT, a marker of tumor hypoxia, and Lac/c-Cr at 4 weeks, merits further follow up in larger samples to determine its significance after initiating anti-angiogenic therapy due to changes in physiology. The correlation between rCBV and rCBF with Cho/c-Cr suggests ongoing hyperperfusion needs in the setting of high cell membrane turnover. Finally, AUC analyses suggest that baseline hyperperfusion levels of the tumor (rCBV, rCBF, MTT) can stratify 9 month longer-term and shorter-term survivors; 4 weeks after starting anti-angiogenic therapy, Cho/c-Cr is also able to stratify longer-term from shorter-term survivors.Conclusion
Anti-angiogenic therapy can result in uncoupling of perfusion and MR-spectroscopic measures of lactate. Larger studies integrating multi-modal imaging data are needed to better understand the complex dynamics between tumor perfusion and metabolism in the early stages of anti-angiogenic therapy initiation.Acknowledgements
This work would not be possible without the patients and their families, participating MGH Neuro-oncologists, MGH Cancer Center and Radiology staff, and Quantitative Tumor Imaging staff. This study was supported by the National Institutes of Health R01CA190901 to E.M.R.References
1. Goel S, Wong AH, and Jain RK. Vascular normalization as a therapeutic strategy for malignant and nonmalignant disease. Cold Spring Harb Perspect Med. 2012;2(3).
2. Mahase S, Rattenni RN, Wesseling P, et al. . Hypoxia-mediated mechanisms associated with antiangiogenic treatment resistance in glioblastomas. Am J Pathol. 2017;187(5):940–953.
3. Norden AD, Young GS, Setayesh K, et al. . Bevacizumab for recurrent malignant gliomas: efficacy, toxicity, and patterns of recurrence. Neurology. 2008;70(10):779–787.
4. Singh R, Kesavabhotla K, Kishore SA, Zhou Z, Tsiouris AJ, Filippi CG, Boockvar JA, and Kovanlikaya I. Dynamic susceptibility contrast-enhanced MR perfusion imaging in assessing recurrent glioblastoma response in superselective intra-arterial bevacizumab therapy. AJNR 2016;37:1838-43.
5. Sawlani R, Raizer J, Horowitz SW, Shin W, Grimm S, Chandler J, Levy R, Getch C, and Carroll T. Glioblastoma: A method for predicting response to antiangiogenic chemotherapy by using MR Perfusion imaging—pilot study. Radiology 2010; 255:622-628.
Figures