1856
The BigMac dataset: interconnecting MR signals with microstructure profiles in the cortex
Amy FD Howard1, Istvan N Huszar1, Michiel Cottaar1, Greg Daubney2, Alexandre A Khrapitchev3, Rogier B Mars1,4, Jeroen Mollink1, Lea Roumazeilles2, Connor Scott5, Adele Smart5, Jerome Sallet2, Saad Jbabdi1, and Karla L Miller1
1Wellcome Centre for Integrative Neuroimaging (FMRIB), Nuffield Department of Clinical Neurosciences, University of Oxford, Oxford, United Kingdom, 2Wellcome Centre for Integrative Neuroimaging, Experimental Psychology, Medical Sciences Division, University of Oxford, Oxford, United Kingdom, 3MRC Oxford Institute for Radiation Oncology, Department of Oncology, University of Oxford, Oxford, United Kingdom, 4Donders Institute for Brain, Cognition and Behaviour, Radboud University Nijmegen, Nijmegen, Netherlands, 5Nuffield Department of Clinical Neurosciences, University of Oxford, Oxford, United Kingdom
1Wellcome Centre for Integrative Neuroimaging (FMRIB), Nuffield Department of Clinical Neurosciences, University of Oxford, Oxford, United Kingdom, 2Wellcome Centre for Integrative Neuroimaging, Experimental Psychology, Medical Sciences Division, University of Oxford, Oxford, United Kingdom, 3MRC Oxford Institute for Radiation Oncology, Department of Oncology, University of Oxford, Oxford, United Kingdom, 4Donders Institute for Brain, Cognition and Behaviour, Radboud University Nijmegen, Nijmegen, Netherlands, 5Nuffield Department of Clinical Neurosciences, University of Oxford, Oxford, United Kingdom
Synopsis
Microscopy data can provide detailed descriptions of how cortical microstructure varies across the brain. However, the relationship between cortical microstructure and MRI signals remains relatively unexplored. Here we develop a pipeline to extract cortical profiles from co-registered MRI and microscopy data in the BigMac dataset. We compare cortical profiles of cell density and microstructural dispersion from Nissl-stained histology slides with matched profiles from structural and diffusion MRI. Using CCA we find modes of microstructure variation common to microscopy and structural MRI, but not diffusion, indicating variable sensitivity of the MR metrics to brain-wide variations in Nissl-stained cytoarchitecture.
Introduction
The BigMac dataset is a multimodal resource combining invivo MRI with extensive postmortem MRI and microscopy in a single macaque brain. Upon publication, the BigMac data and tools will be made openly available through the Digital Brain Bank1. Where previous work2,3 focused on understanding myeloarchitecture, relating diffusion MRI to myelin-sensitive microscopy, here we develop a pipeline for meaningful MRI-microscopy comparisons in the cortex. In particular, we present the first analyses of BigMac Nissl-stained histology slides, which provide rich information about the density of cell bodies across cortical layers.Our method is inspired by the recent work in humans by Paquola et al.4 who utilise the natural organisation of the cortex to compare microstructural profiles sampled in the direction of cortical columns. This is a powerful method for multimodal comparisons, as the cortical profiles provide both a rich description of the data and a common axis along which MRI and microscopy data can be meaningfully compared.
Here we develop a pipeline to extract cortical profiles from MRI and microscopy data in the BigMac dataset. To demonstrate its utility, we compare cortical profiles from Nissl-stained histology with matched profiles from structural and diffusion MRI. We find sensitivity of structural MRI but not the diffusion metrics to brain-wide variations in Nissl-stained microstructure.
Data acquisition and methods
Postmortem MRI data were acquired at 7T, including a structural MRI (MGE, 0.3mm isotropic), and diffusion MRI (DW-SE, b=4ms/μm2, 0.6mm isotropic, $$$\delta/\Delta$$$=7/13 ms & b=7,10 ms/μm2, 1.0mm isotropic, $$$\delta/\Delta$$$=14/24 ms). After scanning, the brain was sectioned along the rostro-caudal axis and processed for microscopy. To visualise cell bodies (Nissl), Cresyl violet staining was performed on 50μm thick sections that were 350μm apart, with full brain coverage. The histology slides were imaged with a digital slide scanner (Leica) at a resolution of ~0.3 μm/pix.MRI-histology coregistration was performed using FSL’s TIRL5, and MRI-MRI registrations using FSL’s FLIRT/FNIRT6,7,8. The warpfields were then combined to facilitate precise mapping between the diffusion, structural and histology data.
The histology images were processed using structure tensor analysis9 to extract an estimate of microstructural dispersion over a superpixel of 50x50μm. The mean RGB value per superpixel was also calculated and converted to greyscale, to give an approximate measure of stain density. This metric was validated against a more quantitative estimate of stained area fraction calculated using QuPath cell segmentation10.
Pial and white matter surfaces were generated from the structural MRI using a modified version of precon_all11, a Freesurfer-based pipeline for macaque surface reconstruction12. 21 equidistant surfaces were then generated between the pial and white matter surface. This resulted in a series of matched vertices which together described a set of profiles across the cortex (Figure 1).
Using TIRL5, the vertices were then mapped onto each histology slide in turn. Profiles with a surface normal > 40o from the histology plane were excluded, as were profiles in subcortical tissue. MRI and microscopy data were then sampled along these vertices. Here we analyse only the left hemisphere, resulting in >280,000 cortical profiles being extracted per MRI/microscopy contrast.
In this preliminary analysis, we compare cortical profiles from Nissl-stained histology (stain density and ODI) with matched profiles extracted from a structural MRI, DTI values of FA and MD (b=4 ms/μm2, 0.6mm isotropic), and a spherical harmonics representation of the diffusion signal (single shell, b=4ms/μm2, 0.6mm isotropic and multishell b=7,10ms/μm2, 1mm isotropic). For the latter, the signal was first rotated such that DTI V1 and V2 were aligned across voxels, where V1 was seen to closely align with the white matter surface normal.
Results
Figure 1 shows the successful mapping of cortical profiles onto the microscopy plane, alongside example profiles from microscopy and MRI.Figure 2 validates use of the downsampled histology data, by comparing it with a more quantitative but computationally expensive map of cellular stained area fraction. The information is similar across the two methods.
Figure 3 shows the principal components of variation in the microscopy profiles. The first Nissl component shows clear separation of frontal/occipital and parietal/temporal areas.
Figure 4 correlates the average MRI and microscopy profiles from each ROI of the CHARM-3 atlas13,14. Where structural MRI is seen to consistently correlate with Nissl ODI and anti-correlate with Nissl staining, the diffusion measures show less consistent patterns. This is suggestive of a more complex relationship and demonstrates pitfalls in validation studies which compare metrics across a limited ROI without whole brain analysis.
Figure 5 uses a combination of principal component analysis and canonical correlation analysis to look for common modes of microstructure variation across the brain. We find a common axis of variation across the Nissl and structural MRI (r=0.48), in line with previous results in the human4. Diffusion metrics show a weak correlation with the microscopy metrics (r=<0.15).
Together Figures 4 and 5 suggest that, though diffusion metrics can correlate with microscopy measures on an ROI basis (Figure 4), they lack sensitivity to brain-wide variations in Nissl-stained microstructure (Figure 5).
Future work
Future work will focus on extracting richer and more microstructurally specific profiles from the full range of data in BigMac. This includes myelin-stained slides, polarised light imaging, spherically encoded diffusion data, T1 maps and invivo functional MRI in the same animal.Acknowledgements
AFDH and INH were supported by the EPSRC and MRC (grants EP/L016052/1 and MR/L009013/1). AK was funded by CRUK (grant C5255/A15935). The work of RBM is supported by BBSRC UK [BB/N019814/1]. JS was supported by a Sir Henry Dale Wellcome Trust Fellowship (105651/Z/14/Z). KLM, SJ, AFDH and INH were supported by the Wellcome Trust (grants WT202788/Z/16/A, WT221933/Z/20/Z and WT215573/Z/19/Z). The Wellcome Centre for Integrative Neuroimaging is supported by core funding from the Wellcome Trust (203139/Z/16/Z). SJ and KM contributed equally to this work.References
- Tendler BC, et al. The Digital Brain Bank, an open access platform for post-mortem datasets, bioRxiv, 2021.
- Howard AFD, et al. The BigMac dataset: ultra-high angular resolution diffusion imaging and multi-contrast microscopy of a whole macaque brain, ISMRM 27th Annual Meeting, 2019.
- Howard AFD, et al. The microscopy connectome: towards 3D PLI tractography in the BigMac dataset, ISMRM 29th Annual Meeting, 2021.
- Paquola C, et al. Microstructural and functional gradients are increasingly dissociated in transmodal cortices. PLoS Biol 17(5): e3000284, 2019.
- Huszar IN, et al. Tensor Image Registration Library: Automated Non-Linear Registration of Sparsely Sampled Histological Specimens to Post-Mortem MRI of the Whole Human Brain, bioRxiv, 2019.
- Jenkinson M & Smith SM, A global optimisation method for robust affine registration of brain images. Medical Image Analysis, 5(2):143-156, 2001.
- Jenkinson, M, et al. Improved optimisation for the robust and accurate linear registration and motion correction of brain images. NeuroImage, 17(2):825-841, 2002.
Andersson JLR, et al. Non-linear registration, aka spatial normalisation, FMRIB technical report TR07JA2, 2010. - Budde MD & Frank JA, Examining brain microstructure using structure tensor analysis of histological sections, Neuroimage, 63(1):1-10, 2012.
- Bankhead, P. et al. QuPath: Open source software for digital pathology image analysis. Scientific Reports 7:16878, 2017.
- Benn, RA, et al. Precon_all: a preclinical cortical surface generation pipeline for animal brains, in preparation https://github.com/neurabenn/precon_all.
- Fischl, B. Freesurfer, Neuroimage, 62(2):774-781 2012.
- Jung, B, et al. A comprehensive macaque fMRI pipeline and hierarchical atlas, NeuroImage, 235:117997, 2021.
- Reveley C, et al. Three-Dimensional Digital Template Atlas of the Macaque Brain. Cereb Cortex, 27(9):4463-4477, 2017.
Figures
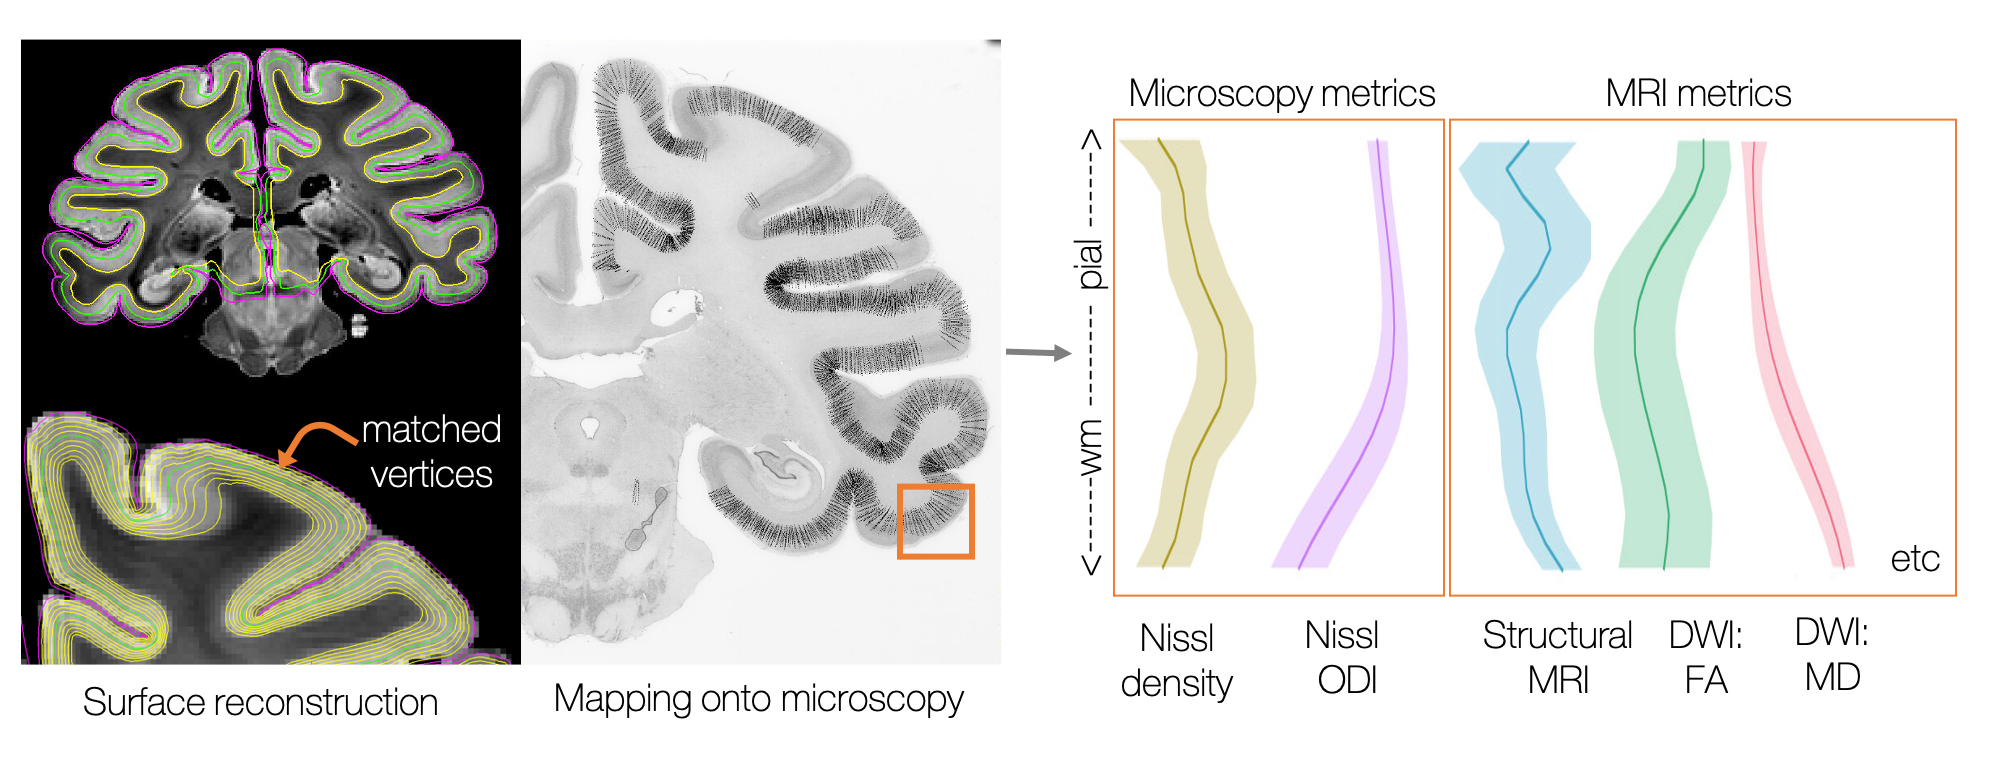
Extracting cortical profiles from MRI and microscopy. A series of 21 equidistant surfaces were generated using Freesurfer12 and mapped onto the microscopy plane. Various MRI and microscopy metrics were sampled along these profiles, providing rich information about cortical microstructure and a common axis for multimodal comparisons.
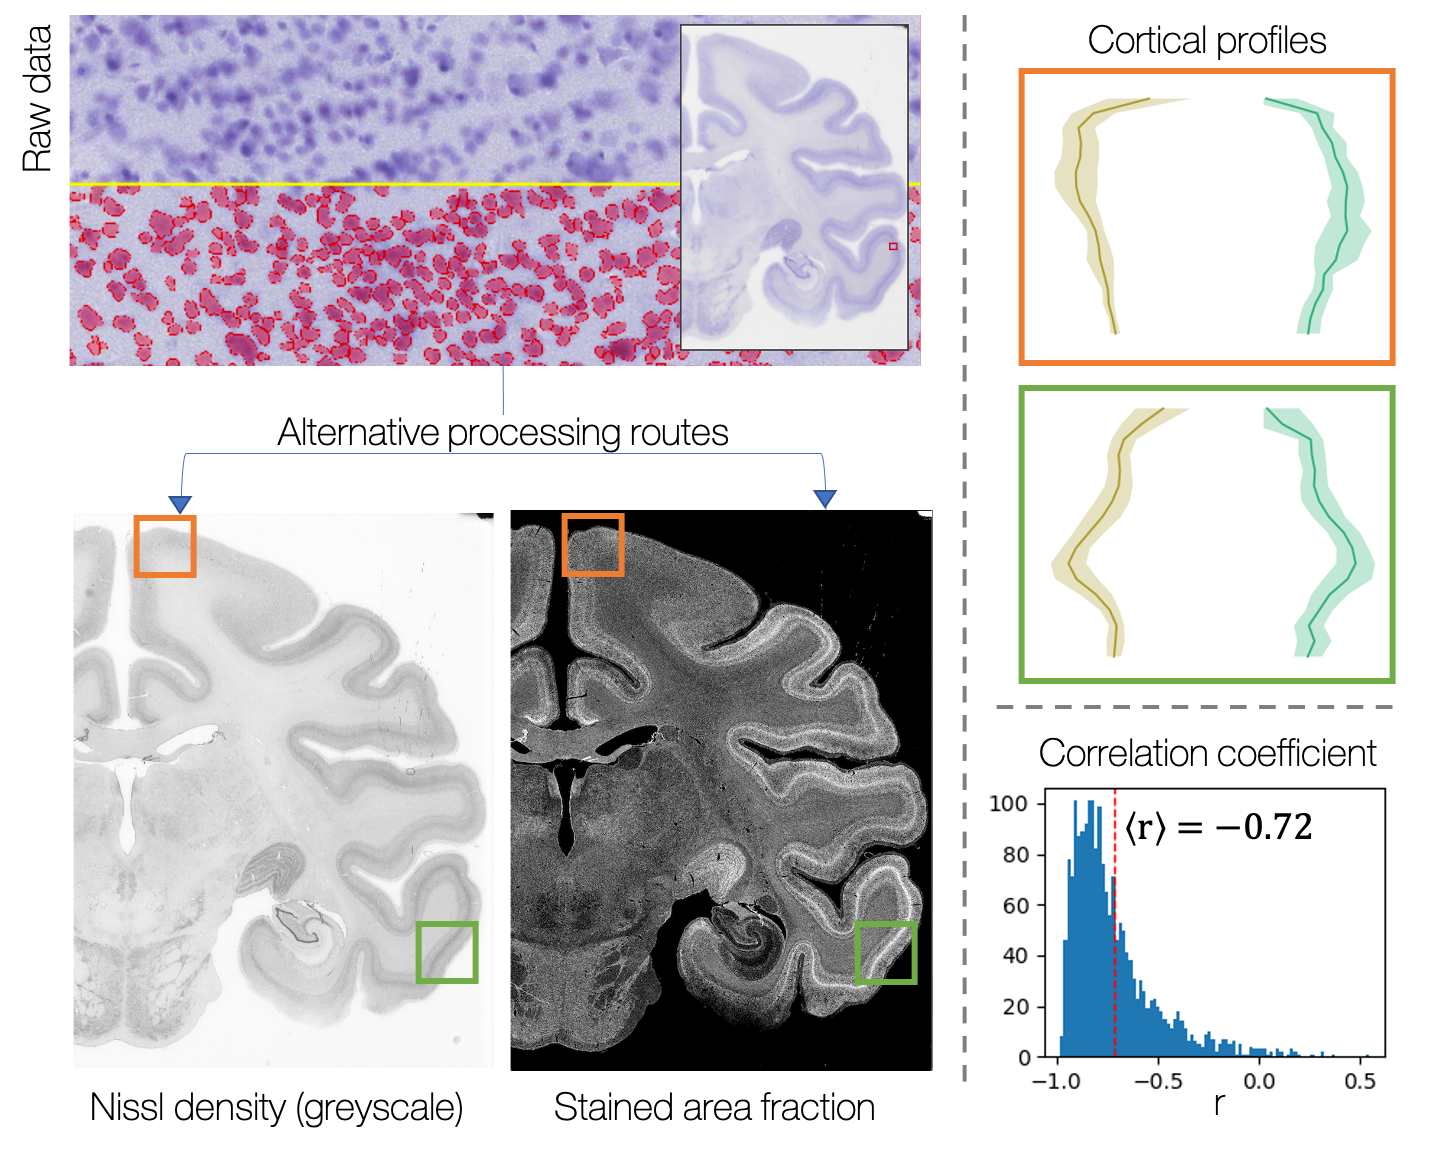
Downsampled greyscale Nissl data, a proxy for Nissl density, is compared to a more quantitative but computationally expensive stained area fraction map generated using QuPath cell segmentation. First, we examine profiles from two cortical regions (orange / green ROIs), chosen based on their differences in cortical layer structure. Profiles from both regions show clear sensitivity to cortical layers. Second, we correlate ~1900 profiles from across the histology slide. The greyscale and stained-area fraction profiles anti-correlate with a mean correlation coefficient of -0.72.
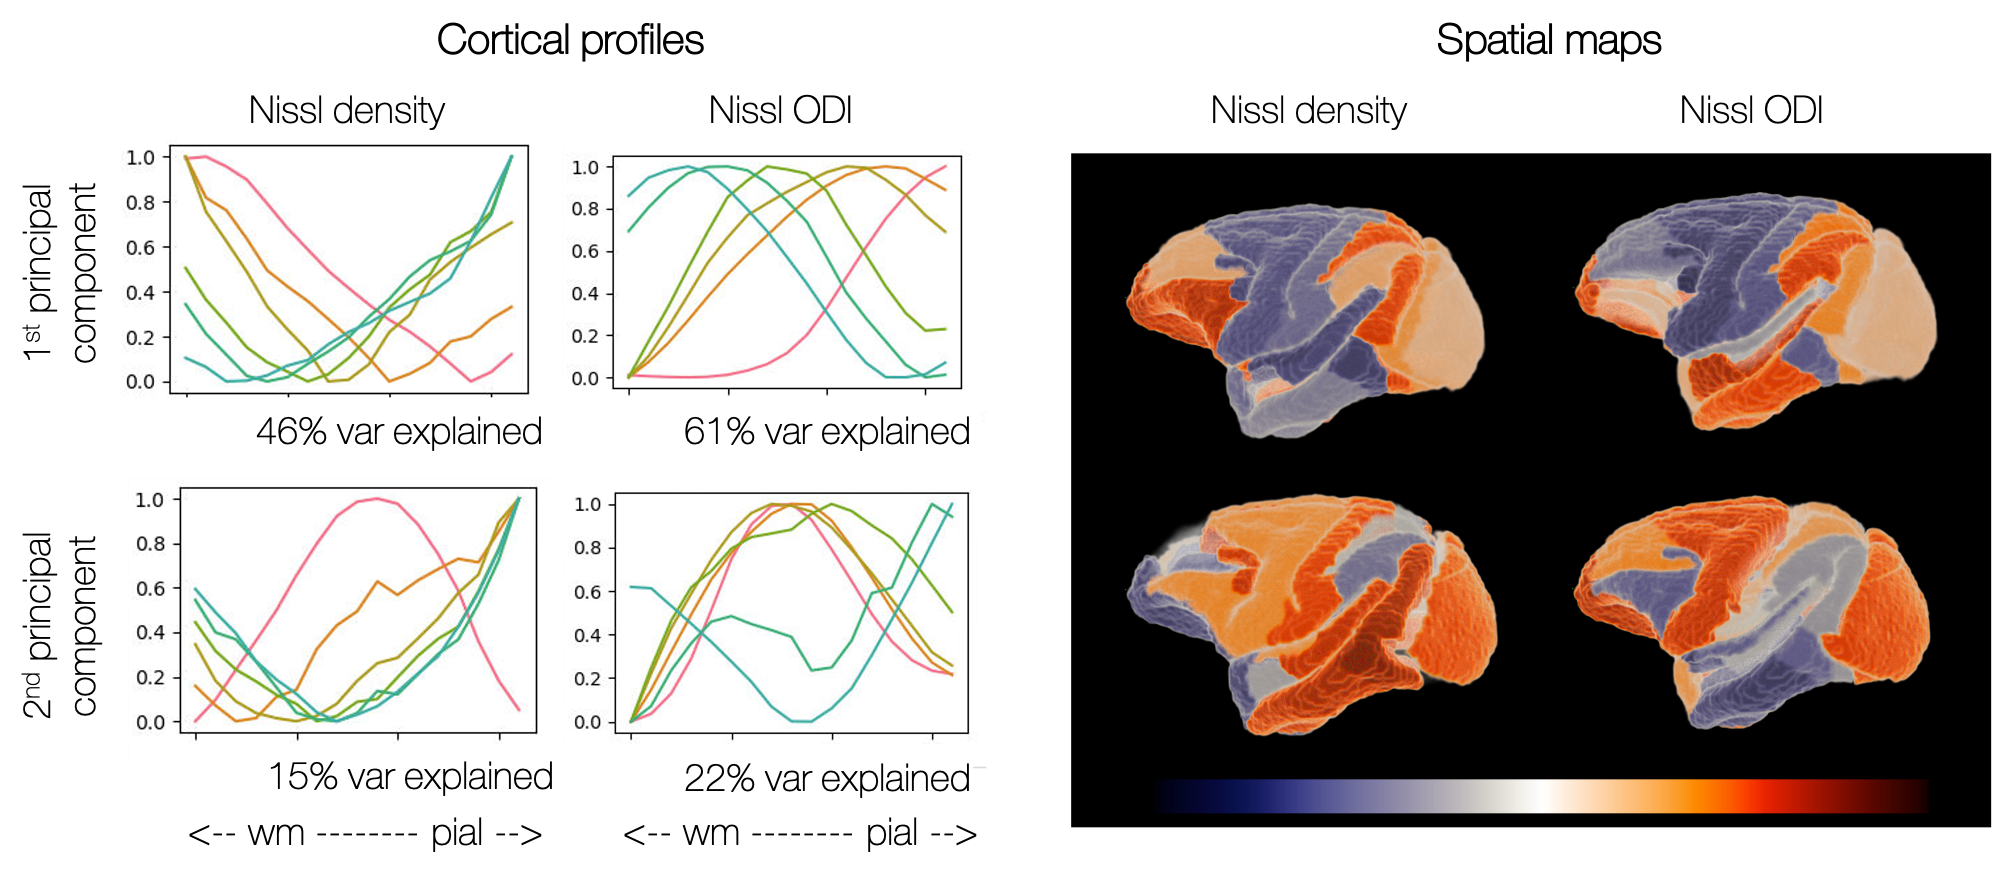
The principal components (PCs) describing variation in the cortical profiles from Nissl-stained microscopy data. Left: How cortical profiles vary along each component. We plot the average profile within bins determined by the PC coefficient. Right: The PCs are mapped back onto the CHARM-3 atlas13,14, where here we show the mean PC coefficient within each ROI.
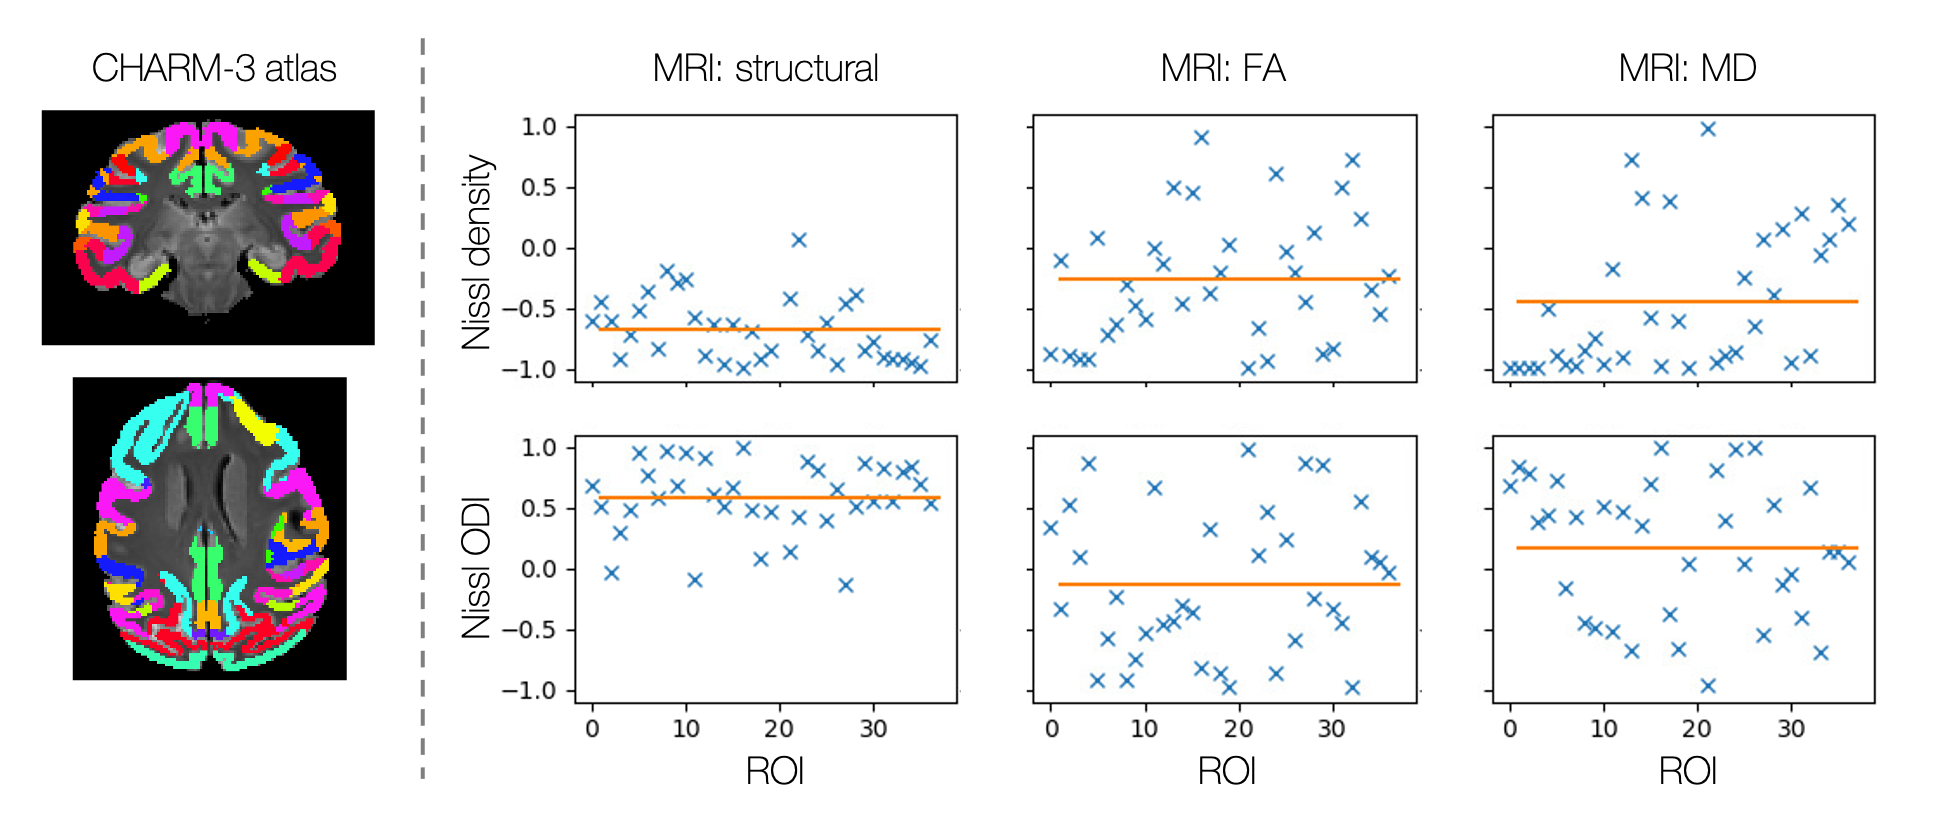
Correlating MRI and microscopy profiles across regions of interest defined by the CHARM-3 atlas13,14. The y-axis gives the correlation coefficient and the orange bar
indicates the mean.
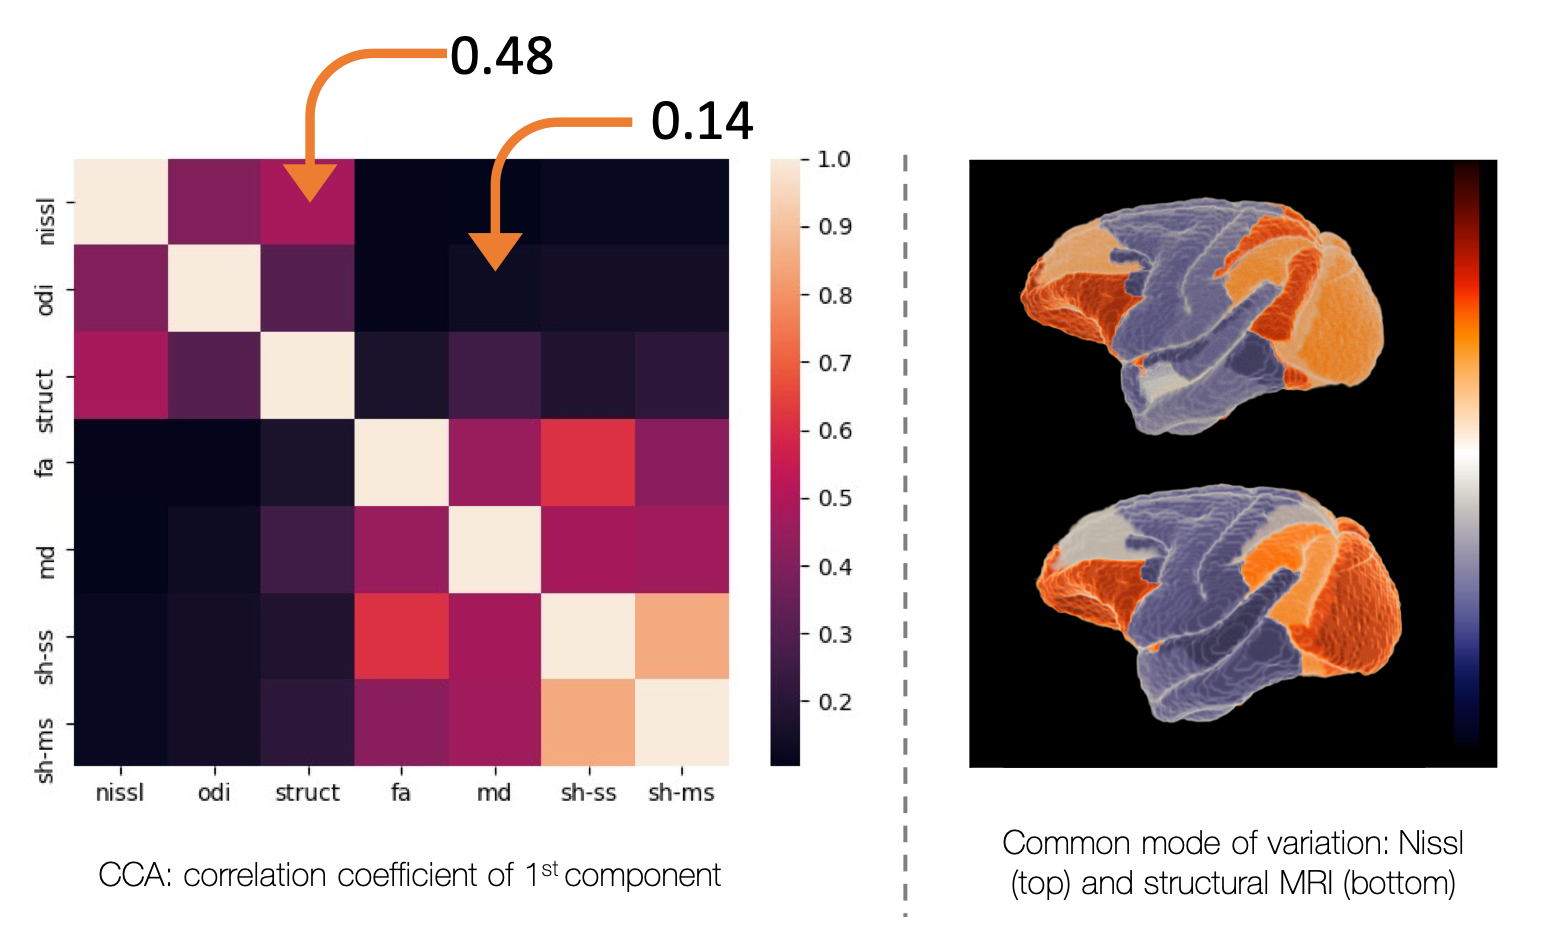
Using canonical correlation analysis (CCA) to find common modes of cortical variation. A strong positive correlation was found between Nissl density and structural MRI, with separation of the frontal/occipital and temporal/parietal areas. Neither the DTI metrics, nor the more information rich spherical harmonics, show a common mode of microstructure variation with microscopy (r=<0.15). nissl=Nissl density,
odi = Nissl ODI, struct=structural MRI, sh_ss = spherical harmonics, single
shell, sh_ms = spherical harmonics, multi-shell
DOI: https://doi.org/10.58530/2022/1856