1855
Test-retest repeatability study of multi-compartment relaxometry for myelin water imaging (MCR-MWI)1Donders Institute for Brain, Cognition and Behaviour, Nijmegen, Netherlands
Synopsis
In this study, we evaluate the test-retest repeatability of the recently developed multi-compartment relaxometry method for myelin water imaging (MCR-MWI). Cross-protocol repeatability is also studied using 3 GRE protocols with different echo spacing and TR. Good cross-session and cross-protocol repeatability is observed for MCR-MWI. Additionally, tissue parameters along 8 major white matter bundles are studied, and myelin water fraction is the most robust tissue parameter across various protocol settings.
Introduction
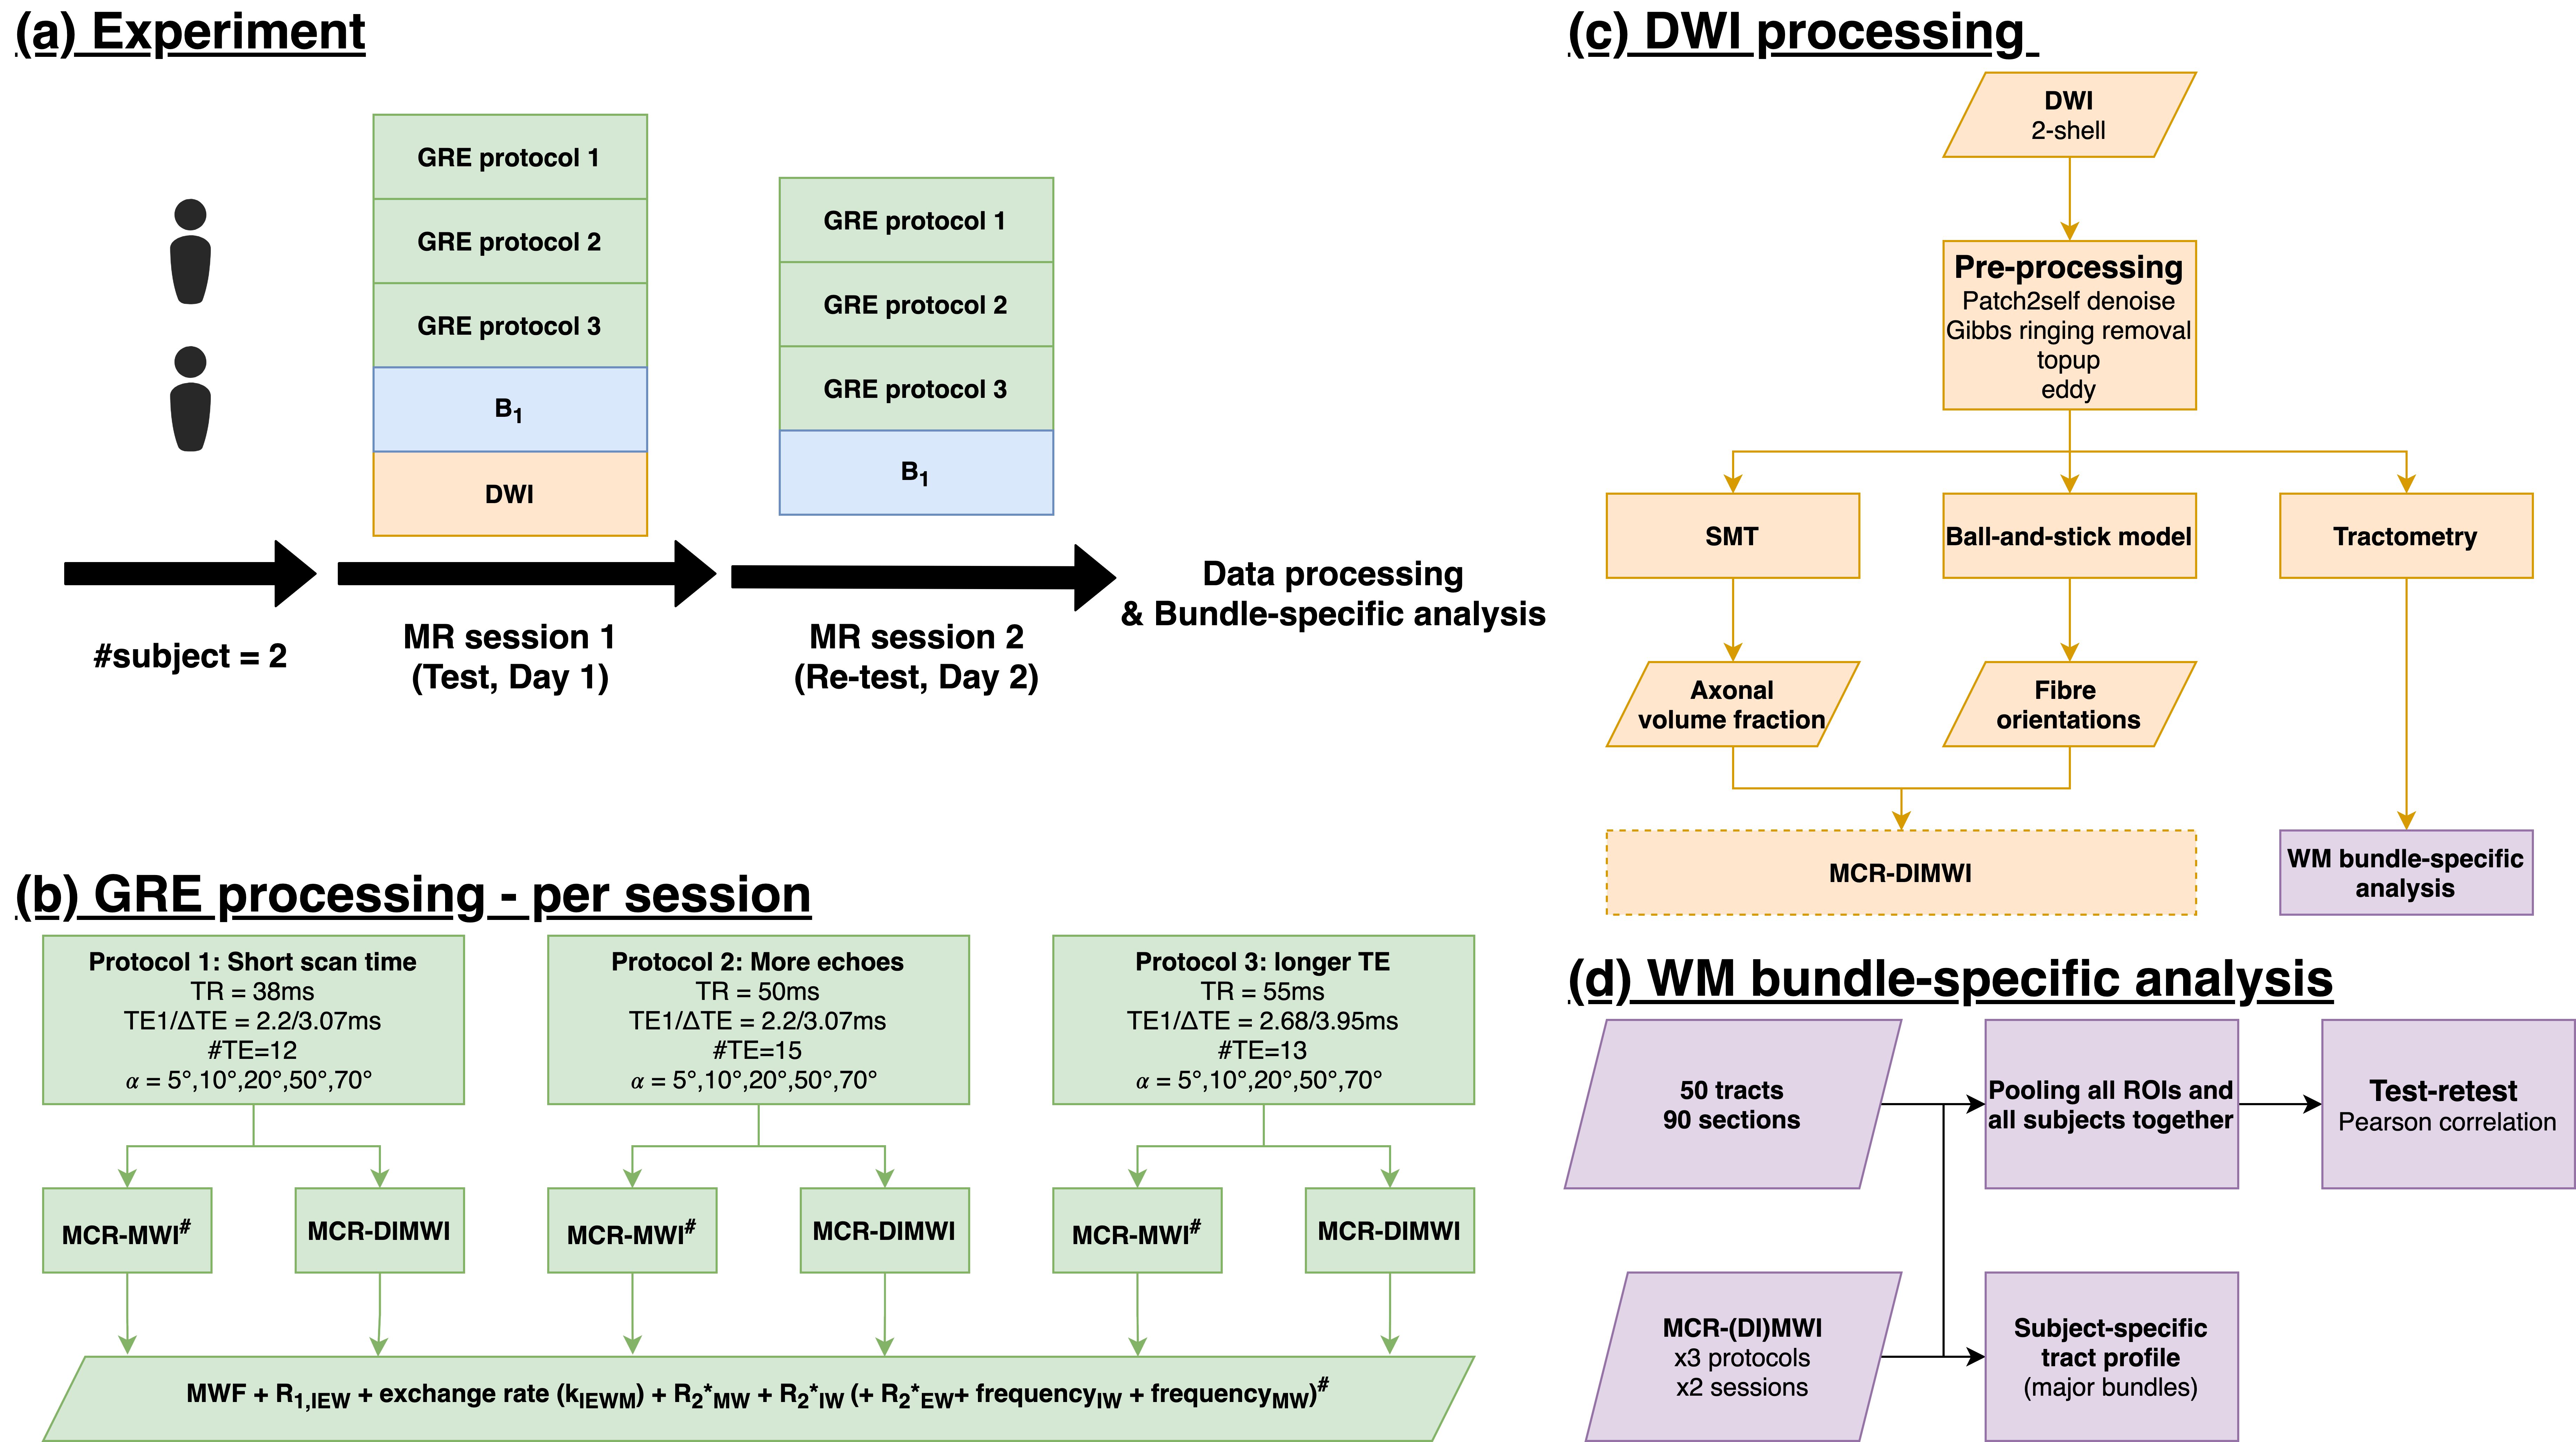
Myelin water imaging (MWI) using multi-echo gradient echo (mGRE) is a promising tool for myelin quantification, but it is a highly ill-conditioned and SNR-demanding problem1-3. Multi-compartment relaxometry MWI (MCR-MWI)4, utilising variable flip angle (VFA) acquisition, benefits both from the different apparent transverse and longitudinal relaxations of the free (intra- and extra-axonal) and myelin water pools. MCR-MWI corrects the T1-saturation dependency on the measured myelin water fraction (MWF) and alleviates the MWI ill-condition problem, resulting in higher SNR MWF maps. Moreover, MCR-MWI can incorporate with diffusion-weighted imaging (DWI) data (MCR-DIMWI) to improve data fitting robustness.For MCR-(DI)MWI to be adopted in longitudinal studies or multi-centre trials, it has to be reproducible both within-subject and across protocols. In this study, we evaluate the reproducibility of MCR-(DI)MWI in a test-retest experiment (Fig.1a), using 3 sets of protocols with different echo spacings (ΔTE) and repetition times (TR) to examine the cross-protocol repeatability (Fig.1b). We also evaluate the reproducibility of the MWI-related tissue properties across fibre bundles of different subjects.
Methods
Data acquisitionData acquisition was performed at 3T (Siemens, Erlangen) on 2 heathy volunteers. 3 different protocols were used for two identical imaging sessions (Fig.1a) to evaluate the reproducibility of MCR-(DI)MWI:
1) TR/TE1/ΔTE/nTE=38/2.2/3.07ms/12, TA=2.8min/flip angle (α): short scan time condition;
2) TR/TE1/ΔTE/nTE=50/2.2/3.07ms/15, TA=3.5min/α: data-rich condition;
3) TR/TE1/ΔTE/nTE=55/2.68/3.95ms/13, TA=4min/α: less-performing gradient setup;
with sagittal slice orientation, FOV=168x222x240mm3, res=1.5mm iso., α=[5,10,20,50,70]°, RCAIPI=5.
B1 map was acquired using a turbo-flash protocol to correct B1 field inhomogeneities.
DWI data was acquired in one of the sessions for MCR-DIMWI and bundle-specific analysis with parameters: 2D-MB EPI-DWI, MB=3, res=1.6mm iso., TR/TE=3350/71.20ms, 2-shell (b=0/1250/2500s/mm2, 17/120/120 measurements), TA=15mins.
Data processing
DWI data was pre-processed (see Fig.1c). SMT5 and a ball-and-stick model6 were used to derive white matter (WM) properties for MCR-DIMWI. VFA-mGRE data of each protocol, the DWI-derived maps and B1 maps were coregistered. Voxel-wise fitting was performed with the MCR-(DI)MWI model to obtain MWF and other tissue properties4.
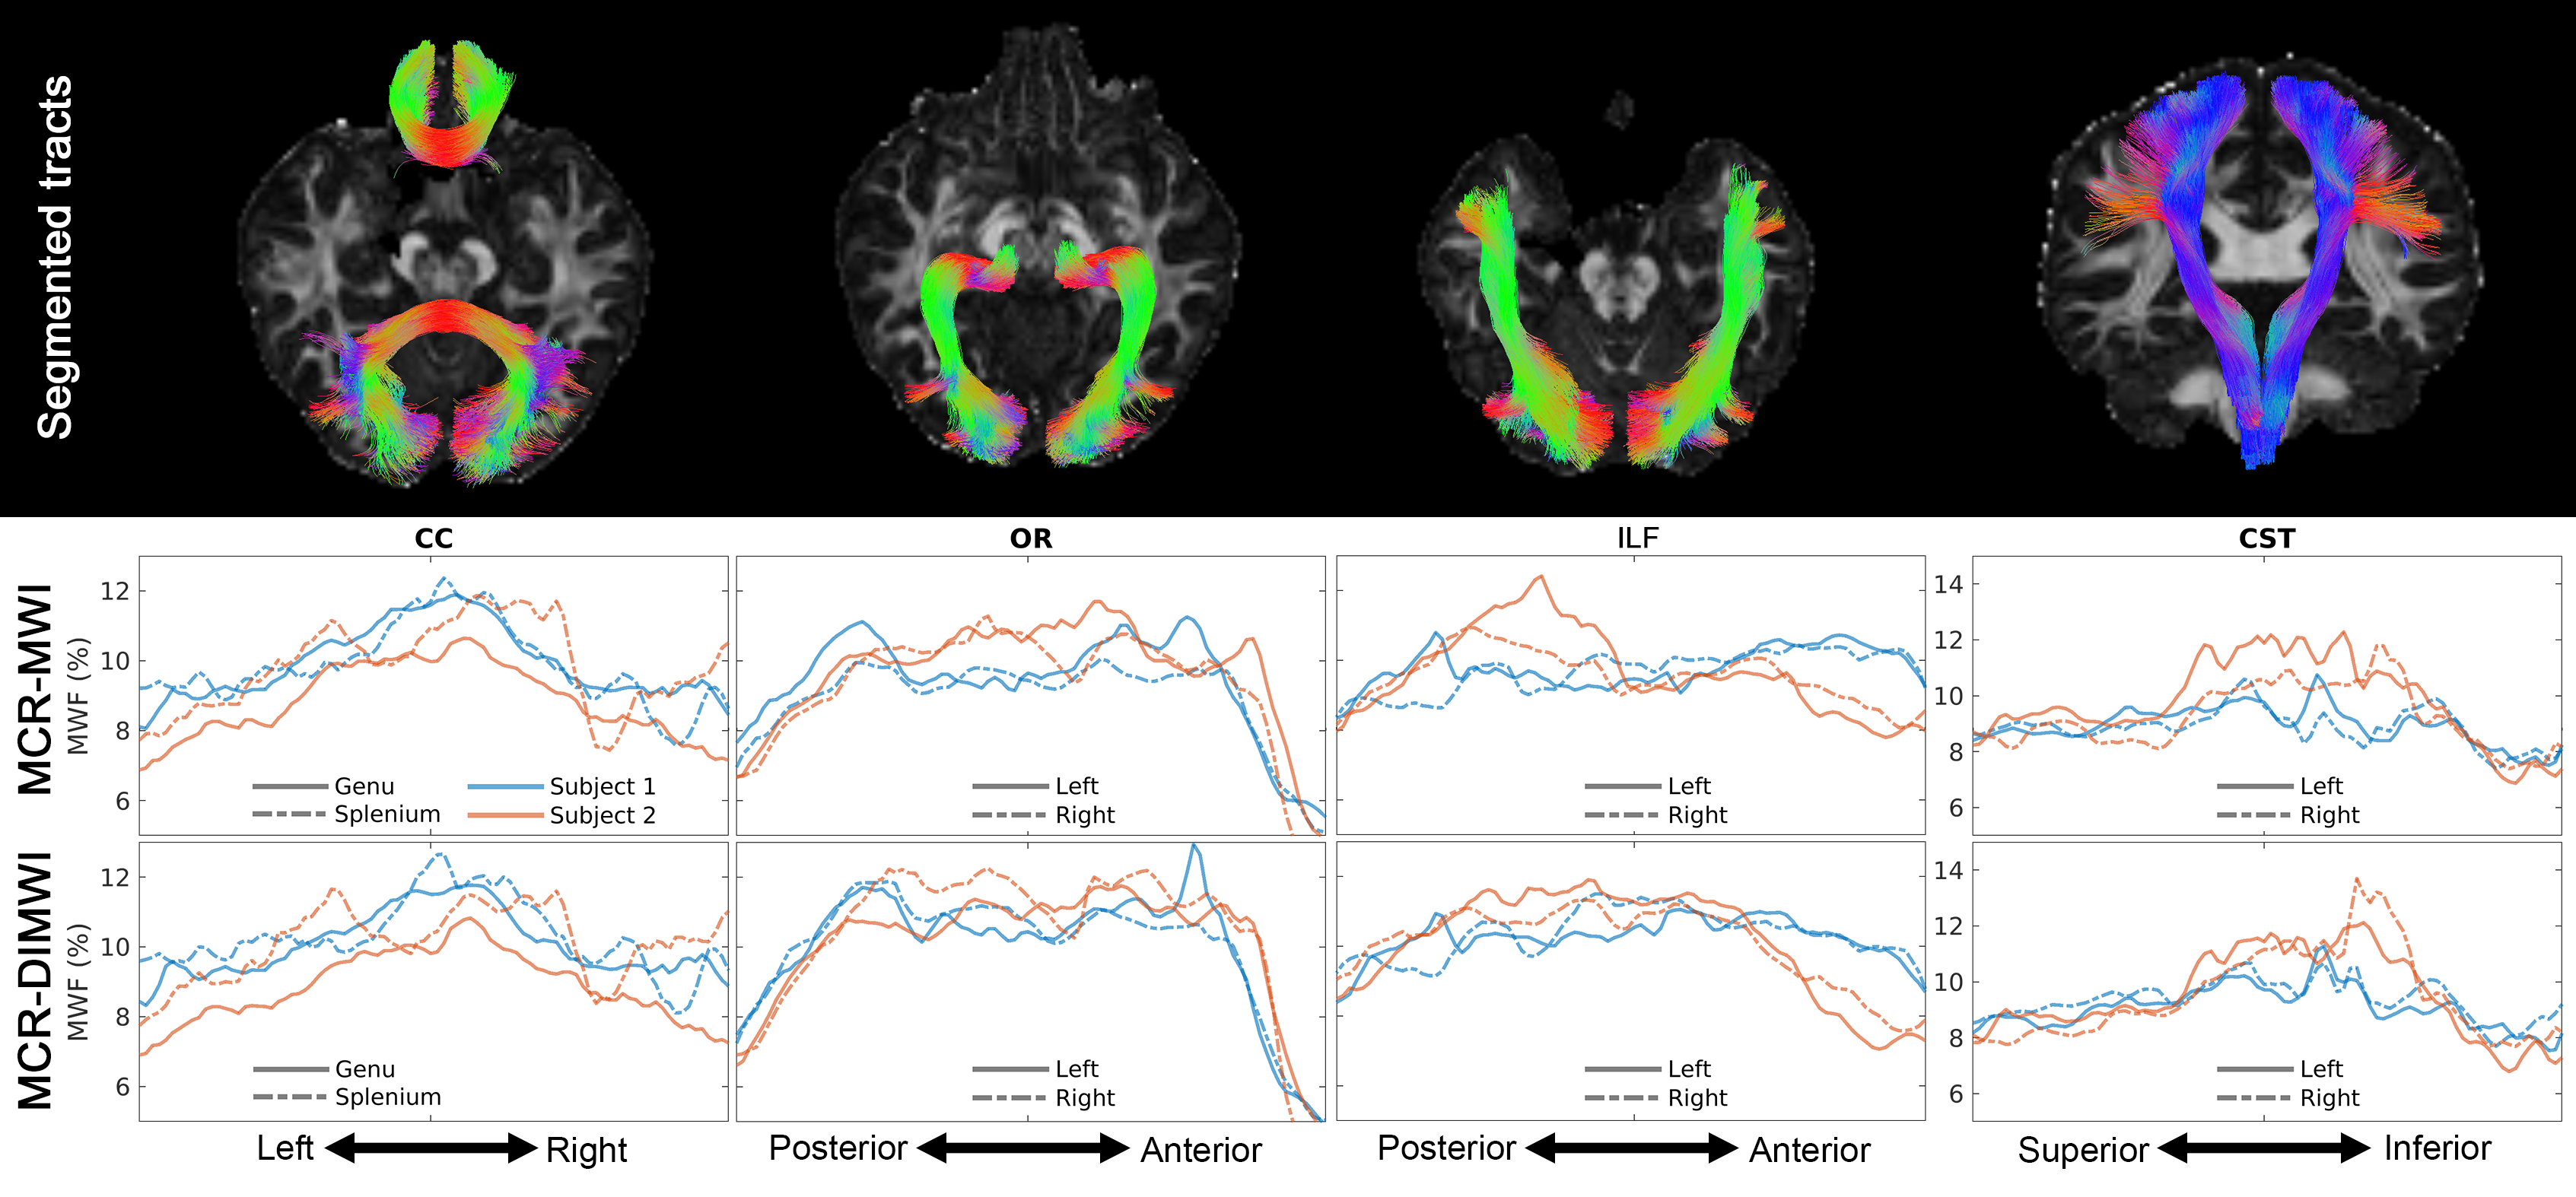
To study the MWF reproducibility in bundle-specific analysis, the MCR-derived maps were registered to the undistorted DWI space using rigid body transformation. Fifty subject-specific WM bundles were obtained from TractSeg7, using multi-shell multi-tissue constrained spherical deconvolution8. Tractometry was performed to compute the bundle-specific MWF (and other parameters) profile at 100 locations along the tracts. Only the middle 90 sections were used (excluding the first and last 5 sections which have increased partial volume effects), resulting in 4500 WM ROIs/subject.
Data analysis
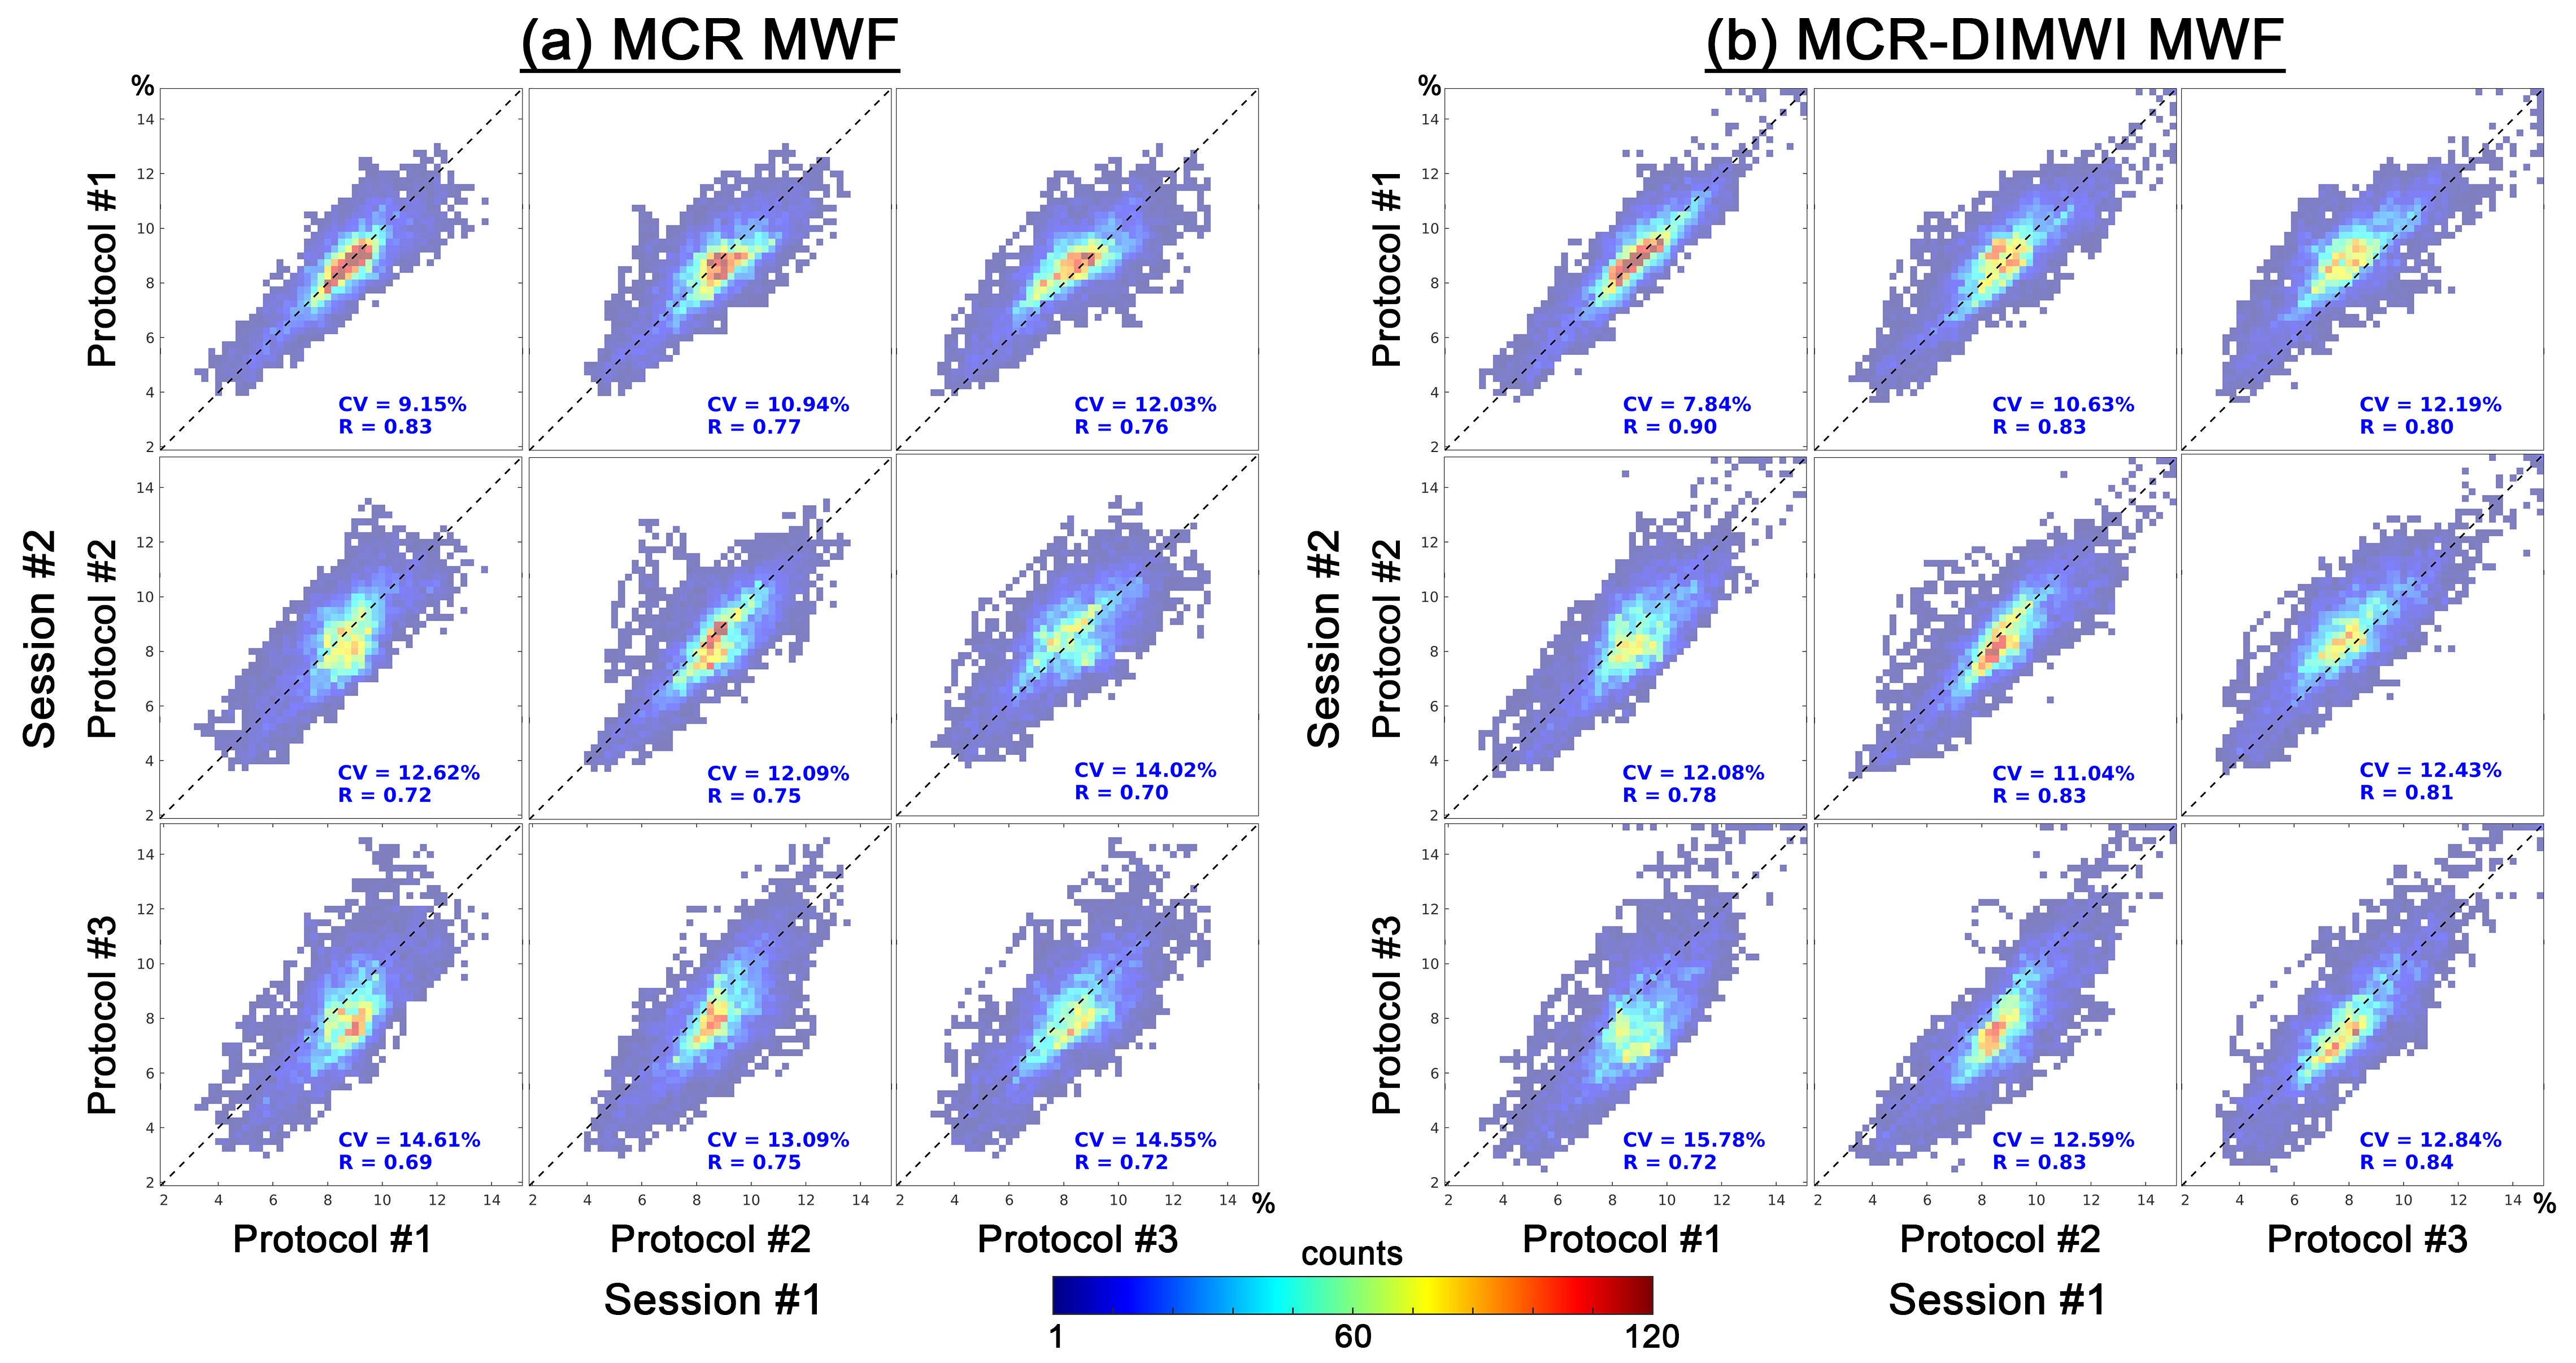
Test-retest reliability was assessed via Pearson’s correlation coefficient (R) and coefficient of variation (CV, standard deviation of the differences divided by the mean) for both within GRE protocols (across sessions) and across protocols (both within and across sessions) with all 9000 WM ROIs.
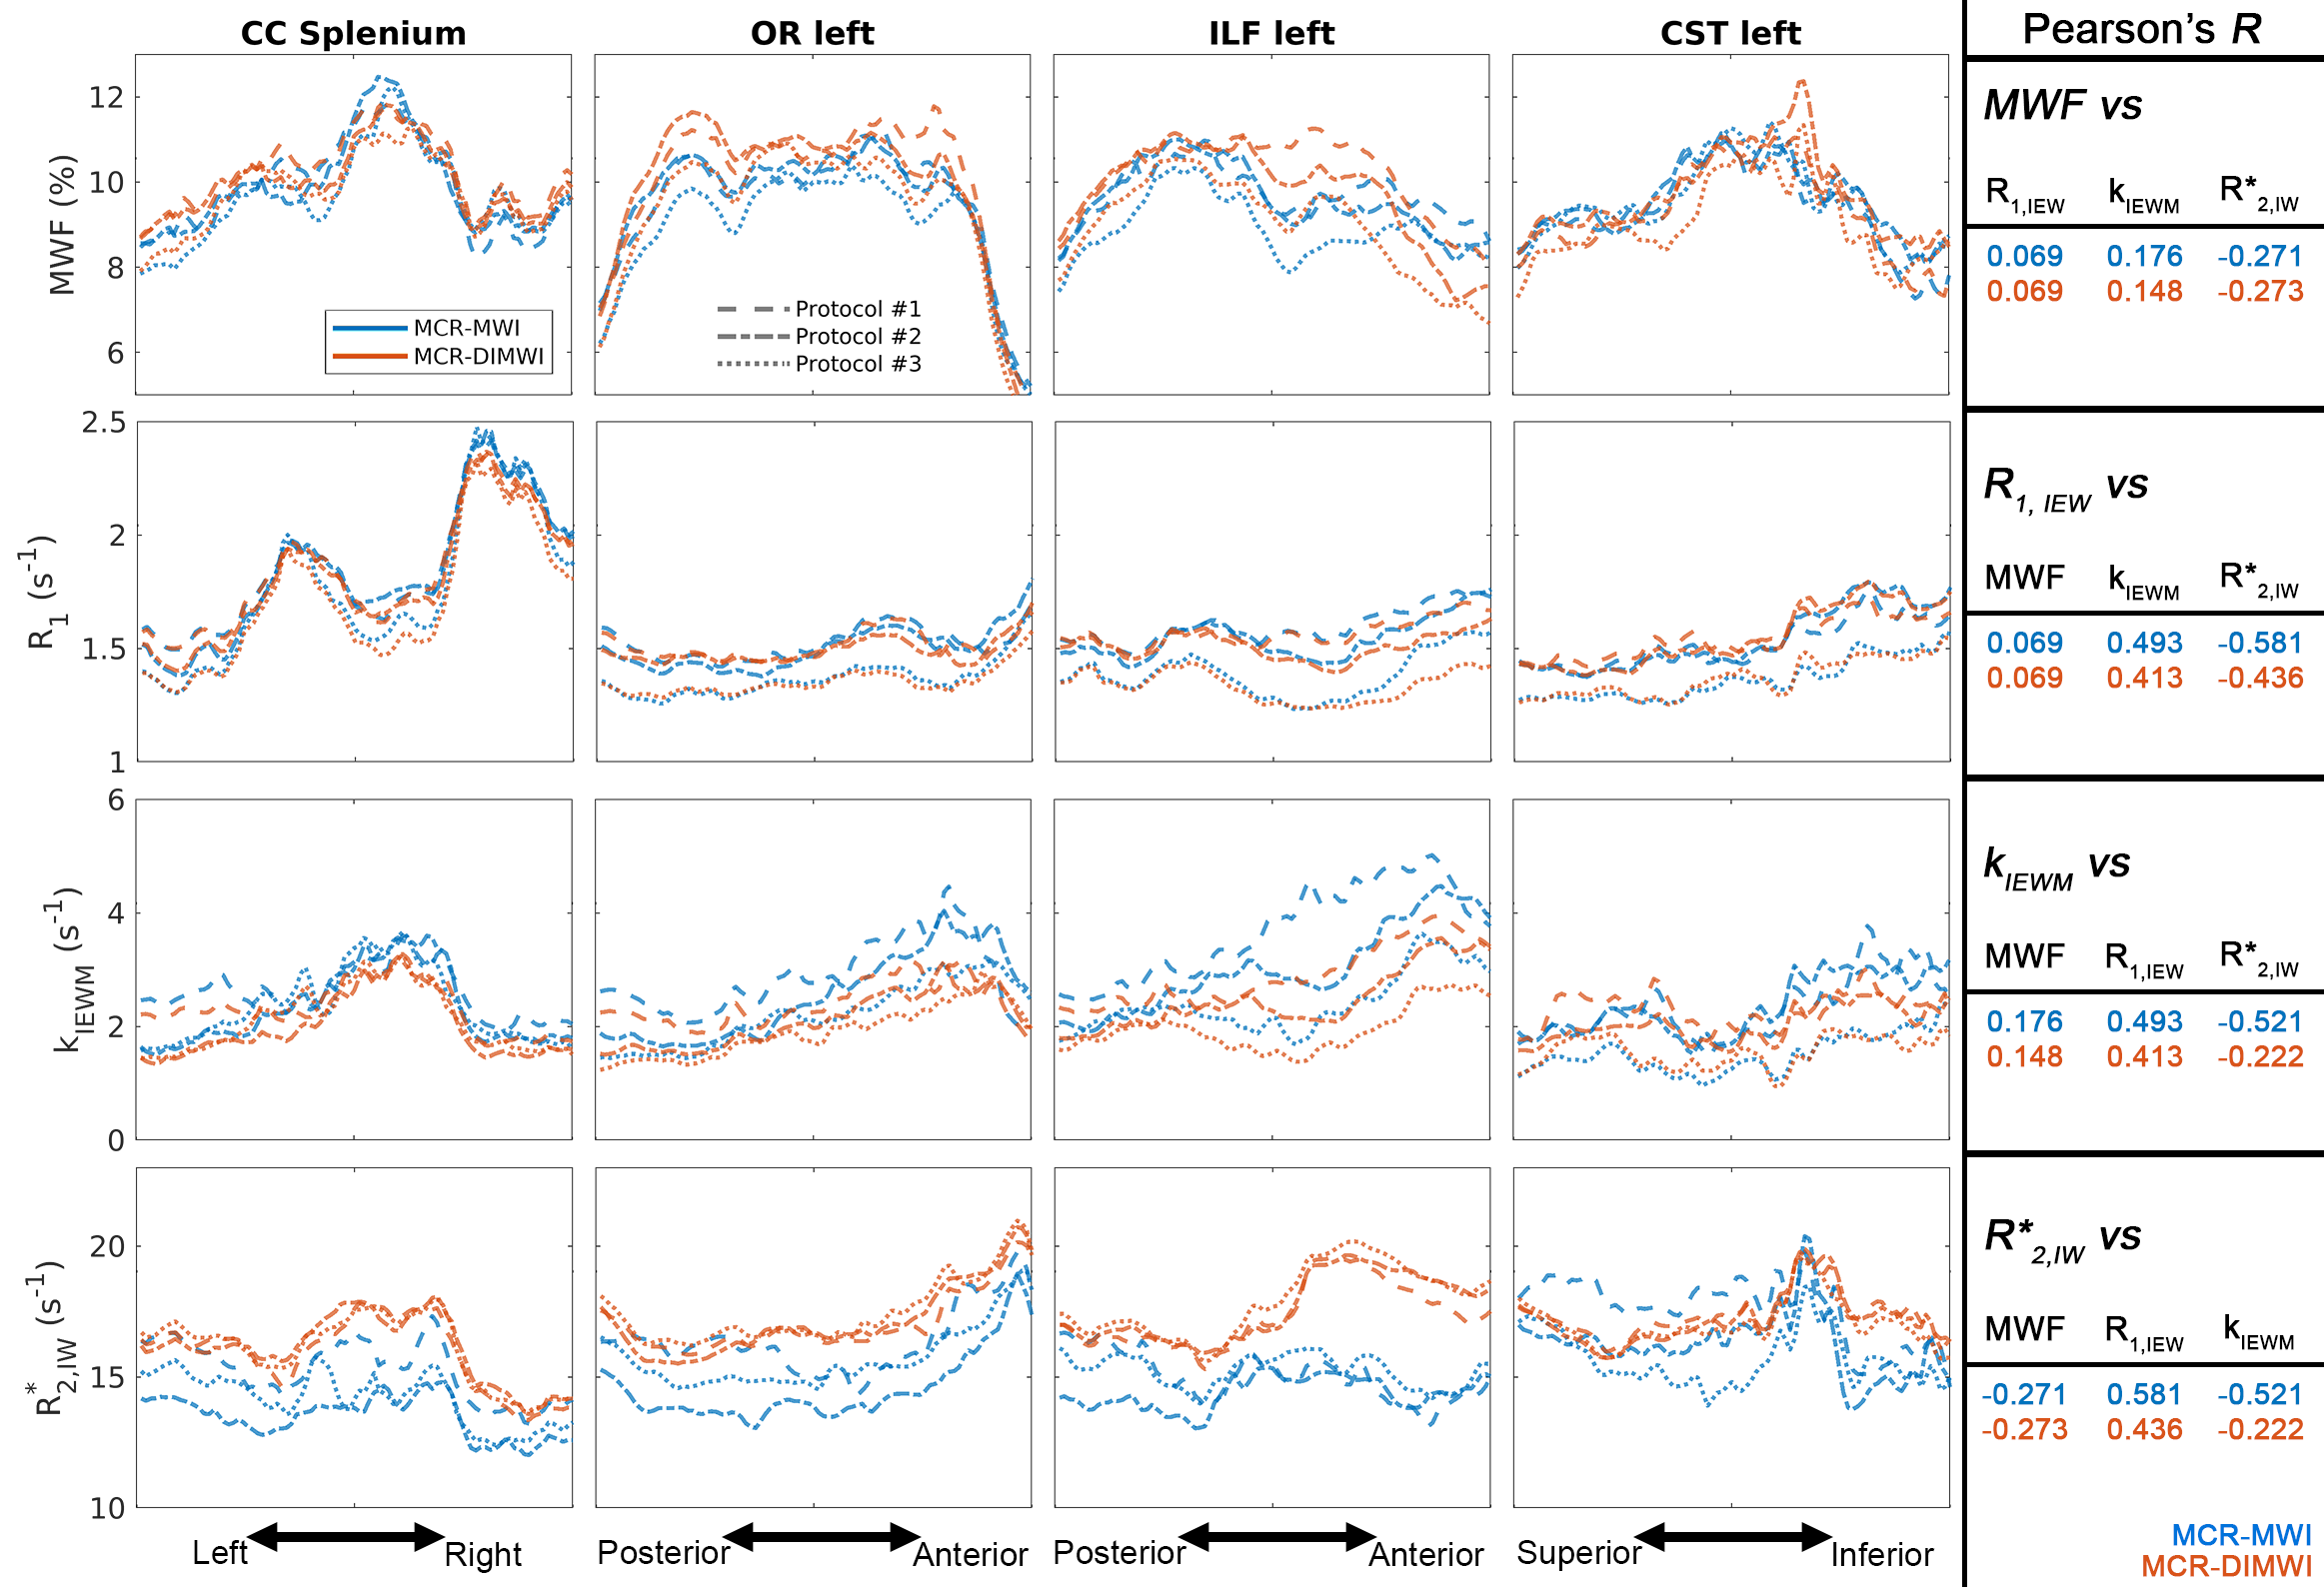
Bundle-specific MWF profiles were visually compared on 8 major fibre bundles between MCR-MWI and MCR-DIMWI, and between subjects using the protocol 1 results. These bundles are: splenium/genu of the corpus callosum (CC), left/right optic radiation (OR), left/right inferior longitudinal fascicles (ILF) and left/right corticospinal tracts (CST).
MCR-MWI, beyond MWF, also delivers free water R1 (R1,IEW), exchange rate (kIEWM) and intra-axonal water R2* maps amongst others. To study the potential of these parameters and their information independence, we examine the subject-averaged parameter profiles along 4 major bundles. Cross-correlation amongst these 4 parameters is also reported using protocol 1 results.
Results and Discussion
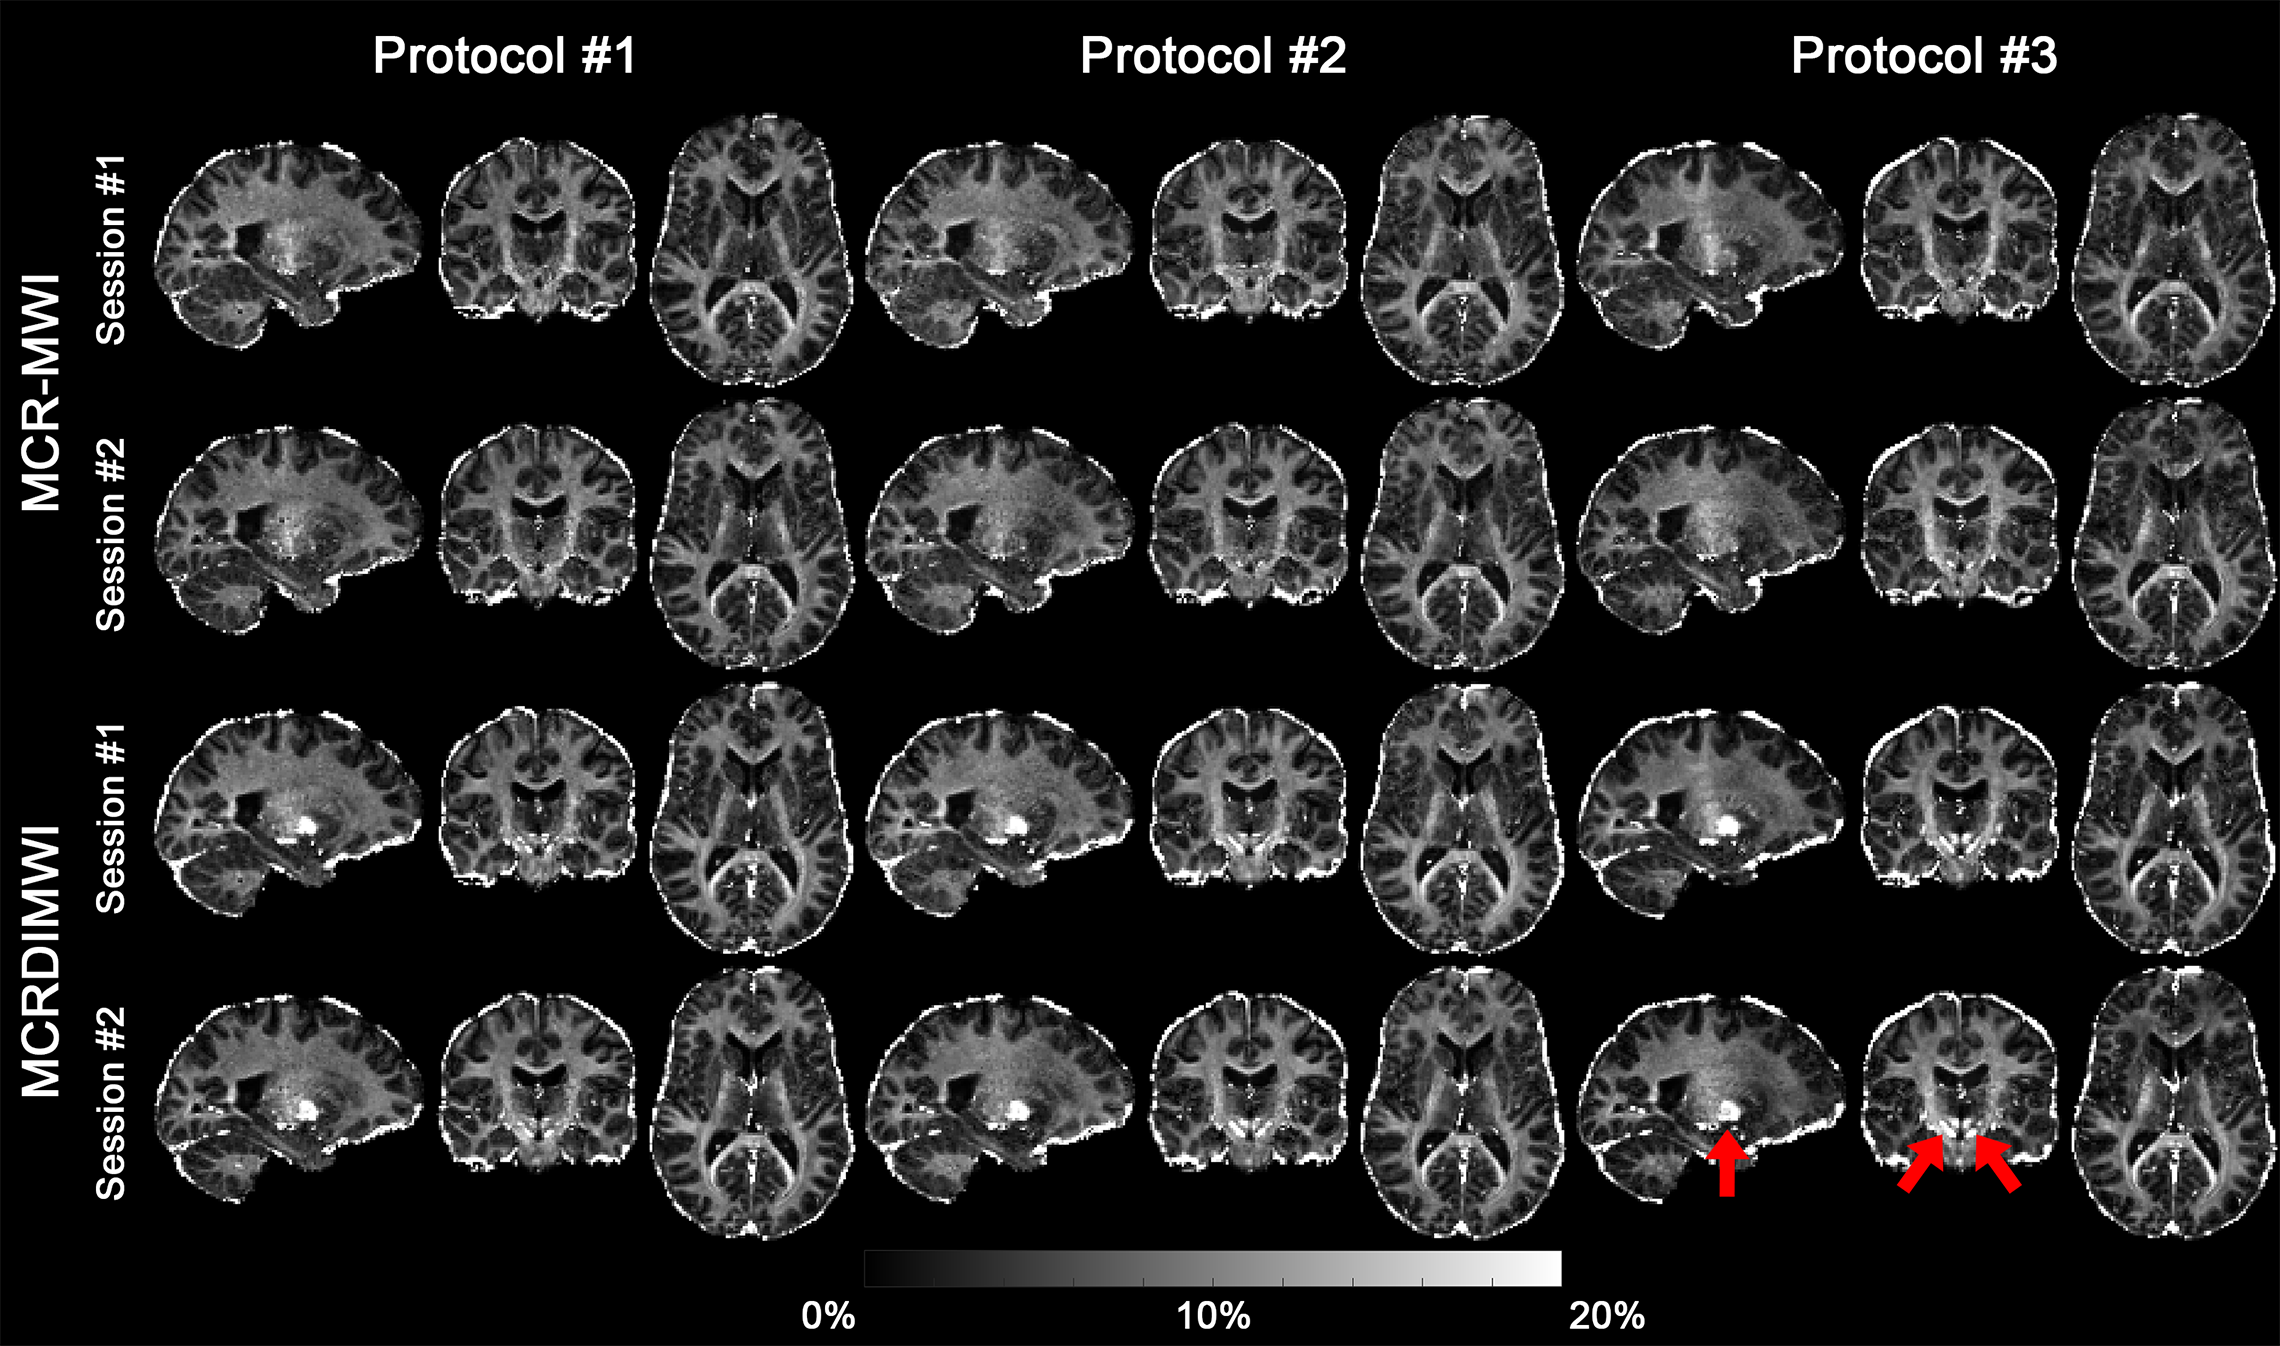
Fig.2 shows visually the MCR-(DI)MWI fitting quality across the whole brain for various protocols. The only noticeable difference is in deep grey matter nuclei where all MCR-DIMWI created unrealistically high MWF.All test-retest analyses show acceptable reliability (Fig.3a: R>=0.7 for MCR-MWI, Fig.3b: R>0.8 for MCR-DIMWI). Within protocol reliability (diagonal) is higher than between protocols: highest reliability for protocol 1 (CV<10% and R=0.85, despite the shortest acquisition time) and lowest for protocol 3 (where longer ΔTE introduced noise in the estimation). The higher MCR-DIMWI test-retest reliability and lower CV are also seen as increased SNR in the MWF maps in Fig.2.
Generally, MCR-MWI and MCR-DIMWI have very similar tract profiles on the same (subject) dataset between the left and right hemispheres (ILF and CST – Fig.4). Good agreements can also be seen between the two subjects in, e.g., OR and the genu of the CC.
Fig.5 shows the subject-averaged MWF tract profile along with other tissue parameters, indicating that the relaxation parameters carry independent information of MWF. Amongst the 4 parameters shown, MWF is the most robust measurement across all protocols, while T1,IEW and kIEWM show increased dependency with the use of various TRs. This can be attributed to both the flat cost function associated with these parameters9 and the different MT weighting associated with the different TRs10.
Conclusions
MCR-MWI is a reproducible measure for myelin quantification. Our results suggest that decreasing the echo time range and echo spacing results in more robust MWF maps, which is attributed to the increased physiological noise at longer echo times and the need to fit the short myelin water signal. Incorporating DWI data can improve the repeatability of MCR-MWI in WM. The repeatability measures (R and CV) will be useful for power analysis in future group/longitudinal studies. Future work will focus on studying tissue properties other than MWF which potentially contain other microstructure structure information.Acknowledgements
This work is part of the research programme with project number FOM-N-31/16PR1056/RadboudUniversity, which is financed by the Netherlands Organisation for Scientific Research (NWO). MC was supported by the Radboud University Excellence Initiative Fellowship.
References
1. Nam Y, Lee J, Hwang D, Kim D-H. Improved estimation of myelin water fraction using complex model fitting. Neuroimage 2015;116:214–221.
2. Alonso-Ortiz E, Levesque IR, Pike GB. Impact of magnetic susceptibility anisotropy at 3 T and 7 T on T2*-based myelin water fraction imaging. Neuroimage 2018;182:370–378.
3. Lee J, Nam Y, Choi JY, Kim EY, Oh S-H, Kim D-H. Mechanisms of T2 * anisotropy and gradient echo myelin water imaging. NMR in biomedicine 2016.
4. Chan K-S, Marques JP. Multi-compartment relaxometry and diffusion informed myelin water imaging – Promises and challenges of new gradient echo myelin water imaging methods. Neuroimage 2020;221:117159.
5. Kaden E, Kelm ND, Carson RP, Does MD, Alexander DC. Multi-compartment microscopic diffusion imaging. Neuroimage 2016;139:346–359.
6. Behrens TEJ, Berg HJ, Jbabdi S, Rushworth MFS, Woolrich MW. Probabilistic diffusion tractography with multiple fibre orientations: What can we gain? Neuroimage 2007;34:144–155.
7. Wasserthal J, Neher P, Maier-Hein KH. TractSeg - Fast and accurate white matter tract segmentation. Neuroimage 2018;183:239–253.
8. Jeurissen B, Tournier J-D, Dhollander T, Connelly A, Sijbers J. Multi-tissue constrained spherical deconvolution for improved analysis of multi-shell diffusion MRI data. Neuroimage 2014;103:411–426.
9. West DJ, Teixeira RPAG, Wood TC, Hajnal JV, Tournier J-D, Malik SJ. Inherent and unpredictable bias in multi-component DESPOT myelin water fraction estimation. Neuroimage 2019;195:78–88.
10. Teixeira RPAG, Malik SJ, Hajnal JV. Fast quantitative MRI using controlled saturation magnetization transfer. Magnetic resonance in medicine 2019;81:907–920.
Figures