1851
Impact of Gadolinium injection to the variable Flip Angle scheme of Tag CMR including SENC and SPAMM
Vivian S. Nguyen1, Jacob P. Goes1, Donovan Gorre2, Hui Wang3,4, Marcella K. Vaicik5, Amit R. Patel6, and Keigo Kawaji1,6
1Biomedical Engineering, Illinois Institute of Technology, Chicago, IL, United States, 2Radiology, University of Chicago Medical Center, Chicago, IL, United States, 3Philips, Gainesville, FL, United States, 4Department of Radiology, Cincinnati Children's Hospital Medical Center, Cincinnati, OH, United States, 5Illinois Institute of Technology, Chicago, IL, United States, 6Medicine - Cardiology, University of Chicago Medical Center, Chicago, IL, United States
1Biomedical Engineering, Illinois Institute of Technology, Chicago, IL, United States, 2Radiology, University of Chicago Medical Center, Chicago, IL, United States, 3Philips, Gainesville, FL, United States, 4Department of Radiology, Cincinnati Children's Hospital Medical Center, Cincinnati, OH, United States, 5Illinois Institute of Technology, Chicago, IL, United States, 6Medicine - Cardiology, University of Chicago Medical Center, Chicago, IL, United States
Synopsis
SENC and SPAMM tagging Cardiac Magnetic Resonance (CMR) are specifically optimized for acquisition before contrast injection and tuned to the end-systolic phase. While SPAMM tagging is a non-quantitative approach that indirectly derives functional motion from the displacement of the saturated tags in the myocardium, SENC directly computes myocardial tissue compression (strain) in percentage units. Furthermore, SENC quantitation pipeline bypasses the signal intensity map that exhibits the decay of the embedded strain measurements. In this study, we examine both SPAMM and SENC post-Gd measurements to specifically indicate the effect of the variable RF pulse train tuned to target tissue T1.
Introduction
SENC-CMR and SPAMM both routinely employ the variable flip angle RF pulse train readout (vRF)1 tuned to target T1 and T2 for prolonged optimal contrast during the acquisition cycle. After Gd injection, the myocardial T1 shortens and the vRF overestimates the target relaxation value. In a prior work2, robustness of post-Gd SENC CMR was demonstrated via numerical simulation at the 200-400 ms end-systolic phase period. However, performance of post-Gd SENC CMR downstream of the vRF pulse train (>400 ms) is not well understood.In this study, we investigate the later downstream pulse train behavior of post-Gd SENC and SPAMM. This is particularly important because SENC does not exhibit the influence of the T1 shortening effect to the eventual strain quantification. Our work leverages the assessments of SPAMM CMR, in which this phenomenon is clearly visible, as an indirect surrogate for the impact of vRF response on SENC.
Materials and Methods
We performed a retrospective assessment of all Tag CMRs in our anonymized research subject CMR database that consists of both research and clinical exams performed at the University of Chicago Medical Center between 2011-2021. For each data, appropriate institutional approval (IRB, IACUC) was obtained for CMR performed on two MRI systems: a 1.5T (Philips Achieva) and a 3.0T (Philips Ingenia; Best, The Netherlands) system. Inclusion criteria required both pre- and post-contrast tagging scans (n=22 were found at 1.5T, n=6 at 3T), where availability of LGE, perfusion, or CE-MRA was used to determine the Gd injection time. The vRF scheme in all SENC and SPAMM scans was tuned to myocardial T1 = 1114 ms and T2 = 55 ms for pulse train calibrations at both 1.5 and 3T, and was fixed by the vendor.Clinical SENC quantitation does not produce the key intermediary anatomy map exhibiting the T1 shortening induced signal decay (Figure 1 top row and animated Figure 2, in which the displayed SENC signal intensity maps were reconstructed offline). In this study’s analysis of SPAMM data, apparent signal to noise ratio (aSNR, which used a uniform non-tag region for noise std derivation) and apparent contrast to noise (aCNR) were derived between regions with and without saturation tags on the chest wall (Figure 1 bottom row). Analysis was performed on n=4 subjects, with two of the long axes (2ch, 4ch) and two sets of mid-short axis views. We examined the signal intensity of saturated tag lines on the chest wall over the time course of the cardiac cycle in both pre- and post-Gd cases. We also examined the general temporal profile of the aCNR with respect to the Rose criterion cutoff of aCNR<4 for visible separation of voxel from noise3.
Results
Among ~250 total examined datasets with CMR tagging at our site, n=28 of these (~8%) were found to include SENC or SPAMM at both pre- and post-Gd. This is indicative of how frequently Tag CMR is performed post-Gd injection.Figure 3 shows the aSNR of SPAMM derived saturated tag lines on the chest wall throughout the cardiac cycle. The pre-Gd measurements (in black) consistently yielded effective signal saturation below 5 on the first frame and below 10 throughout the cardiac cycle. Post-Gd measurements (in grey) yielded greater instances of suboptimal signal suppression above 5.
Figure 4 (A) and (B) show several representative matched tag aSNR and aCNR pre-Gd and post-Gd in the same geometry. In (C) showing all data points (pre in black and post in grey), pre-Gd signal fell below the Rose criterion CNR = 4 at 380 ± 130 msec, post-Gd signal fell at 290 ± 120 msec (across 16 examined measurements each). A paired t-test yielded nonsignificant differences (p=0.08). However we note that the signal decay was not fully captured in select R-R intervals. Three of the pre-Gd measurements excited the Rose criterion throughout the full time course whereas one post-Gd measurement was always below the Rose criterion.
Based on the observations made using the SPAMM method, we infer key signal properties of the SENC tag to also be affected by the T1 shortening induced by Gd injection. We further note additional statistical analysis was not pursued, as it would not be appropriate in absence of key parameters associated with any or all of Gd dosage or subject size, time after injection, and the individual variability of post-Gd myocardial T1 at the time of the SPAMM acquisition.
Discussion/Conclusion
Our initial work corroborates the general existing guidance against relying on tag fidelity post-Gd, especially downstream in the vRF pulse train. We additionally note that, from our assessment, it was observed that routine clinical assessments do not necessarily preserve measures indicative of this observation are either not immediately available (i.e. SENC signal intensity time course map that decays as shown in animated Figure 2), or are not stored (i.e. contrast injection times, contrast dosage, etc). In particular, the post-Gd usage of SENC may exhibit potentially notable error propagation due to the significantly reduced signal intensity during mid-to-late cardiac phases. While a future study warrants greater experimental control, our preliminary analysis corroborates the greater emphasis of acquisition of these Tag CMR methods pre-Gd injection.Acknowledgements
This work has been supported by NIH K25 HL141634 (Kawaji) and AHA 19AIREA34450209 (Vaicik).References
1. Fischer S. et al. MRM 1993.2. Ibrahim ES. et al. MRM 2007.
3. Watts R. et al. MRM 2002.
Figures
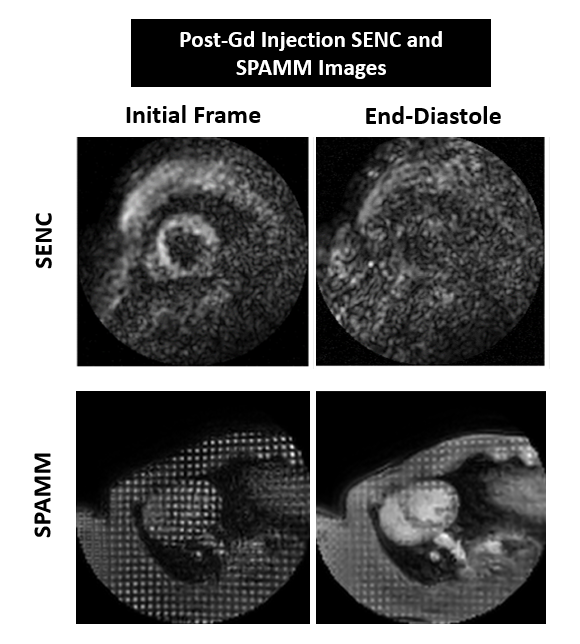
Figure 1: Post-Gd injection SENC
(top) and SPAMM (bottom) images: initial frame (left) and end-disatole (right).

Figure 2: SENC pre-contrast injection (left) and SENC
post-contrast injection (right).
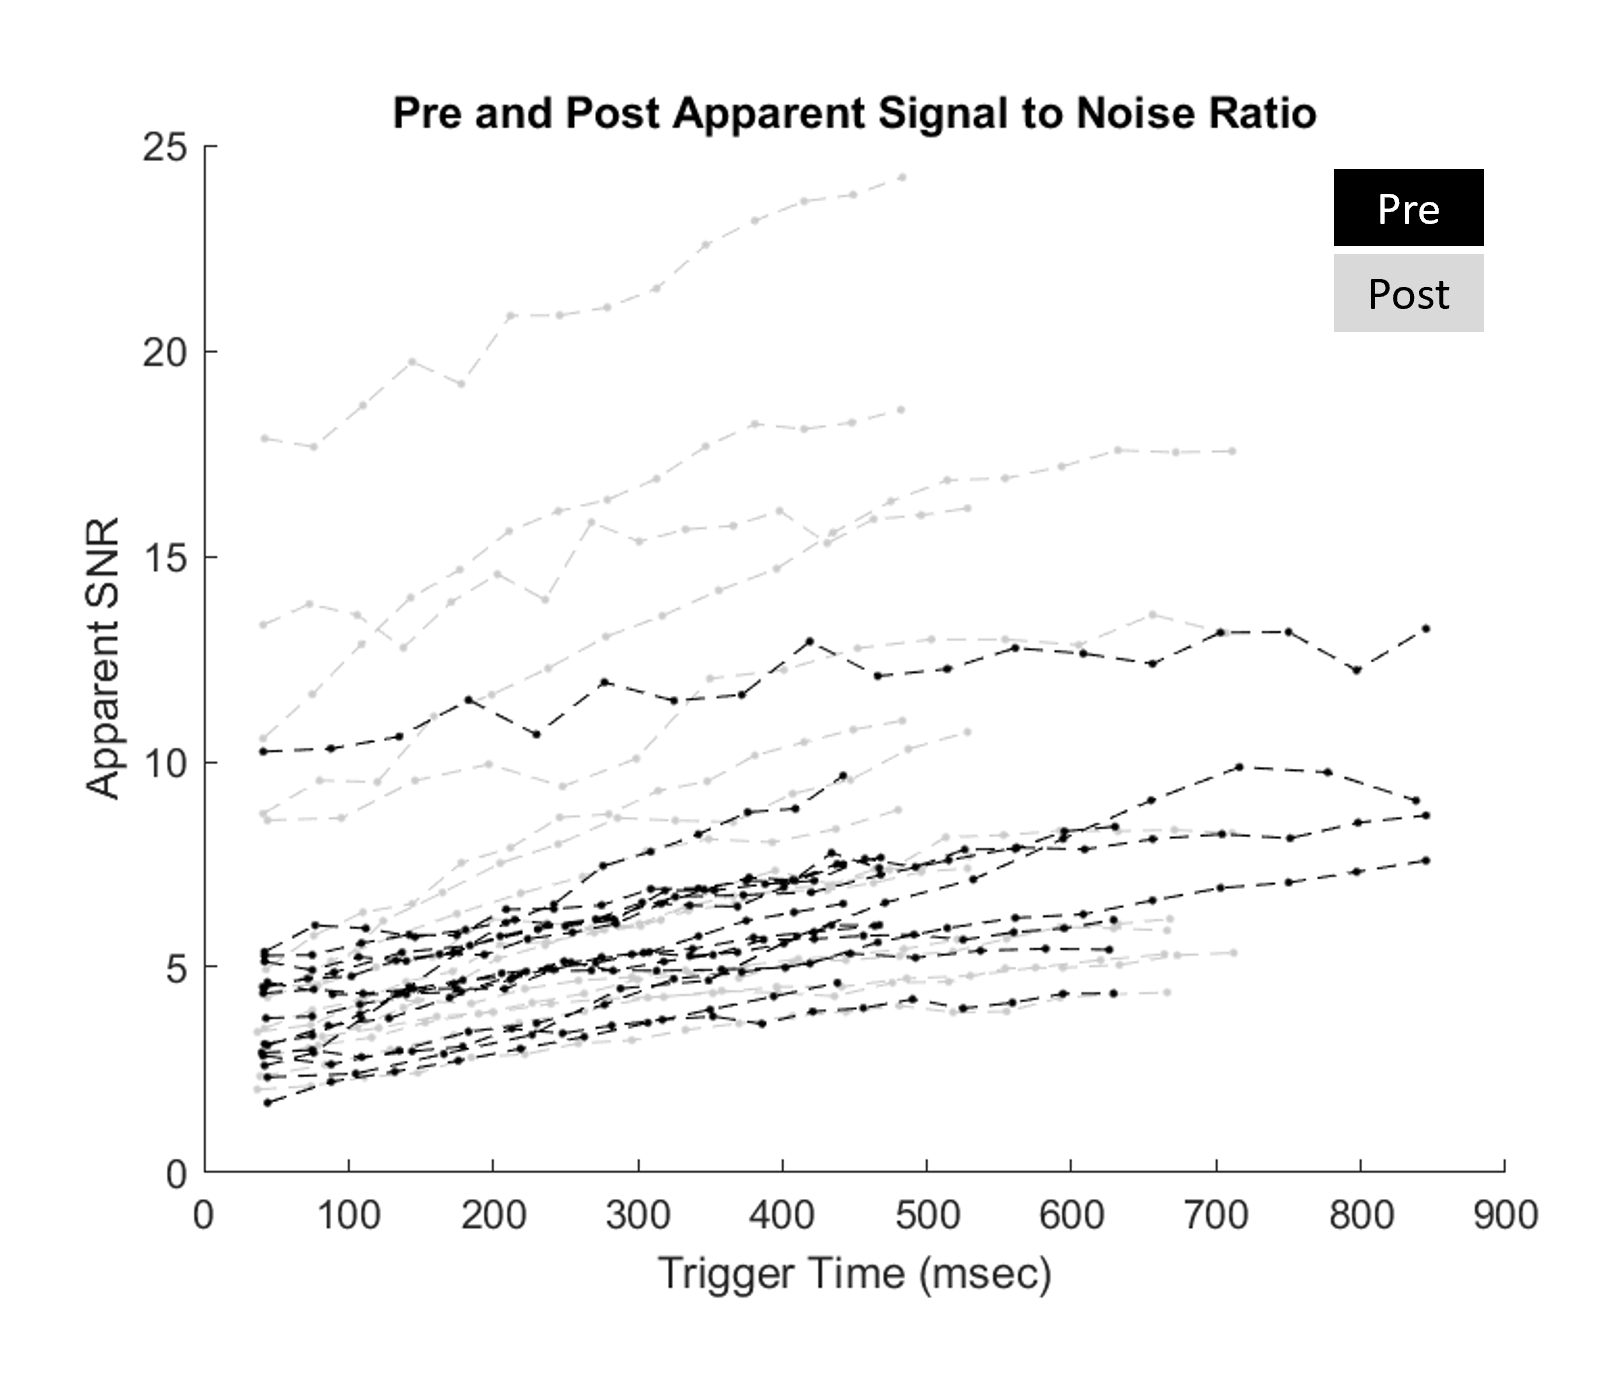
Figure 3: Apparent signal to noise ratio of pre (black) and post (grey) measurements across all subjects.
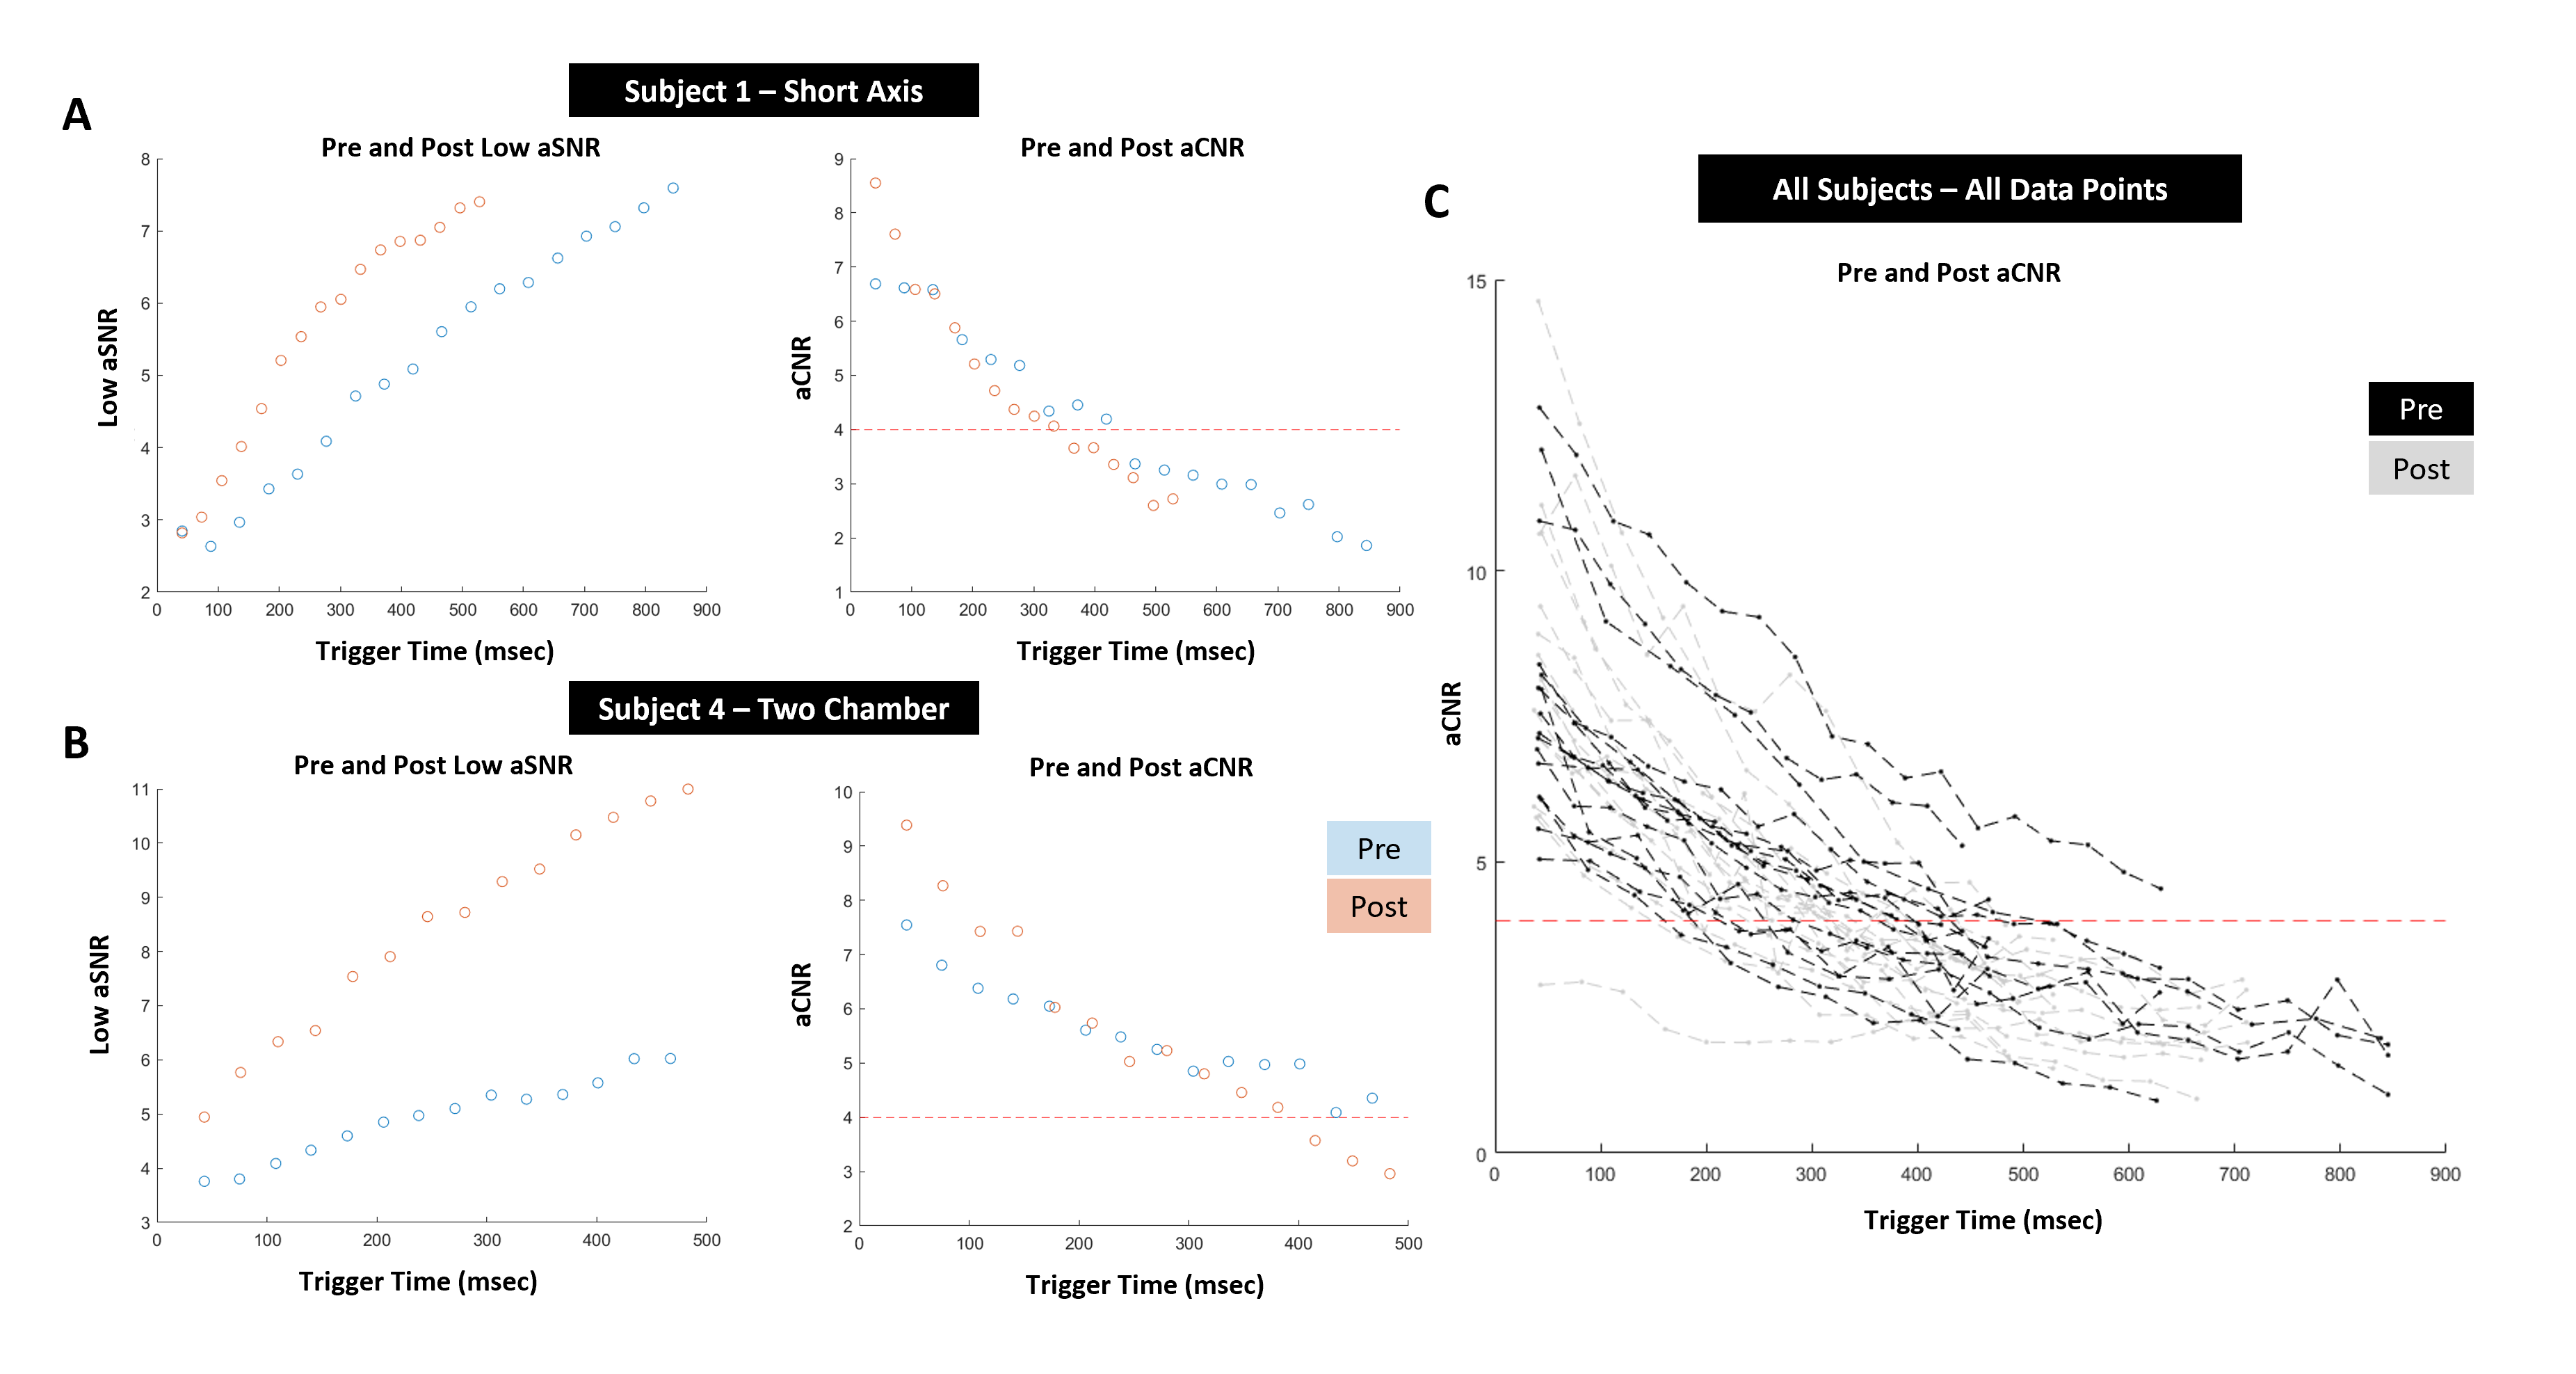
Figure 4: (A, B) Pre (blue) and post (orange) apparent signal to noise ratio for (left) and pre and post apparent contrast to noise
ratio (right) for Subject 1 (top) and for Subject 4 (bottom). (C) Pre (grey) and
post (black) apparent contrast to ratio for all subjects and all SPAMM scans.
DOI: https://doi.org/10.58530/2022/1851