1842
Automated cardiac bi-ventricular segmentation and motion analysis in a monocrotaline rat model of pulmonary hypertension1National Heart and Lung Institute, Imperial College London, London, United Kingdom, 2Biological Imaging Centre, Imperial College London, London, United Kingdom, 3School of Computer Science, University of Birmingham, London, United Kingdom, 4MRC London Institute of Medical Sciences, Imperial College London, London, United Kingdom, 5Department of Brain Sciences, Imperial College London, London, United Kingdom
Synopsis
Multiple cardiac AI-based image processing pipelines exist for clinical application, yet the equivalent is lacking for rodents. We utilized a fully convolutional network combined with 3D-atlas registration to auto-segment cine images from pulmonary hypertension (PH) rats and produce 3D contraction maps. The auto-segmentations were equivalent to manual (Dice overall >0.7). The volumetric parameters did not differ between methods, except a minor underestimation for RVESV in PH rat (8.2%). 3D contraction maps indicated moderately increased basal wall motion at early (adaptive) stage followed by a 36% reduction at later (maladaptive) stage of PH. This regional motion remodelling correlates with PAH patients.
Introduction
Right ventricular (RV) function is an independent predictor of survival for pulmonary arterial hypertension (PAH)1. Application of artificial intelligence (AI) techniques to cardiac magnetic resonance (CMR) images improved ventricular phenotyping and survival projection of PAH patients by providing three-dimensional RV wall motion patterns2. While multiple AI-based cardiac image processing and analysis methods exist for clinical application, the equivalent is lacking for rodent models, which offer longitudinal pathophysiological insight into disease development, contributing extensively to treatment discovery. We propose to develop a rat-specific pipeline that enables automated bi-ventricular image and motion analysis. We hypothesised that the pipeline will generate equivalent automated segmentations and inform on the wall motion changes occurring throughout pulmonary hypertension (PH) in rats.Methods
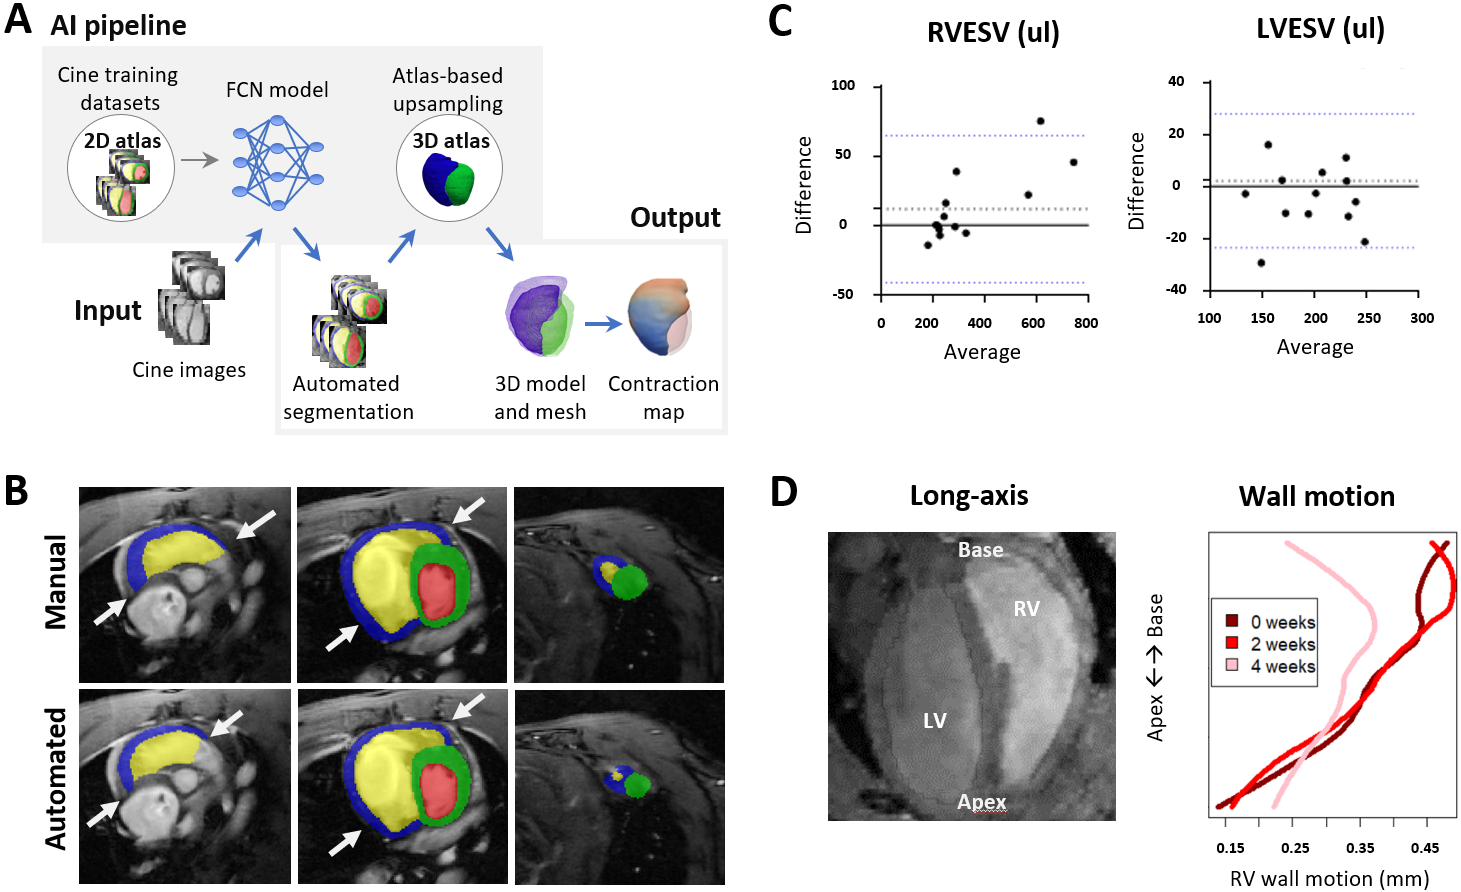
We employed a well-established monocrotaline (MCT; 60mg/kg subcutaneous injection) rat PH model as it captures the relevant pathophysiological and histological cardiac features from adaptive to maladaptive stage. CMR imaging was performed longitudinally before and at 2 and 4-weeks post MCT-injection using a 9.4T Bruker BioSpec system. ECG and respiratory triggered 2D multi-slice gradient echo (FLASH) cine images were acquired with the following parameters: repetition time = RR interval/number of frames (~ 6.2ms for ~ 27 frames); echo time = 2.3ms; effective repetition time = RR interval; flip angle = 18o, spatial resolution = 200x200x1500 μm3. On one animal, 3D FLASH sequence images were acquired at end-diastole (ED) and end-systole (ES) with TR = 7.3ms, TE = 2.4ms and the flip angle = 28o. The resolution of the images was 200x200x340 μm3. In total, cine images from a hundred datasets and one 3D CMR image were segmented. The automated algorithm3 can be split into two parts: image segmentation and 3D-atlas fitting (Fig 1A). The 2D shot-axis cine images and the corresponding manual segmentations were split into training and testing datasets (60/40 split). A fully convolutional network (FCN) was trained on the training data and applied to predict the segmentations on the test data. The segmentation results were evaluated against the manual segmentation using two-way ANOVA, Bland-Altman, and Dice correlation coefficient analysis. The second part of the pipeline fitted a high-resolution 3D atlas (the 3D CMR image and the corresponding manual segmentation) to the segmentations to allow atlas-based analysis. After a series of rigid and non-rigid transformations, the atlas was warped onto the segmentation, which produced a mesh of over 19,000 points on the epicardial surfaces of both ventricles, from which regional contraction maps were calculated. Regional wall motion was calculated from five MCT rats scanned longitudinally. The value was determined for each mesh point from the distance between the ED and ES phases.Results
Segmentation: Time to manually segment the LV and RV on a short-axis cine image at one cardiac phase is user-dependent and may take up to 30 minutes, whereas the FCN network produced a segmentation in <10 seconds. Overall, there was a good agreement between the manual and automated segmentations (Fig 1B, C) – Dice metric for all segmentation labels ranged from 0.73 to 0.93 on average. The two-way ANOVA analysis revealed that the automated method did not differ from the manual, except for the RVESV at 4-week MCT, which was underpredicted by 8.2% (48ul ± 15ul, p<0.02). RV wall motion: We found that in a healthy animal the RV contraction pattern was heterogeneous, with the basal area contributing the most to ventricular wall movement (Fig 1D). At 2-weeks post-MCT, there was an initial modest increase of 4% in the mid-ventricular level and up to 15% increase in the basal outflow tract area (RVOT). At 4-weeks, a prominent decline of 36% of contraction from 0 and 4-week timepoints was observed in the basal RVOT.Discussion
We present a novel deep learning based algorithm applied to rat cardiac images producing bi-ventricular segmentations and wall motion analysis. The algorithm requires cine images which can be easily obtained from a routine cardiac examination. Segmentation of the RV is known to be difficult due to its complex geometry and thin wall, yet the automated workflow feasibly and accurately segmented PAH-rat cine images. Adding more datasets from the decompensated heart observed at 4-weeks MCT could resolve the underestimation of the RVESV. Furthermore, the regional cardiac motion modelling presented here offers complementary and additional information to global metrics. Increased wall motion at 2-weeks post-MCT follows reported increases in RV cardiomyocyte contractile properties from molecular contractility studies4, and computational modelling suggested the functional adaptation at this stage may be primarily due to increased intrinsic inotropy5. The hypomobility seen at 4-weeks is in keeping with decreased functional global indices like RV stroke volume or cardiac output, and with cardiomyocyte molecular studies demonstrating impaired Ca2+ release, delayed Ca2+ transients and increased diastolic Ca2+ leak, suggesting impaired contraction6.Conclusion
The fully automated rat-specific FCN pipeline is a suitable and fast method for producing cardiac segmentations for a rat PH model. The cardiac motion analysis offers novel insights into the contraction patterns of healthy, adaptive, and maladaptive ventricles. The predominant basal longitudinal remodelling observed in the PH rats is consistent with the findings reported in PAH patients.Acknowledgements
No acknowledgement found.References
1.van Wolferen, SA, Marcus, JT, Boonstra, A, et. al. Prognostic value of right ventricular mass, volume, and function in idiopathic pulmonary arterial hypertension. Eur Heart J,2007; 28(10).
2.Bello, GA, Dawes, TJW, Duan, J, et. al. Deep-learning cardiac motion analysis for human survival prediction. Nat Mach Intell, 2019; 1(2).
3.Duan, J, Bello, G, Schlemper, J, et. al. Automatic 3D Bi-Ventricular Segmentation of Cardiac Images by a Shape-Refined Multi- Task Deep Learning Approach. IEEE Trans Med Imaging, 2019; 38(9).
4.Medvedev, R, Sanchez-Alonso, JL, Alvarez-Laviada, A, et. al. Nanoscale Study of Calcium Handling Remodeling in Right Ventricular Cardiomyocytes following Pulmonary Hypertension. Hypertension, 2021
5.Vélez-Rendón, D, Zhang, X, Gerringer, J, et. al. Compensated right ventricular function of the onset of pulmonary hypertension in a rat model depends on chamber remodeling and contractile augmentation. Pulm Circ,2018; 8(4).
6.Power, AS, Hickey, AJ, Crossman, DJ, et. al. Calcium mishandling impairs contraction in right ventricular hypertrophy prior to overt heart failure. Pflugers Arch, 2018; 470(7).
Figures