1836
Multilevel Comparison of Neural Networks for Ventricular Function Quantification in CMR accelerated by Compressed Sensing1Charité - Universitätsmedizin Berlin, Working Group on CMR, Experimental and Clinical Research Center, a joint cooperation between the Max-Delbrück-Center for Molecular Medicine and the Charité – Universitätsmedizin Berlin, Berlin, Germany, 2DZHK (German Centre for Cardiovascular Research), partner site Berlin, Berlin, Germany, 3Department of Cardiology and Nephrology, Helios Hospital Berlin-Buch, Berlin, Germany
Synopsis
Three popular convolutional neural networks were trained on short-axis cine MR images of the heart acquired by a prototype 2-shot 2D Compressed Sensing sequence. Network performance was evaluated on the level of clinical results and segmentation quality. Analysis revealed high correlation for quantitative results between all networks and a human expert. Automatic segmentation of the right ventricle is significantly more difficult than the left ventricle and shows more outliers. Segmentation decision errors concentrate in basal and apical slices, with the largest millilitre differences in the basal slices. Fast acquisition and automated image analysis promise high efficiency in CMR.
Introduction
Cardiovascular magnetic resonance (CMR) is considered the gold standard for quantifying cardiac function, volume and mass, which requires precise contouring of the heart chambers1. In recent years convolutional neural networks (CNNs) have shown that they can automate the time-consuming task of segmenting short-axis cine balanced steady-state free precession images. On this task CNNs achieve an overall accuracy in the range of inter-observer errors2-4, while still making human atypical errors5. At the same time, acceleration techniques like Compressed Sensing (CS)6,7 are being developed to shorten scan times during image acquisition. This is of particular benefit to patients with respiratory and cardiac insufficiency, as it results in fewer and shorter breath holds for the patient. The aim of this abstract is a detailed evaluation of three neural networks for cardiac image segmentation that were trained on short-axis cine images acquired using a 2-shot cine CS sequence8.Methods
Training: A U-Net9, FCN10 and MultiResUNet11 were trained on the short-axis cine images of 119 patients from clinical routine acquired with a prototype 2-shot 2D cine CS sequence8 (1.5T Avanto fit, Siemens). The patient cohort encompassed a broad spectrum of cardiac disorders ranging from inflammatory diseases to cardiomyopathies and chronic myocardial infarction. An experienced reader segmented the left ventricular (LV) endocardial and epicardial borders as well as the right ventricular (RV) endocardial border in end-diastole and end-systole. All three networks share comparable hyperparameters and were trained for a variable number of epochs depending upon an early stopping condition (increasing Dice) using Adam optimizer, which optimized the average of binary cross-entropy and Dice loss. The training pipeline included extensive data augmentation12 of the Dicom images (rotation, zooming, shearing, translation, Gaussian noise and blurring, average pooling as well as brightness and contrast alterations). In order to retain subpixel accuracy masks were generated from contour polygons and the images were upscaled to 1.5 times the original resolution. Post processing was limited to extracting the largest connected contour polygon from the pixel masks.Evaluation: CNN performance was evaluated against the expert segmentations for 29 test cases using unreleased software called “Lazy Luna”, which allows for an automated, quantitative assessment of clinical results, a comparison of the underlying segmentations by metrics as well as a visualization of segmentation differences for qualitative analysis. Segmentation differences were characterized by millilitre difference, Dice, Hausdorff distance and segmentation decision. The networks were analysed on the contour level and subdivided by contour type (LV endocardium, LV myocardium, RV endocardium) and slice position in the heart chamber (basal, midventricular, apical) to illuminate the origin of clinical result differences. Using interactive correlation plots of segmentation differences allowed us to visualize differences and reveal image difficulties of failed contours.
Results
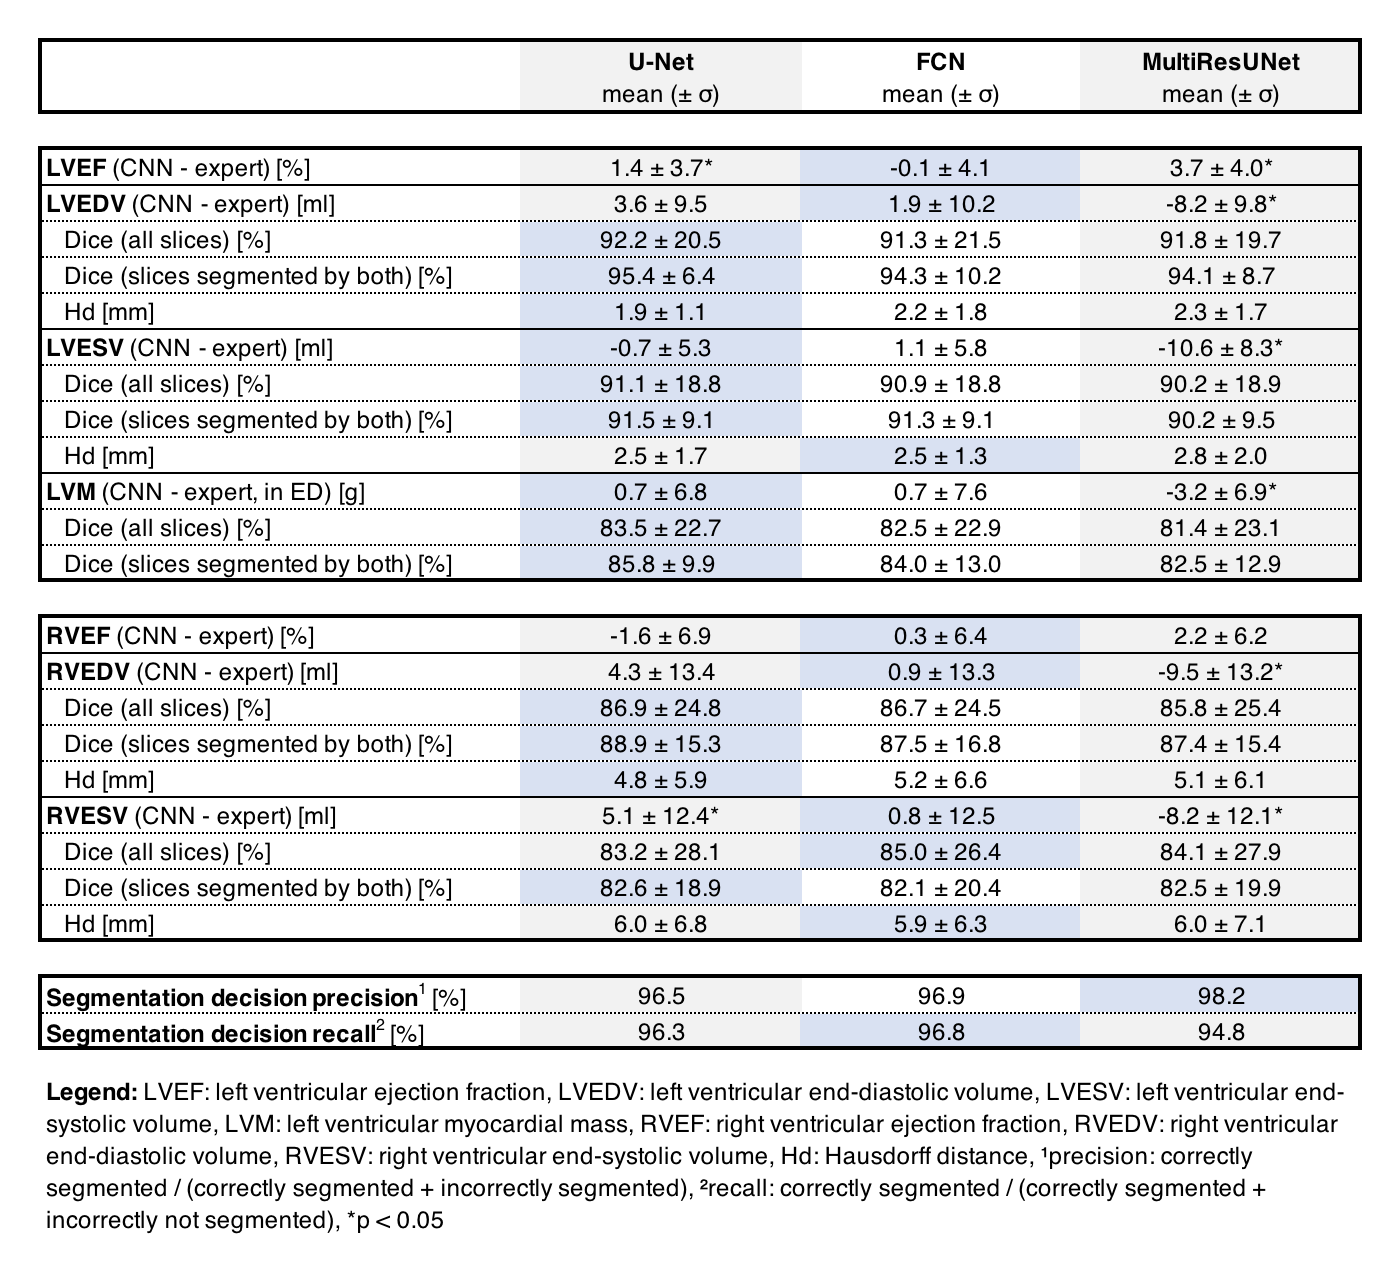
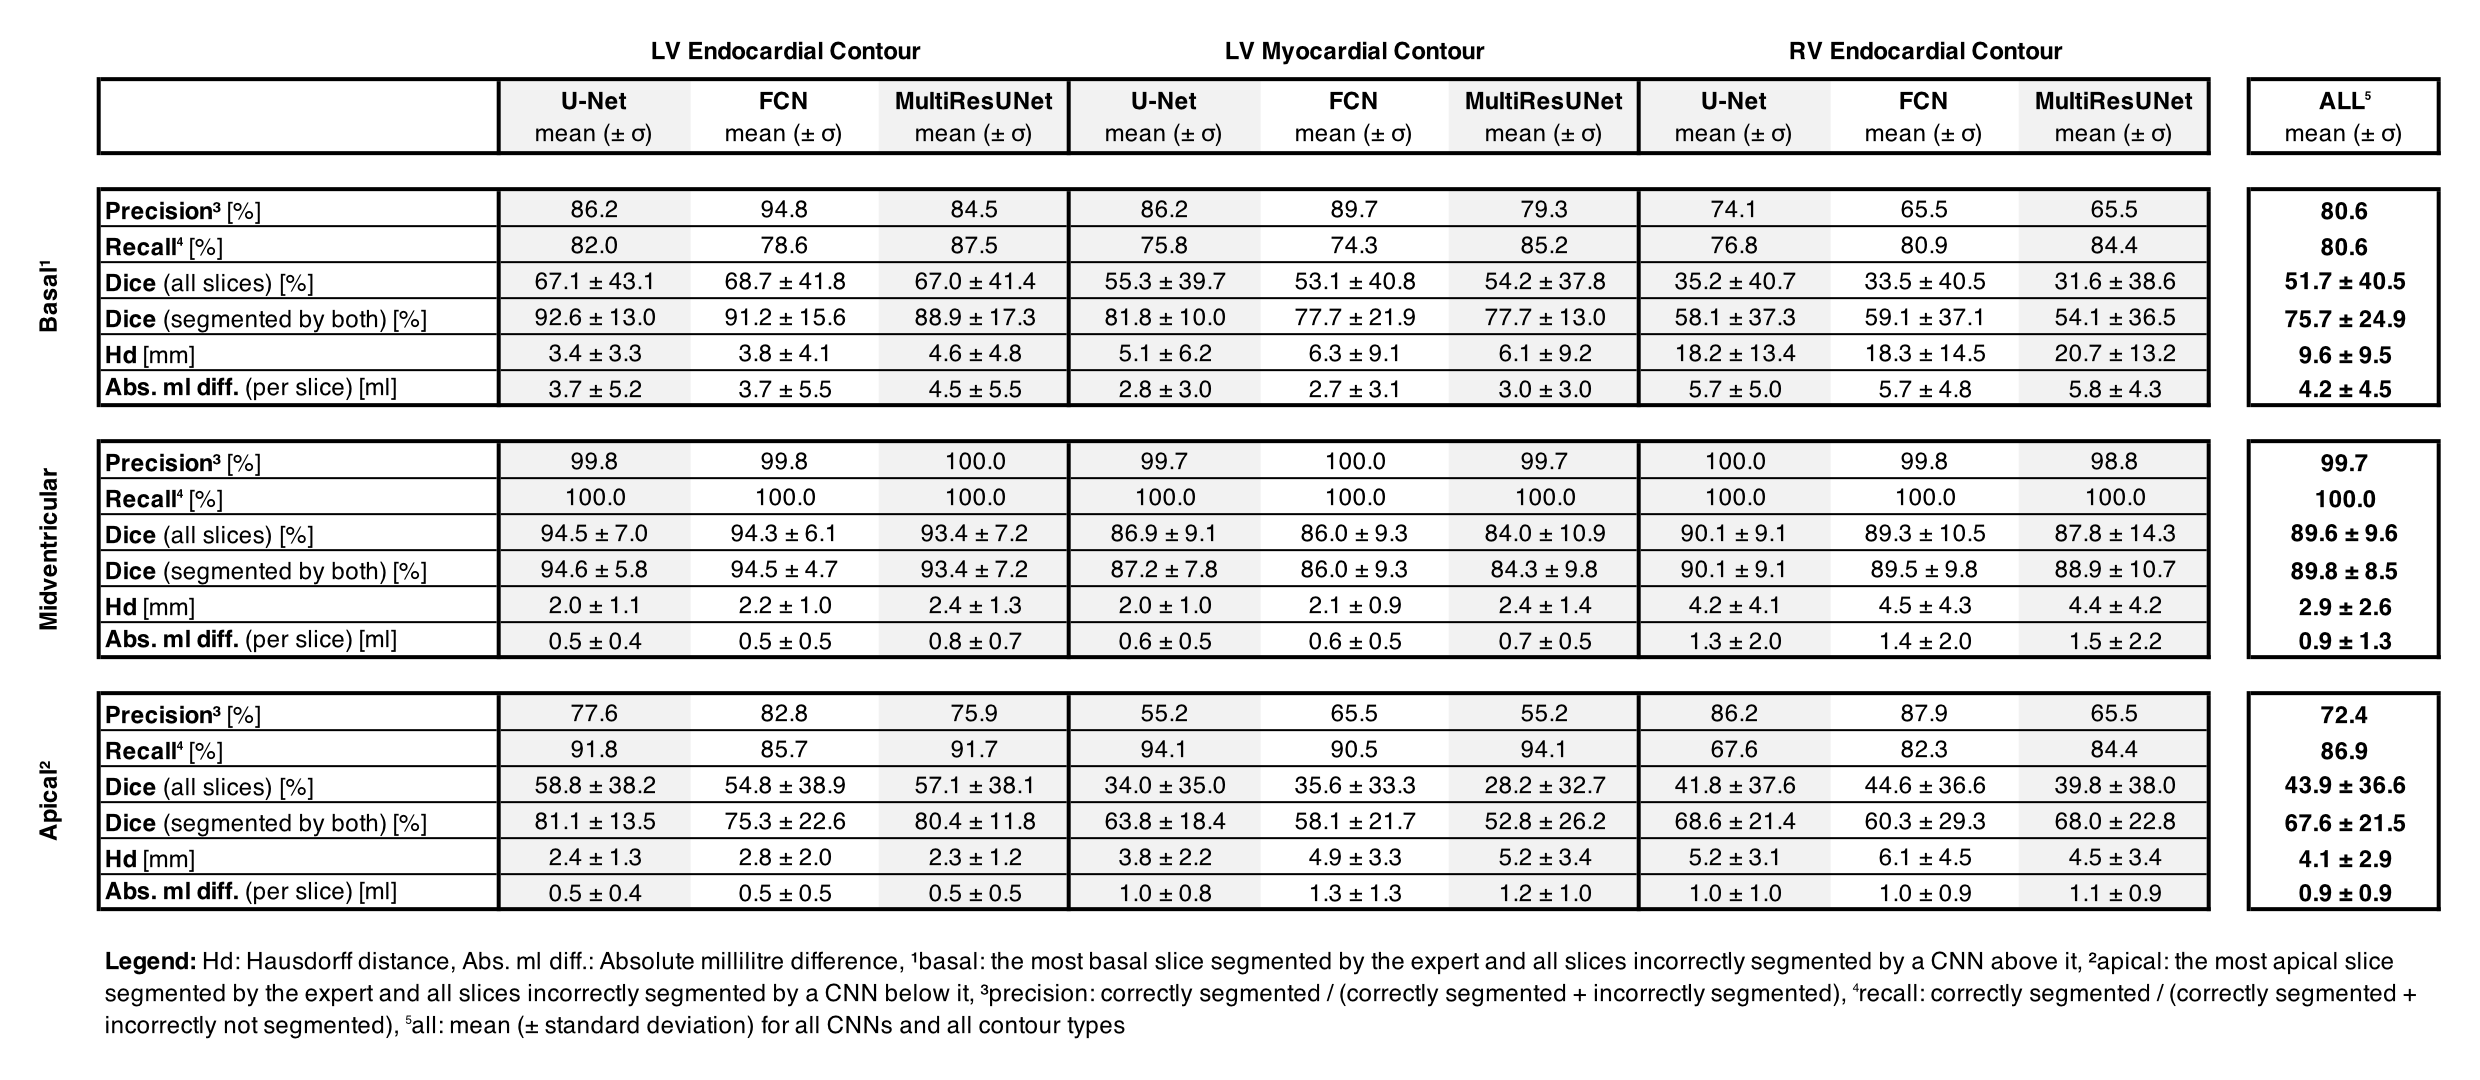
All networks show good agreement with the expert reader on the CS cine images in terms of quantitative clinical results (average Pearson correlation coefficient via Fisher’s z: rz’ = 0.978/0.977/0.978 for U-Net/FCN/MultiResUNet) and segmentation metrics (average Dice: 87.4%/87.3%/86.7% for U-Net/FCN/MultiResUNet). The MultiResUNet significantly underestimated all volumes and left ventricular mass (p<0.05, Table 1). On the level of clinical results all networks performed worse on the RV than the LV (Figure 1). Segmentation difficulties accumulate in the basal and apical slices where segmentation decision errors (mean precision: 80.6%/99.7%/72.4%, mean recall: 80.6%/100.0%/86.9% for basal/midventricular/apical respectively) or low Dice values occur. Basal errors produced large millilitre differences in the affected slices (mean absolute difference per slice: 4.2±4.5ml/0.9±1.3ml/0.9±0.9ml for basal/midventricular/apical), while midventricular slices show high Dice values (average Dice: 51.7%/89.6%/43.9% for basal/midventricular/apical). Qualitative visual inspection revealed repeated errors made by all networks for challenging images due to difficult valve detection and poor contrast in apical slices (Figure 2).Discussion
Multilevel analysis allowed illuminating segmentation errors and failures in order to give detailed feedback on CNN performance for short-axis CS cine images. The U-Net and FCN offer the best clinical results on our dataset, which is interesting given the comparative simplicity of the network architectures. Correlation plots of metric values facilitated quick investigation of qualitative reasons for failed segmentations. The correlation plots point out network biases towards certain qualitative mistakes, such as difficulties with apical fat, misinterpreted basal slices and torn myocardia. Here, the networks performed similarly to each other while the MultiResUNet performed slightly worse across all contours and cardiac positions. The good agreement between networks and the expert reader are explained by the high Dice values in the midventricular slices, which make up the majority of slices. All networks have difficulties with segmentation decisions in the basal and apical slices with the largest millilitre differences in the RV. Future work could include predicting metric values without a ground truth to add qualitative error estimation to CNNs in the clinical setting.Conclusion
Multilevel evaluation of CNN performance on CS images revealed overall good agreement of quantitative results between all networks and the expert reader. All networks made similar qualitative segmentation errors and automatic RV segmentation was particularly difficult on our dataset. The combination of fast acquisition and automated post-processing will increase the efficiency of CMR in clinical routine, however eliminating segmentation failures is vital to increase acceptance and confidence in CNNs.Acknowledgements
The authors gratefully acknowledge funding from the German Research Foundation (GRK2260, BIOQIC).
This study was supported by the BMBF (Bundesministerium für Bildung und Forschung) / DZHK (German Centre for Cardiovascular Research) via project FKZ81Z0100208
We would like to thank everyone in our working group who helped us with their suggestions and stimulating conversations.
References
1. Schulz-Menger J, Bluemke DA, Bremerich J, Flamm SD, Fogel MA, Friedrich MG, et al. Standardized image interpretation and post-processing in cardiovascular magnetic resonance - 2020 update : Society for Cardiovascular Magnetic Resonance (SCMR): Board of Trustees Task Force on Standardized Post-Processing. J Cardiovasc Magn Reson. 2020;22(1):19.
2. Bernard O, Lalande A, Zotti C, Cervenansky F, Yang X, Heng PA, et al. Deep Learning Techniques for Automatic MRI Cardiac Multi-Structures Segmentation and Diagnosis: Is the Problem Solved? IEEE Trans Med Imaging. 2018;37(11):2514-25.
3. Bai W, Sinclair M, Tarroni G, Oktay O, Rajchl M, Vaillant G, et al. Automated cardiovascular magnetic resonance image analysis with fully convolutional networks. J Cardiovasc Magn Reson. 2018;20(1):65.
4. Tao Q, Yan W, Wang Y, Paiman EHM, Shamonin DP, Garg P, et al. Deep Learning-based Method for Fully Automatic Quantification of Left Ventricle Function from Cine MR Images: A Multivendor, Multicenter Study. Radiology. 2019;290(1):81-8.
5. Sander J, de Vos BD, Isgum I. Automatic segmentation with detection of local segmentation failures in cardiac MRI. Sci Rep. 2020;10(1):21769.
6. Lustig M, Donoho D, Pauly JM. Sparse MRI: The application of compressed sensing for rapid MR imaging. Magn Reson Med. 2007;58(6):1182-95.
7. Vincenti G, Monney P, Chaptinel J, Rutz T, Coppo S, Zenge MO, et al. Compressed sensing single-breath-hold CMR for fast quantification of LV function, volumes, and mass. JACC Cardiovasc Imaging. 2014;7(9):882-92.
8. Wang J, Li X, Lin L, Dai JW, Schmidt M, Forman C, et al. Diagnostic efficacy of 2-shot compressed sensing cine sequence cardiovascular magnetic resonance imaging for left ventricular function. Cardiovasc Diagn Ther. 2020;10(3):431-41.
9. Ronneberger O, Fischer P, Brox T. U-Net: Convolutional Networks for Biomedical Image Segmentation. Medical Image Computing and Computer-Assisted Intervention – MICCAI 2015. Lecture Notes in Computer Science2015. p. 234-41.
10. Long J, Shelhamer E, Darrell T. Fully Convolutional Networks for Semantic Segmentation2014 November 01, 2014:[arXiv:1411.4038 p.]. Available from: https://ui.adsabs.harvard.edu/abs/2014arXiv1411.4038L.
11. Nabil I, Rahman MS. MultiResUNet : Rethinking the U-Net architecture for multimodal biomedical image segmentation. Neural Networks. 2020;121:74-87.
12. Jung AB, Wada K, Crall J, Tanaka S, Graving J, Reinders C, et al. imgaug. 2020. Available from: https://github.com/aleju/imgaug. Accessed November 07, 2021.
Figures
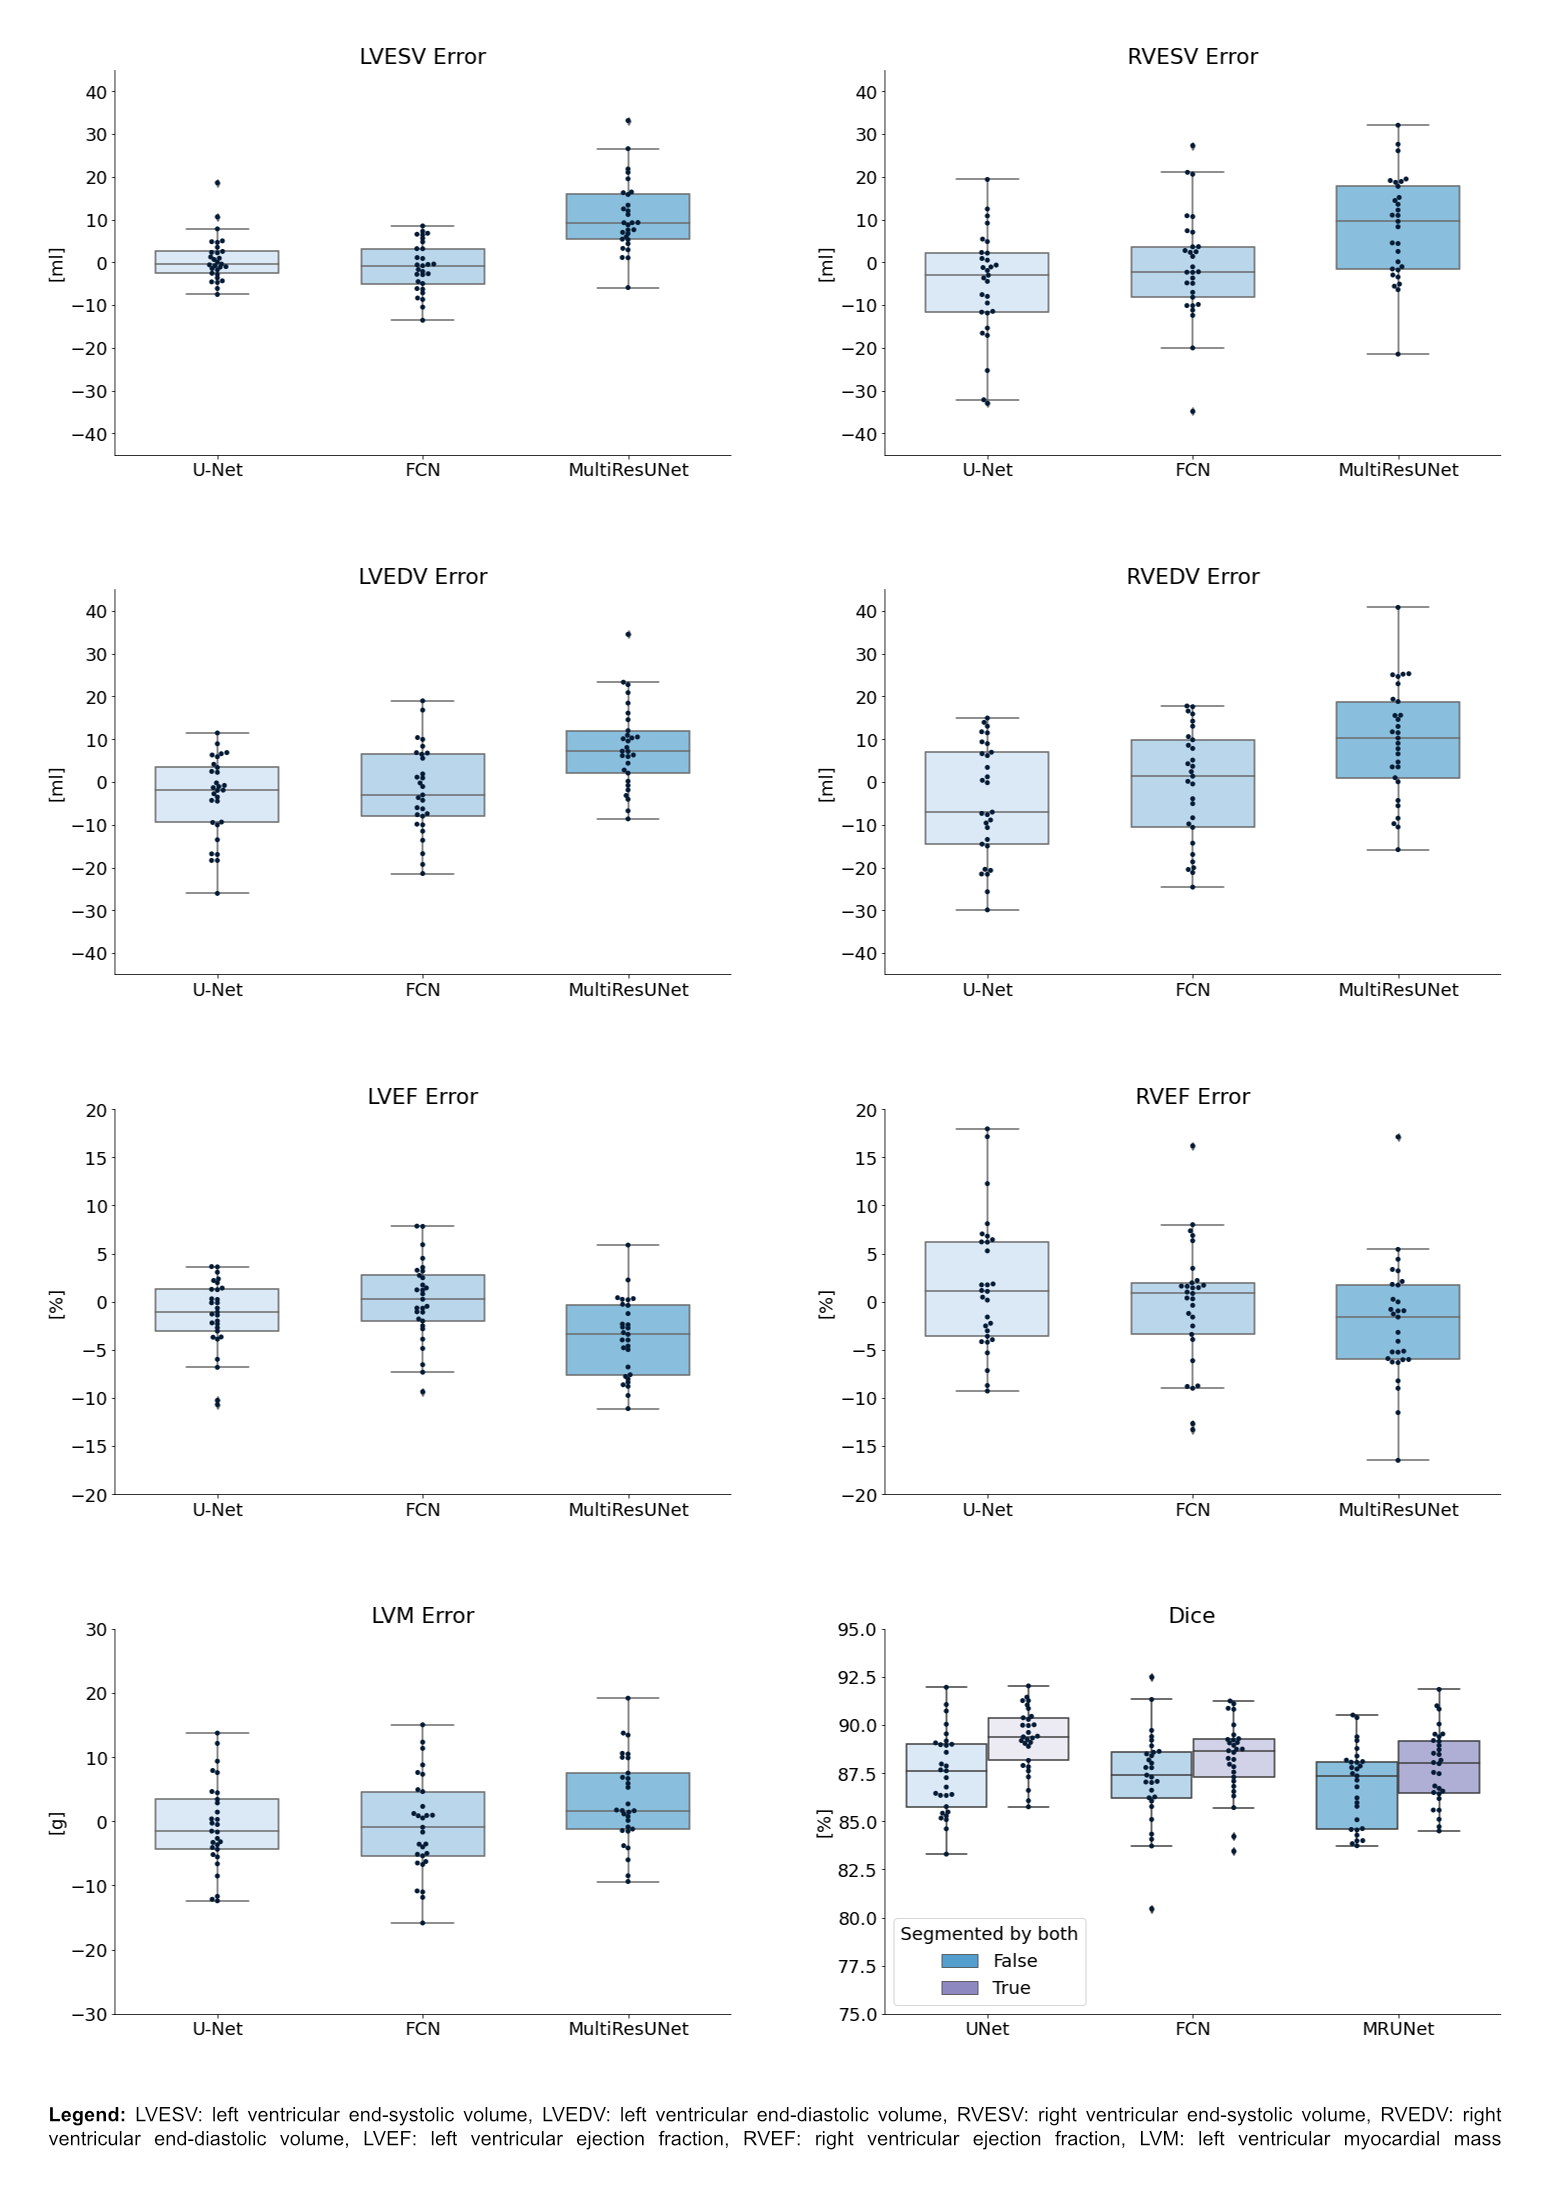
Figure 1: Boxplots of Clinical Result Errors and Dice Values
Boxplots show quantile 1, median and quantile 3 of mean errors and Dice values for all test cases compared to the expert. The last plot offers two Dice boxplots per network, one for all images, another restricted to images segmented by reader and network.
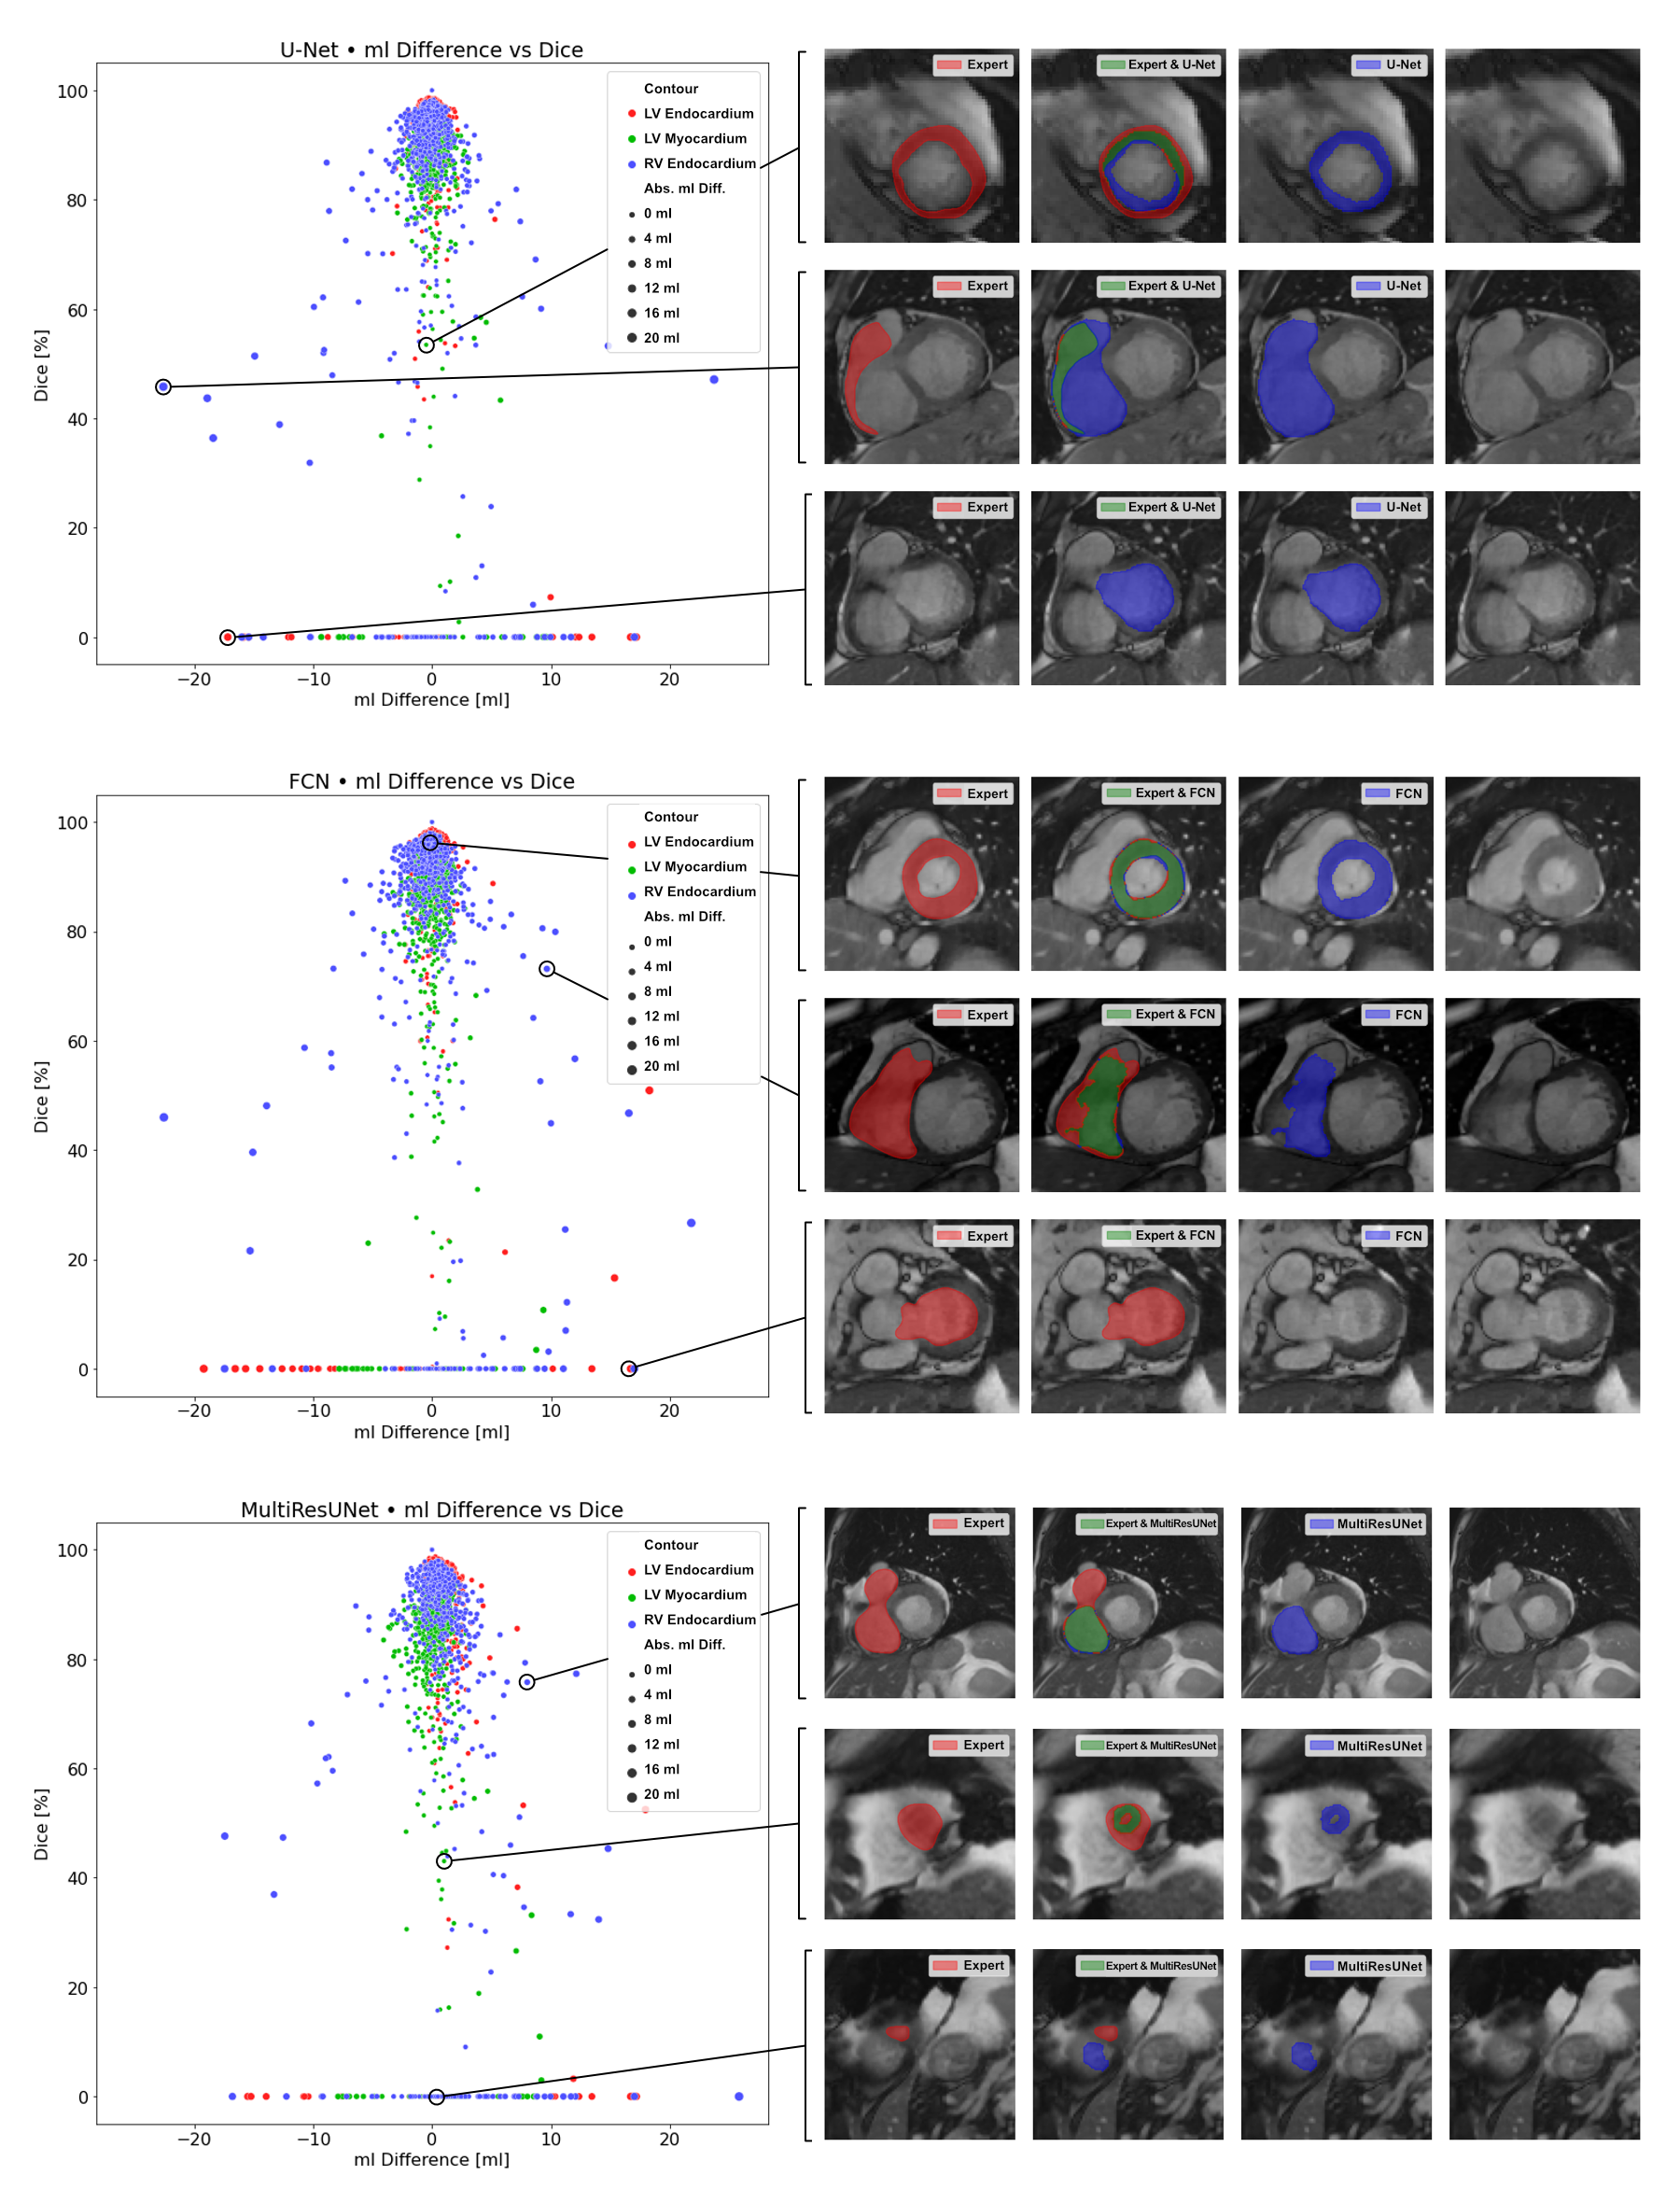
Figure 2: Correlation Plots of Segmentation Comparisons
A subplot refers to the comparison of one networks’ contours to the expert’s contours. Every point represents a contour comparison as millilitre difference and Dice value. Its colour distinguishes LV endocardium (red), LV myocardium (green) and RV endocardium (blue) contours. The point size implies the absolute millilitre difference. On the right visualizations of the comparisons are presented.
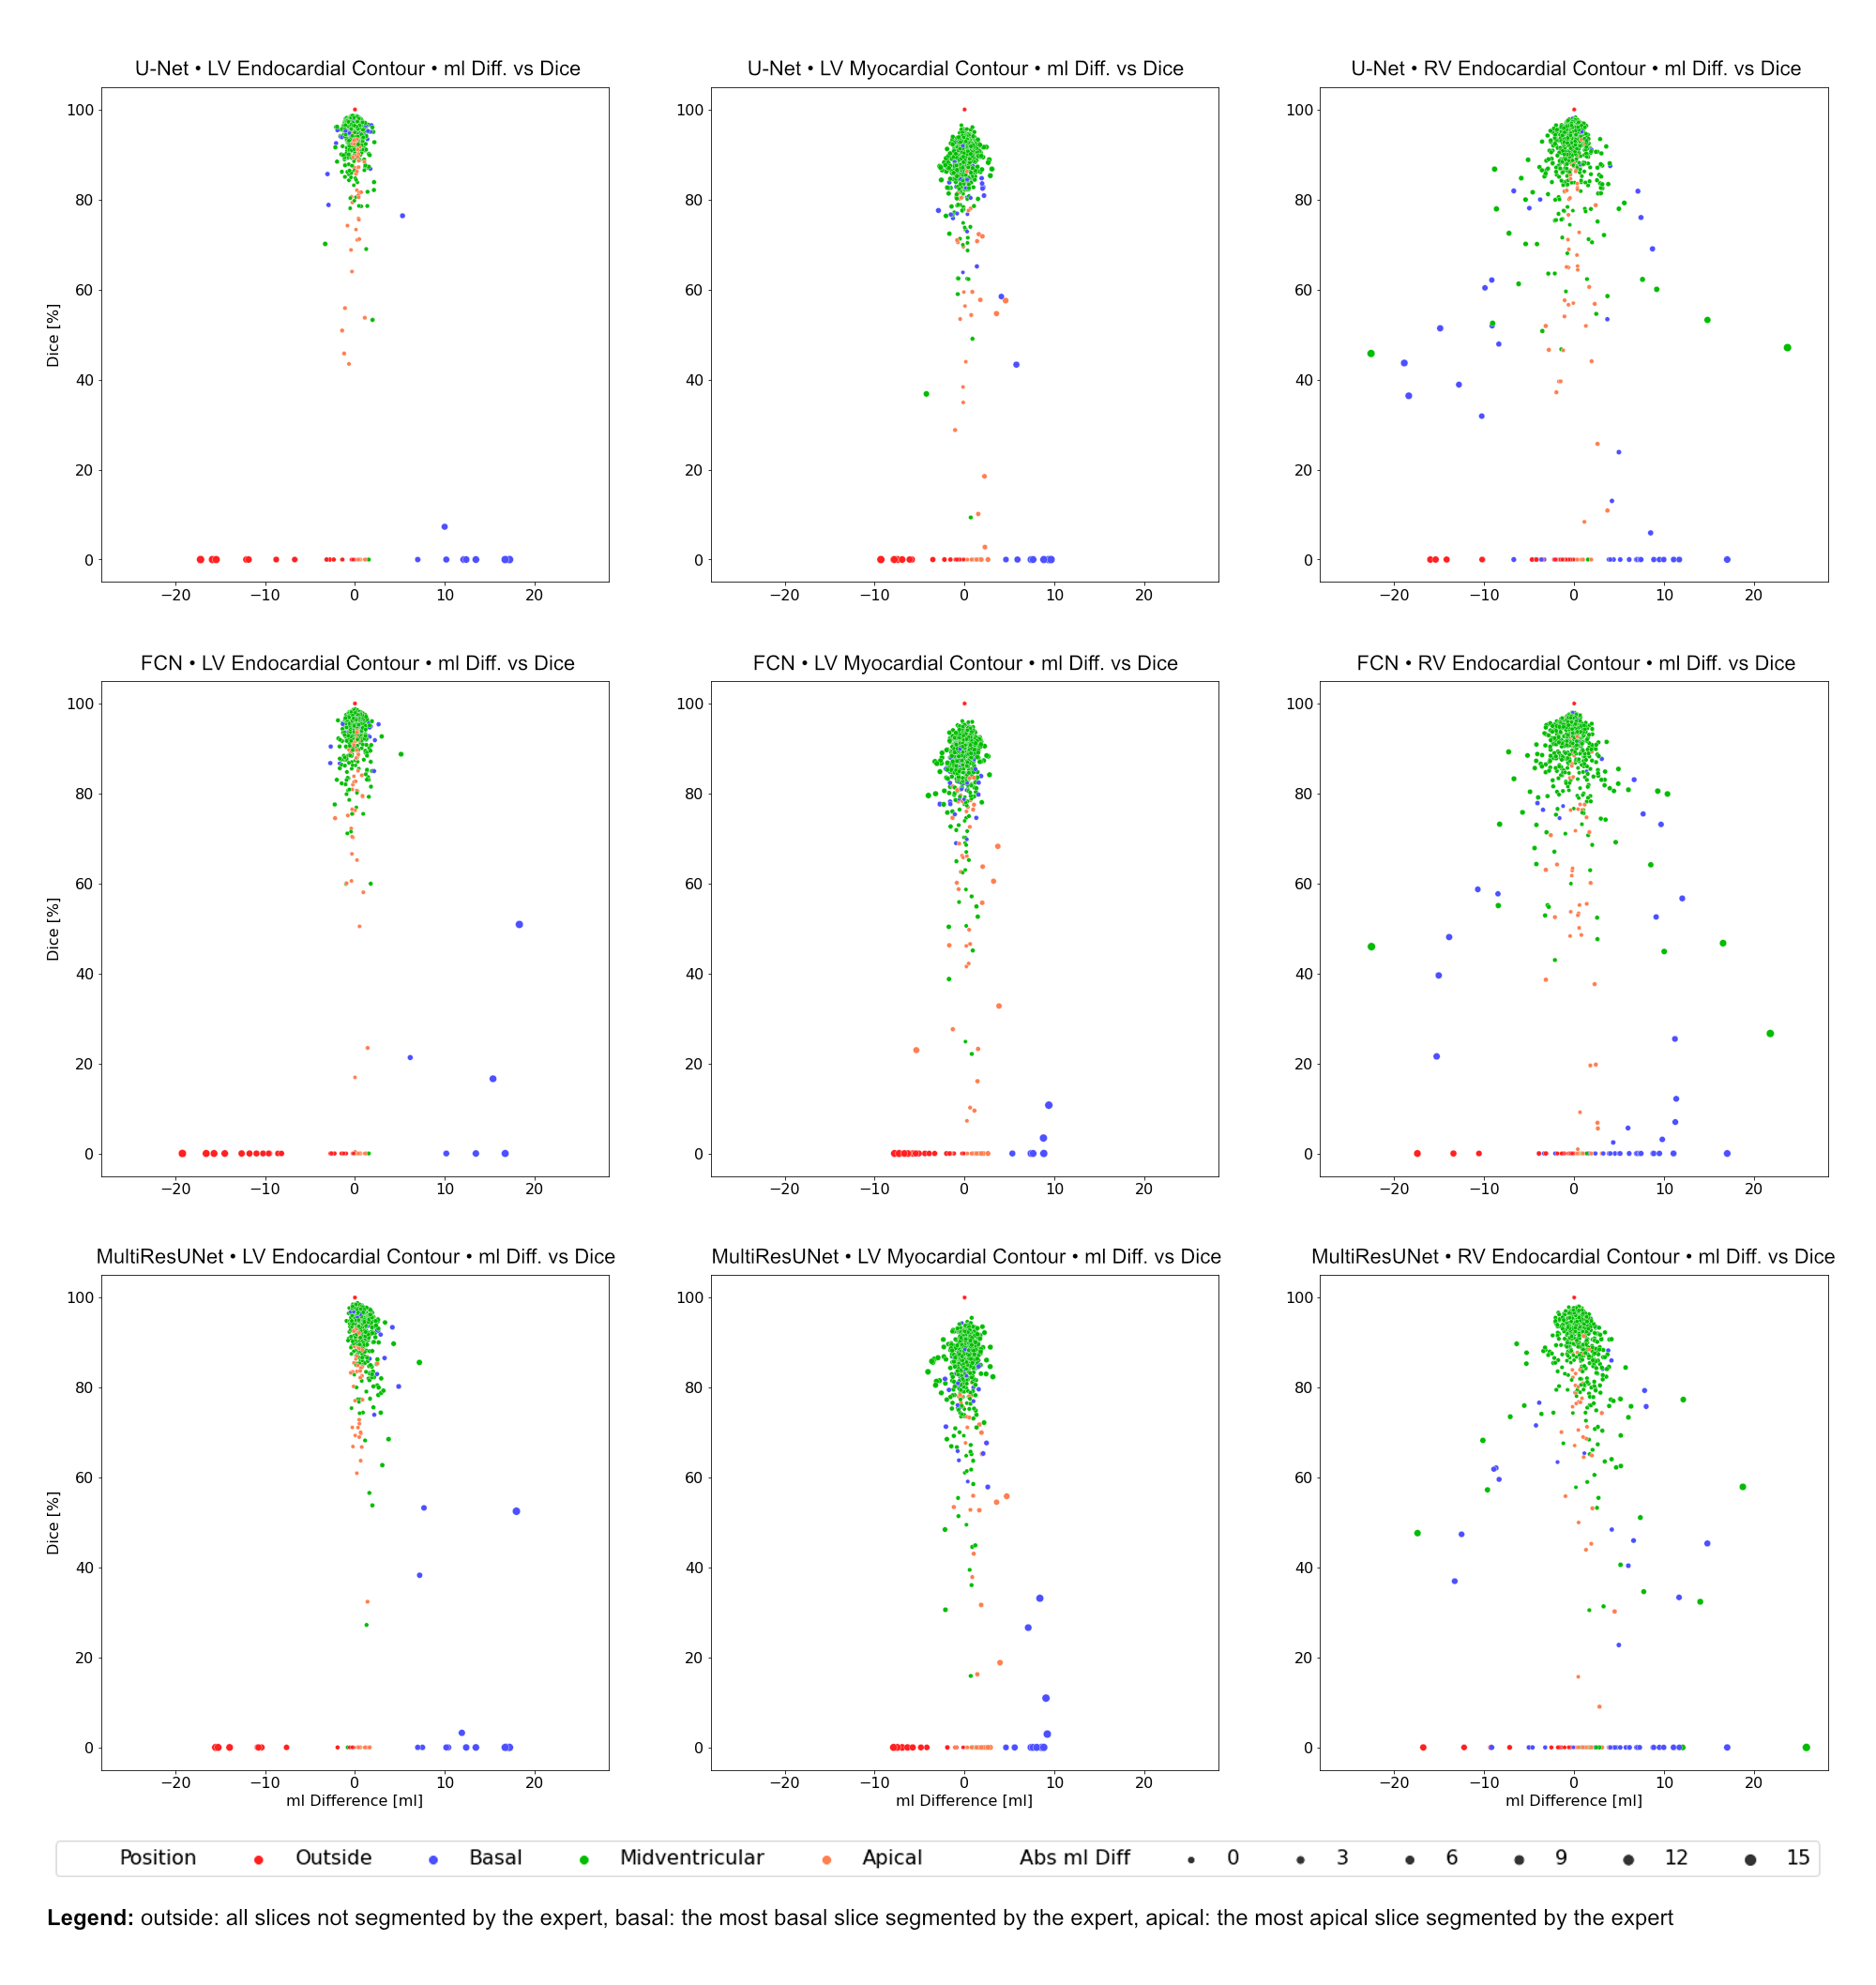
Figure 3: Correlation Plots of Segmentation Comparisons per CNN Subdivided by Contour Type
Rows identify the network compared to the expert. Columns identify the considered contour type. Every point represents a contour comparison characterized by millilitre difference and Dice value. Colour signifies the cardiac slice position according to the expert: outside the heart, basal, midventricular, apical.