1833
A1-diameter asymmetry of the Circle of Willis induces blood-flow changes directed towards the anterior communicating artery1Radiology, UMC Utrecht, Utrecht, Netherlands, 2Neurology, UMC Utrecht, Utrecht, Netherlands
Synopsis
Asymmetry in diameter of the pre-communicating part (A1-segment) of both anterior cerebral arteries is common and is related to anterior communicating artery aneurysm formation. We used TOF-MRA and 4D phase-contrast 3T-MRI in 122 subjects without intracranial aneurysms, and found that blood-flow asymmetry between A1-segments increased linearly with increasing A1 diameter asymmetry. Asymmetry of >30% in A1-segment diameters resulted in statistical significant blood-flow differences compared to persons with symmetric A1-segments. Whether this >30% A1-diameter asymmetry is a good cut-off to define a risk factor for anterior communicating artery aneurysm formation requires further research.
Introduction
The Circle of Willis (CoW) is a network distributing blood from the internal carotid arteries (ICA) and vertebral arteries to the brain1. Both ICAs supply blood via the right and left anterior cerebral arteries (ACA), that are connected by the anterior communicating artery (Acom), to the anterior part of the brain. Intracranial aneurysms (IA) located at the Acom are the most common IA (23-40%)23. Asymmetry between the right and left diameter of the pre-communicating part (A1-segment) of the ACA is common and plays an important role in formation of Acom aneurysms4. Blood-flow asymmetry between right and left A1-segments is thought to be an underlying factor in Acom aneurysm formation, growth and possibly rupture5. However, the definition of diameter asymmetry varies in the literature and has not been related to in vivo blood-flow measurements with the same imaging modality. The aims of this study are twofold. First, to gain insight in the relationship between diameter asymmetry and blood-flow differences in A1-segments using 4D blood-flow hemodynamics. Second, to define a cut-off value for A1-asymmetry that leads to statistical significant blood-flow differences between right and left A1-segments.Methods
This study included subjects from the ERASE (Early Recognition of persons at high risk of Aneurysmal Subarachnoid hemorrhagE) study, a screening study for IA in family members of patients with an unruptured IA. We included 122 subjects with no IA on TOF-MRA and complete 4D PC-MRI datasets. All subjects were scanned on 3T-MRI with a 32‐channel head coil (Philips Healthcare, Best, The Netherlands). 4D PC-MRI parameters: 190(Feet-head)x190(Left-Right)x40(Anterior-Posterior)mm3 FOV, acquired spatial resolution 0.9x0.9x0.9mm3, TR/TE=4.2/2.4 ms, flip angle=10°, reconstructed temporal resolution of 50ms, unidirectional VENC=120cm/s, retrospective cardiac gating and acquisition duration 3x3:44 min:sec (with heart rate of 64 bpm). TOF-MRA parameters: 200(Feet-head)x200(Left-Right)x80(Anterior-Posterior)mm3 FOV, acquired spatial resolution 0.5x0.5x0.5mm3, TR/TE=22/3.4 ms, flip angle=18° and acquisition duration was about 5 minutes.Diameter measurements were performed manually on the TOF-MRA using an in-house developed Mevislab tool for both A1-segments at 50% of their length. A1 diameter asymmetry was defined as: (Absolute(DiameterRight–DiameterLeft)/Diametermean). The subjects were divided into five groups based on A1-diameter:
1. symmetric A1-segments (≤10% diameter asymmetry between right and left A1);
2. 11-20% asymmetry;
3. 21-30% asymmetry;
4. 31-40% asymmetry;
5. >40% asymmetry.
The larger A1-segment represented the dominant side, the smaller A1 segment was the non-dominant side. 4D PC-MRI datasets were analyzed using CAAS MR Solutions v5.1.1 software (Pie Medical Imaging, Maastricht, The Netherlands), which automatically generates the centerline and perpendicular slices of the A1-segment (Figure 1). These perpendicular slices were visually checked and automatically propagated to create volumetric flow rate traces and separate velocity traces over the cardiac cycle. The measurement halfway the A1-segment length was used to calculate the velocity pulsatility index (vPI=(Vmax-Vmin)/Vmean).
We assessed differences in diameter and blood-flow between right and left A1-segments using paired t-tests for all groups. To assess the influence of diameter on blood-flow, we used a linear mixed-effects model with the dominant side (larger A1) as mixed-effect, and applied this for all A1-segments together and separately for each group. The statistical significance threshold was set at p<0.05.
Results
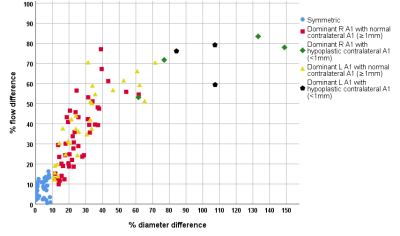
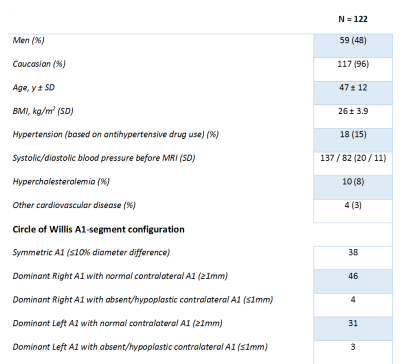
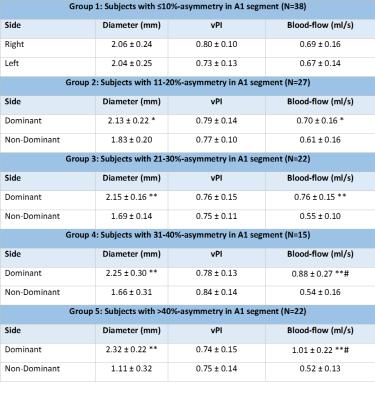
Table 1 shows the baseline characteristics and A1-segment configurations of the 122 subjects. Table 2 displays the diameter, blood-flow and vPI measurements in the five subgroups. A1-diameter and blood-flow were significantly correlated (R2=0.52) for all five groups, and all asymmetric groups showed significantly higher blood-flow at the dominant (larger A1) side compared to the non-dominant side. The blood-flow difference increased linearly with diameter difference (Figure 2). Asymmetry of the A1 segments of >30% (group 4 and 5) resulted in statistical significant blood-flow increase (P<0.001) at the dominant side compared to the mean blood-flow in symmetric A1-segments. All seven persons with a absent/hypoplastic(<1 mm) A1 had >50% difference in flow distribution (Figure 2). vPI did not change significantly in the five groups.Discussion
This study showed that the blood-flow difference between asymmetric A1-segments increased linearly with increasing A1-segment diameter asymmetry with statistically significantly higher blood-flow on the dominant side compared to the non-dominant side for all degrees of A1-asymmetry. Furthermore, >30% of A1-asymmetry showed a statistically significant increase in blood-flow in the dominant A1-segments of the CoW compared to symmetric A1-segments.A previous study showed that A1-asymmetry on MRA causes unequal bilateral carotid inflow on Doppler sonography6. Another study found that >40% asymmetry on CT angiography and low blood flow pulsatility of the A1 segments on transcranial sonography were risk factors for Acom aneurysms5. This CT study used a category of 10-40% asymmetry, precluding more detailed asymmetry analysis. Strengths of our study are the relatively large sample size; analysis of TOF-MRA and 4D PC-MRI flow in the same session, and the use of 4D-flow measurements which enable simultaneous assessment of the both, full A1-segments. A limitation is that we assessed asymmetry only in healthy participants without IA.
Conclusion
This study showed that blood-flow differences between asymmetric A1-segments increased linearly with increasing A1 diameter difference. A1-segment diameter asymmetry of >30% resulted in statistically significant blood-flow differences compared to symmetric A1-segments. Whether this >30% A1-asymmetry is a good cut-off to define a risk factor for Acom aneurysm formation requires further research.Acknowledgements
We thank the study participants and magnetic resonance technicians for their support and participation. We acknowledge the support of The Netherlands CardioVascular Research Initiative: the Dutch Heart Foundation (CVON 2015‐008 ERASE), Dutch Federation of University Medical Centers, The Netherlands Organization for Health Research and Development, and the Royal Netherlands Academy of Sciences.References
1. Shen Y, Wei Y, Bokkers RPH, Uyttenboogaart M, Van Dijk JMC. Study protocol of validating a numerical model to assess the blood flow in the circle of Willis. BMJ Open. 2020;10(6):1-6.2. Keedy A. An overview of intracranial aneurysms. McGill J Med. 2006;9(2):141-146.
3. Chen J, Li M, Zhu X, et al. Anterior Communicating Artery Aneurysms: Anatomical Considerations and Microsurgical Strategies. Front Neurol. 2020;11:1-15.
4. Kancheva AK, Velthuis BK, Ruigrok YM. Imaging Markers of Intracranial Aneurysm Development: A Systematic Review. J Neuroradiol. Published online 2021:1-6.
5. Kaspera W, Ładziński P, Larysz P, et al. Morphological, hemodynamic, and clinical independent risk factors for anterior communicating artery aneurysms. Stroke. 2014;45(10):2906-2911.
6. Wu TC, Chen TY, Ko CC, Chen JH, Lin CP. Correlation of internal carotid artery diameter and carotid flow with asymmetry of the circle of Willis. BMC Neurol. 2020;20(1):1-9.
Figures


Table 1: Baseline characteristics of the 122 included subjects.

Table 2: Diameter, Velocity Pulsatility Index (vPI) and blood-flow of the A1 segments for all five groups. For group 1, we show left and right side of the A1, since there is no dominant side. For the other groups we show the outcome parameters for the dominant and non-dominant sides.
*p<0.05, **p<0.001 comparing dominant to non-dominant side, #p<0.001 versus group 1.