1829
Layer-specific microsimulation of S2 cortex revealed distinct functional microcircuits in non-human primate brain
Pai-Feng Yang1,2, Feng Wang1,2, Jamie L. Reed1,2, Zhangyan Yang1,2, John C. Gore1,2, and Li Min Chen1,2
1Institute of Imaging Science, Vanderbilt University, Nashville, TN, United States, 2Radiology and Radiological Sciences, Vanderbilt University Medical Center, Nashville, TN, United States
1Institute of Imaging Science, Vanderbilt University, Nashville, TN, United States, 2Radiology and Radiological Sciences, Vanderbilt University Medical Center, Nashville, TN, United States
Synopsis
Intracortical microstimulation is one of the most common techniques used to activate cortical functional networks and probe causal connections. This study investigates whether BOLD signals can detect layer-specific functional circuit responses to electrical brain stimulation. We delivered electrical current to different layers of secondary somatosensory cortex (S2) and detected layer-specific BOLD activations. Effective functional connectivity analysis revealed different networks to different layers of S2 cortex.
Intracortical microstimulation is one of the most common techniques used to activate cortical functional networks and probe causal connections. This study investigates whether BOLD signals can detect layer-specific functional circuit responses to electrical brain stimulation. We delivered electrical current to different layers of secondary somatosensory cortex (S2) and detected layer-specific BOLD activations. Effective functional connectivity analysis revealed different networks to different layers of S2 cortex.
Introduction
Inter-layer functional connections are the building blocks of cortical functional networks. Layer-specific anatomical and functional alterations have been linked to neurological and mental disorders. We combined layer-specific microstimulation of S2 cortex and whole brain fMRI in squirrel monkeys and evaluated different layer-associated functional networks. We found that deeper and middle layers of S2 exhibited differential effectivity connectivity pattens to multiple cortical areas.Method
- a. Animal Setup and Data Acquisition:For fMRI acquisitions, each animal was sedated with ketamine hydrochloride/atropine and maintained on mechanical ventilation with isoflurane anesthesia (0.5-1.1%) delivered in a O2/N2O mixture. MRI scans were performed on a 9.4 T Inova magnet (Varian Medical Systems) using a Doty transmit-receive coil (inner diameter 85 mm). FMRI BOLD data using a gradient echoplanar imaging (EPI) sequence [repetition time (TR), 1500 ms; 2 shots; echo time (TE), 10 ms; 0.859 x 0.859 x 1 mm3 voxel size, 3 s per volume, 290 volumes] were acquired and analyzed. Thresholded activation maps were spatially coregistered to higher resolution T2*-weighted GE structural images (TR, 480 ms; TE, 10 ms; 0.107 x 0.107 x 1 mm3 resolution) for display.
- b. Stimulation Paradigms:Biphasic electrical current of 1 mA with a pulse width of 0.2 ms at 5 Hz was delivered through an MR-compatible microelectrode array (UNC multichannel electrode [1]) to S2 using channels 1-3 and 5-7 and a stimulator (S48, Grass Technologies) with a constant-current isolator (A385, WPI). Stimuli consisted of 15 trains of 12 s duration interleaved with 21 s without stimulation.
- c. Data processing:The standard pre-processing of fMRI images was performed using AFNI. EPI data were co-registered to each subject’s anatomic images using FSL (FLIRT). Brain regions responding to electrical stimulation were identified using standard GLM analysis. The PPI (psychophysiological interactions) regressors [2] based on characteristic temporal variations associated with stimulus conditions were used to evaluate the effective connectivity between different cortical layers. A direct comparison of effective connectivity based regressor coefficients (beta values) was performed to evaluate the micro-electrical stimulation effect in the brain.
Results
We performed simultaneous intracortical microstimulation and fMRI. Electrical stimulation of different layers evoked BOLD activation in S2 near the site of the linear electrode and in other cortical and subcortical areas known to have direct and indirect anatomical connections to S2, including area 3b, cingulate cortex, insular cortex, caudate putamen (CPu), and ventral posterior lateral nucleus (VPL) (Figure 1). We used Psychophysiological Interaction (PPI) analysis for investigating whole brain effective connectivity strengths during layer-specific activation in S2. Regression coefficients (beta values) were measured and compared for selected ROIs to middle (contact 5-7) and deeper (contact 1-3) layers. We found weaker connectivity between CPu and VPL to deeper cortical layers of S2 (Figure 2). The mean and standard error of these coefficients are shown in Figure 2. Statistically significant differences were measured using unpaired t test with Welch-correction.Conclusion
This study demonstrated that layer-specific electrical stimulation of S2 activated distinct interconnected brain regions and showed differential connectivity strengths to CPu and thalamic VPL nucleus. Layer-specific microstimulation combined with fMRI offers a powerful tool to parcellate fine-grained microcircuits.Acknowledgements
Technical assistance from Choahui Tang was highly appreciated. This study was supported by National Institutes of Health Grant NIH R01 NS078680.References
- [1] Lai HY, Liao LD, Lin CT, Hsu JH, He X, et al. Design, simulation and experimental validation of a novel flexible neural probe for deep brain stimulation and multichannel recording. J Neural Eng 2012, 9: 036001.
- [2] O'Reilly, J.X., et al., Tools of the trade: psychophysiological interactions and functional connectivity. Soc Cogn Affect Neurosci, 2012, 7(5): p. 604-9.
Figures
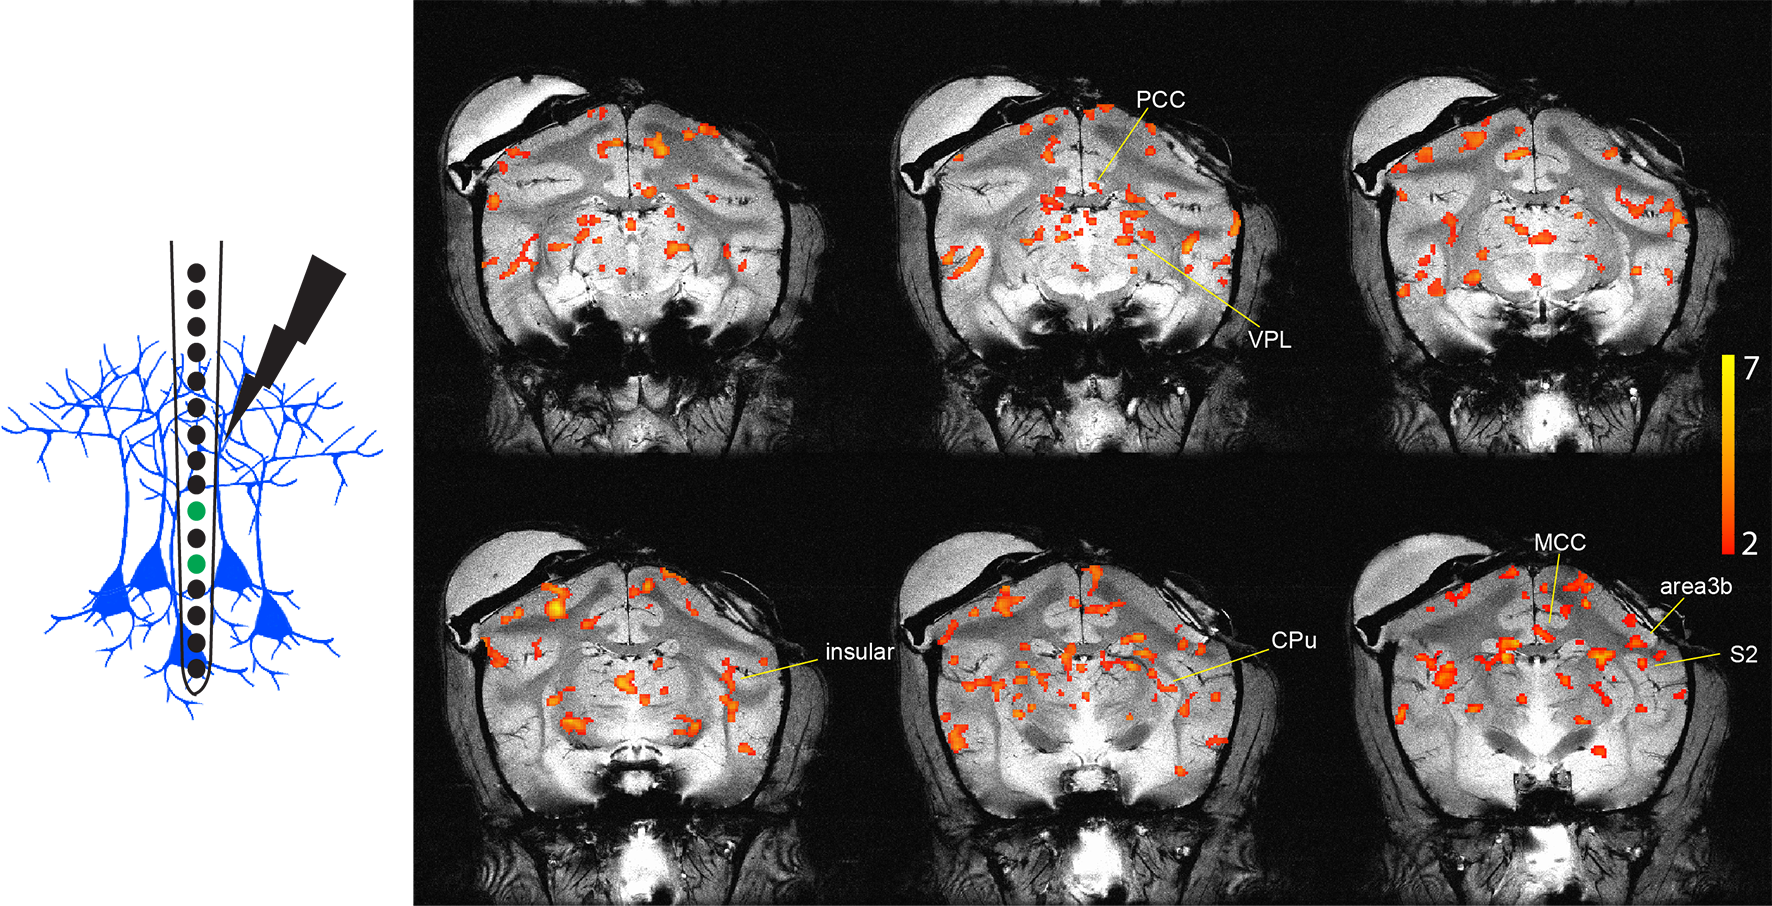
Figure 1. fMRI activation to microstimulation of S2 cortex. Left: Schematic illustration shows how stimulation of different cortical layers was achieved by using different contacts on a linear electrode array. Middle layer contacts 5-7 shown in green. Right: Stimulus evoked fMRI BOLD activation map in response to microstimulation from middle layer contacts (thresholded at t > 2, p < 0.05, FDR corrected) overlaid on the structural images. Activated areas include area 3b, S2, MCC, PCC, CPu, insular cortex, and VPL.
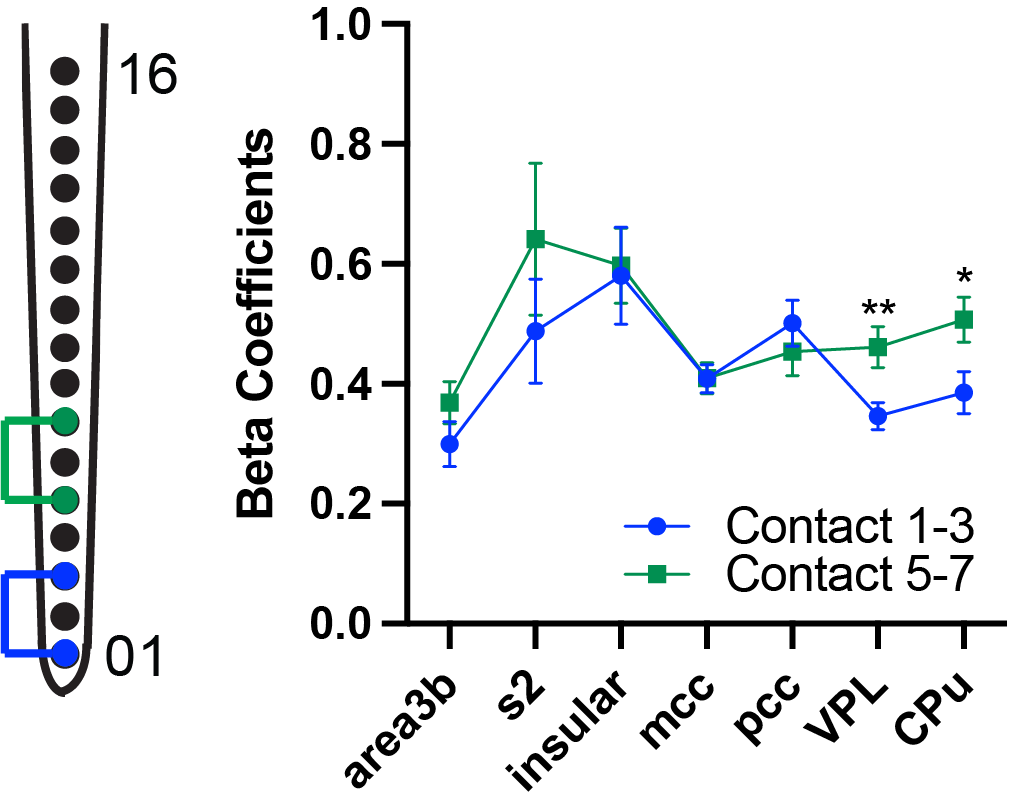
Figure 2. Comparison of PPI effective connectivity measures using regression coefficients (beta value) during stimulation of different layers in S2. Mean and standard error of beta coefficient using effective connectivity-based PPI regressor in the seven regions (blue: contact 1-3; green: contact 5-7). Statistical significance of difference measures using unpaired t test shown (*: p < 0.05 and **: p < 0.005, Welch-corrected).
DOI: https://doi.org/10.58530/2022/1829