1827
Multimodal BOLD and CBV MRI for artifact correction in fluorescence recordings1Clinic for Radiology, University Hospital Muenster, Muenster, Germany
Synopsis
Combining fMRI and fluorescence recordings has become an important tool for neuroimaging. However, hemodynamic changes lead to artifacts in fluorescence recordings, since blood absorbs fluorescence light. We investigated the hemodynamic artifact in functional and pharmacological MRI and fluorescence measurements and present an MRI-based correction method. In both stimulation and lactate injection experiments, hemodynamic artifacts in FRET recordings occurred. These artifacts cannot be removed effectively using a standard (purely optical) correction method. An MRI-based correction presented in this work eliminates the artifact while the expected fluorescence signal changes persist.
Introduction
Combining fMRI and fluorescence recordings has become an important tool for neuroimaging. However, hemodynamic changes cause artifacts in fluorescence signals, since blood absorbs fluorescence light. We investigated artifacts in functional and pharmacological MRI-fluorescence resonance energy transfer (FRET) measurements and present an MRI-based correction method. Changes in light absorption can be modelled by an absorption term exp(-Δμ).1 We extended this model by including a proportionality term between changes in absorption coefficient and MR signal (Δμ=b·M) obtained from either BOLD or CBV measurements.Methods
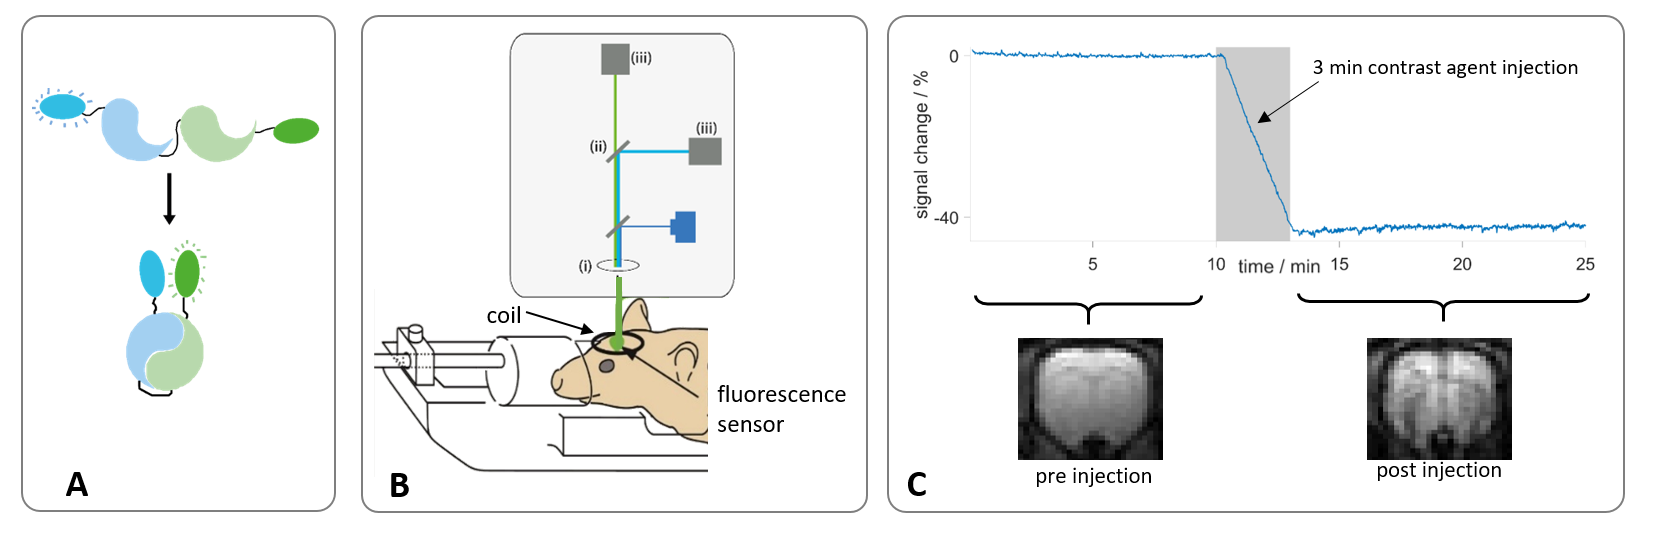
FRET sensors (Fig. 1A) Twitch2B2 (calcium) or Laconic3 (lactate) were expressed in the forelimb region (S1Fl) of Fischer rats (n=6, n=10) after viral transduction using AAV constructs. At least 4 weeks after AAV injection, fluorescence recordings were performed using a 400µm optical fiber (fig. 1B), under medetomidine sedation (supplemented by 0% or 0.4% isoflurane). MRI was performed at 9.4T using a 2cm surface coil.Functional measurements (fMRI-FRET):
Electrical forepaw stimulation was applied as block paradigm (5s-on/25s-off, 1ms pulses, 1.5mA, 9Hz). Simultaneous BOLD fMRI-FRET measurements were performed using a GE-EPI sequence (TE/TR 18/1000ms, FA 60°).
Pharmacological measurements (phMRI + phFRET):
Iron nanoparticles (Molday Ion, Biopal, 15mg Fe/kg) were injected before the acquisition of CBV measurements (fig. 1C). To avoid light absorption from the nanoparticles, phMRI and phFRET were performed separately but according to the same scheme: intravenous lactate injection (500mM, 2.5mM/kg, 3min). CBV scans (GE-EPI, TE/TR 8.2/1000ms, FA 52°) were performed in naïve rats (n=4).
Data were analyzed using MATLAB: A region of interest in S1FL was marked in BOLD fMRI datasets. The BOLD response was extracted by averaging the signal of activated voxels, which were identified using a voxel-wise U-test.4 Time courses of phMRI datasets were calculated by summing up signals of all voxels within the ROI.
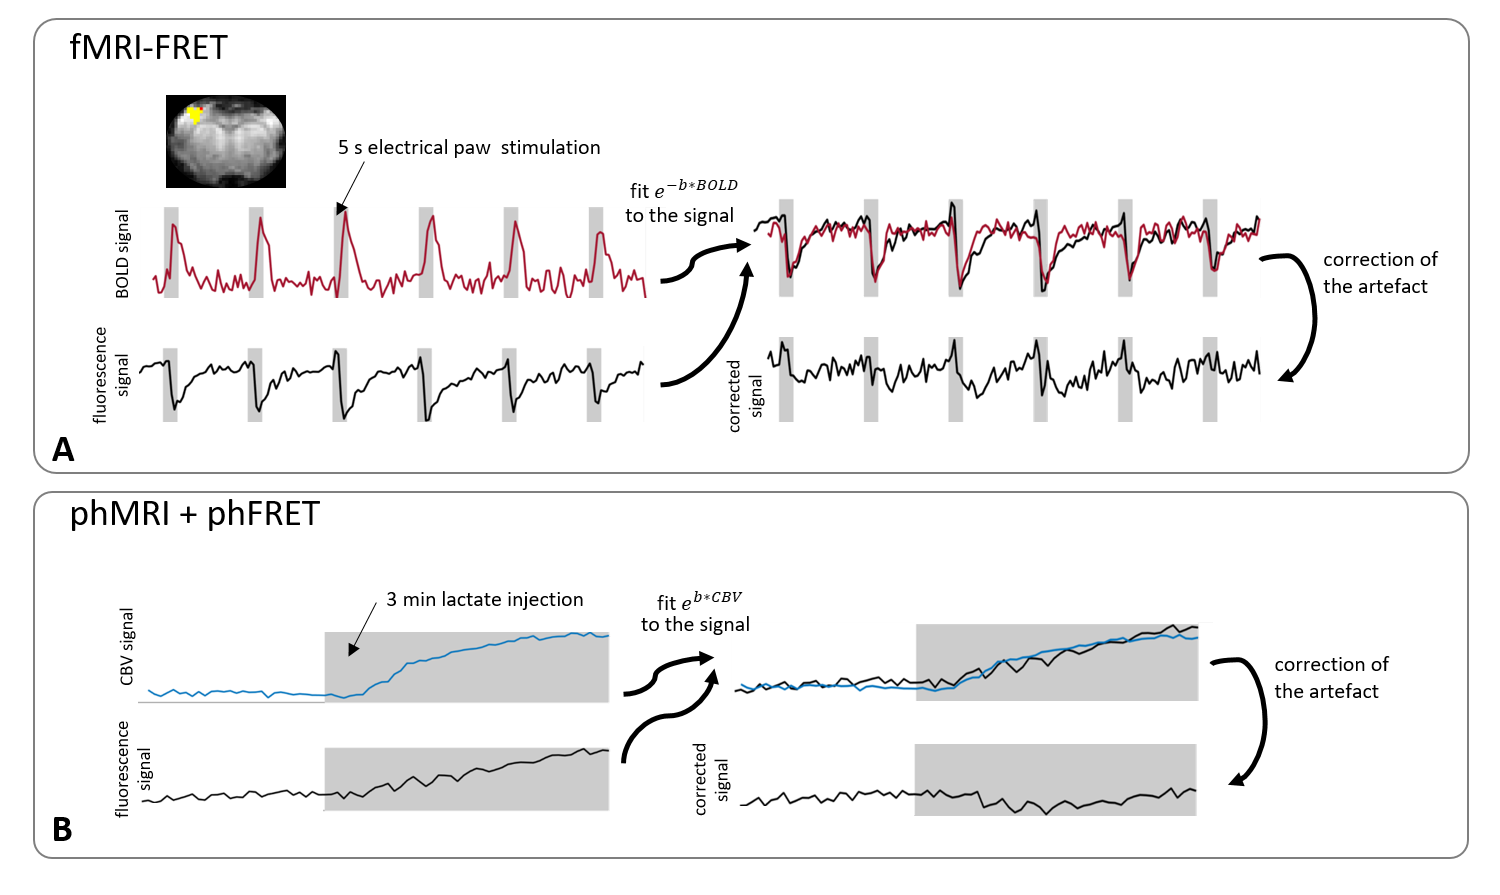
Fluorescence signals were down-sampled to the temporal resolution of MRI data and the absorption term exp(-b·M) was fitted to the fluorescence signals by adjusting the parameter b (fig. 2).For fMRI-FRET the simultaneously recorded BOLD signals were inserted as M. For phFRET the inverted time course of the averaged CBV signals was used. Fluorescence signals were divided by the resulting absorption term. FRET-ratios of uncorrected and corrected fluorescence signals were calculated (Twitch: acceptor/donor2, Laconic: donor/acceptor3).
Results
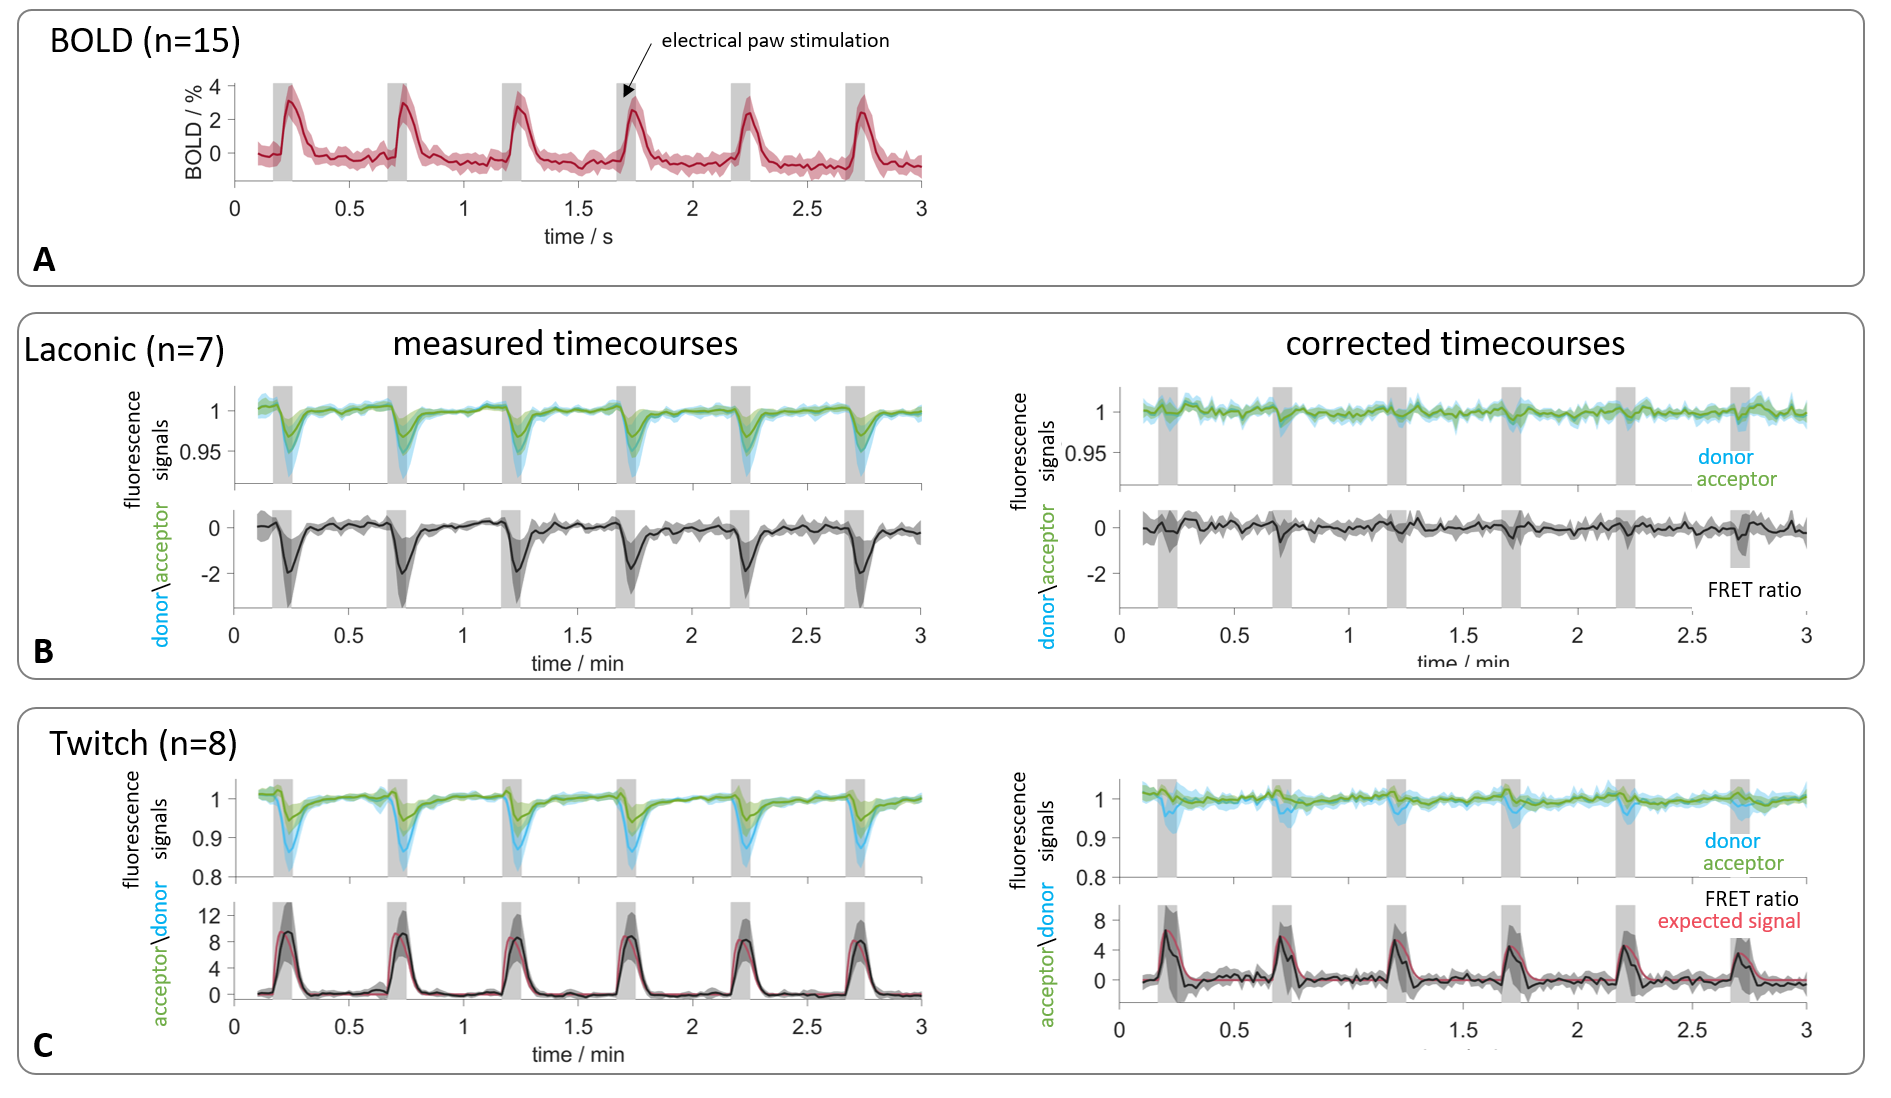
fMRI-FRET:BOLD time courses (n=15) showed the response to forepaw stimulation and a time to peak (ttp) of (4.6±1.0)s (fig. 3A). Fluorescence and FRET-ratio time courses (n=7) in Laconic-expressing animals showed a signal drop during stimulation and a ttp of (4.2±0.6)s. The signal drop was removed after applying the correction algorithm (fig. 3B). For recordings in Twitch-expressing animals, the averaged donor and acceptor signals (n=8) also dropped, obscuring the expected signal increase. The expected response of the Twitch sensor was estimated according to specifications of the sensor protein.2 Prior to correction, the FRET-ratio deviated from the expected signal curve, and a ttp of (3.9±0.8)s was observed (expected ttp: 2s). After application of the correction, FRET-ratio time courses agreed well with the expectation with a ttp of (2.4±0.8)s (fig. 3C).
phMRI + phFRET:
CBV-weighted measurements in naïve rats showed a signal increase around 6% caused by lactate injection (fig. 4A). As control experiments, phMRI-FRET recordings in Twitch-expressing animals (n=3) were performed. Fluorescence time courses showed a signal increase during lactate injection that vanished after application of the correction (fig 4B). In Laconic-expressing rats, prior to correction, both fluorescence and FRET-ratio time courses (n=6) showed an increase during injection. After correction, the acceptor signal remained stable during injection, while the donor signal increased, resulting in a net increase of the FRET-ratio (fig 4C).
Discussion
fMRI-FRET:Concordance of ttp values of the BOLD response and the FRET-ratios, obtained from uncorrected fluorescence signals, indicated a hemodynamic contribution to the response to sensory stimulation. Previously, correction for the hemodynamic artifact has been performed by calculating the ratio of the fluorescence signal to a reference measurement at different wavelength.1 Accordingly, the hemodynamic artifact should be eliminated by calculation of the FRET-ratio of uncorrected fluorescence time courses. This was not the case with our data, suggesting that the standard correction cannot fully eliminate the artifact. Our MRI-based correction method showed a better performance.
phMRI + phFRET:
CBV signal increase during lactate injection was caused by a decrease of blood volume and a dilution effect. In fluorescence recordings, these effects lead to a reduced absorption of the emitted fluorescence light. For (control) FRET recordings using the Twitch sensor, no generic signal change (change in calcium level) was expected, and consequently, donor and acceptor signals were expected to remain unchanged. Therefore, the detected signal increase was attributed to changes in light absorption. For the Laconic sensor, an increase of the FRET-ratio during lactate injection was observed as expected.5 After application of the correction algorithm, this increase was conserved, albeit slightly reduced, showing that the raw signals correspond to a superposition of FRET change and hemodynamic artifact. After correction, phFRET-ratios for Twitch and Laconic were highly consistent with expectations.
Conclusion
Both functional and pharmacological stimulations cause hemodynamic changes. Our measurements show that these changes cause artifacts in fiber-based FRET recordings. The hemodynamic artifact can be removed effectively with the MRI-based correction method presented in this study.Acknowledgements
No acknowledgement found.References
1. Ma Y, Shaik MA, Kim SH, et al. Wide-field optical mapping of neural activity and brain haemodynamics: considerations and novel approaches. Philos Trans R Soc Lond B Biol Sci. 2016 Oct 5;371(1705):20150360.
2. Thestrup T, Litzlbauer J, Bartholomäus I, et al. Optimized ratiometric calcium sensors for functional in vivo imaging of neurons and T lymphocytes. Nat Methods. 2014 Feb;11(2):175-82.
3. San Martín A, Ceballo S, Ruminot I, et al. A genetically encoded FRET lactate sensor and its use to detect the Warburg effect in single cancer cells. PLoS One. 2013;8(2):e57712
4. Lambers H, Segeroth M, Albers F, et al. A cortical rat hemodynamic response function for improved detection of BOLD activation under common experimental conditions. Neuroimage. 2020 Mar;208:116446.
5. Mächler P, Wyss MT, Elsayed M, Stobart J, et al. In Vivo Evidence for a Lactate Gradient from Astrocytes to Neurons. Cell Metab. 2016 Jan 12;23(1):94-102
Figures