1826
Impact of day-night cycle on functional brain connectome in mice1CRMBM UMR 7339, Aix Marseille Université-CNRS, Marseille, France, 2INS, UMR1106, Aix-Marseille University-INSERM-CNRS, Marseille, France
Synopsis
Controlled by the suprachiasmatic nucleus of the hypothalamus, circadian rhythm defines the day-night cycle in most animal species. We evaluated the effect of night and day cycle on the functional connectome by exploring a group of mice under light condition (LC) and another one under night condition (NC) using BOLD rs-fMRI. Our results show a significant increase in functional connectivity in NC group compared to LC group at the pineal gland level. This result is in line with this gland’s function. Furthers studies are needed to explore the effects of the circadian rhythm on both genders at different ages.
Introduction:
In humans but also in rodents, resting state functional magnetic resonance imaging (rs-fMRI) is used to investigate brain function at rest. It is known that the activity of most animal species varies on a 24-h basis controlled by the suprachiasmatic nucleus of the hypothalamus. Recent study has shown that there is a modulation of neuronal activity due to circadian rhythm 1. However, to our knowledge there is no previous work investigating the impact of circadian rhythm on functional brain connectome in mice. Here, we examined whether functional connectivity changes during the day-night cycle.Methods:
MRI acquisition: this study was approved by our institutional committee on Ethics (authorization #26779). Nine female C57Bl6/J mice (14 ± 1 months) were studied: 5 in Night Condition (NC) and 4 in Light Condition (LC). Anesthesia was induced with isoflurane (3-4%) followed by s.c. injection of Medetor (0.13mg/kg). The right flank was shaved to facilitate monitoring of the oxygen saturation during rs-fMRI with an MR compatible mouse oximeter. Animals were scanned on a Pharmascan 70/16 US 7T Brucker system using Paravison 6 software. Animals in the nocturnal phase were anesthetized and explored in total darkness. Isoflurane was maintained below 0.6% during BOLD rs-fMRI acquisitions and body temperature between 33-35°C to prevent awakening. Rs-fMRI was acquired using a gradient echo EPI sequence: TE/TR/FA=19.91ms/2500ms/45°; 40 interleaved axial slices, 0.145×0.145×0.4 mm3 spatial resolution, 110 ×110 matrix, 20 dummy scans; 512 repetitions, 22 min total scan duration.rs-fMRI preprocessing: the data were converted to nifty using MIPAV script and all the preprocessing was performed using FSL’s recommended preprocessing pipeline from FMRIB’s Software Library (FSL version 6). Preprocessing included motion correction, outliers regression using frame displacement (FD) metric 2, registration to native space, non-brain removal using Brain Extraction Tool (BET), bias field correction; slice-timing correction using Fourier-space time-series phase-shifting, grand-mean intensity normalization of the entire 4D dataset by a single multiplicative factor and high pass temporal filtering (0.01Hz). The filtered data were regressed according to the changes in intensity using the default FSL DVARS 2 metric threshold. Then, global signal regression and low pass filtering (0.1Hz) were applied and data were registered to Allen template using FLIRT followed by nonlinear (FNIRT) warping. Spatial smoothing by a Gaussian kernel and an isotropic resampling resolution of 4 mm were applied on the preprocessed data during the multi-session temporal concatenation Independent Component Analysis (ICA) analysis using Probabilistic ICA 3 as implemented in MELODIC (Multivariate Exploratory Linear Decomposition into Independent Components) Version 3.15, part of FSL. The following data pre-processing was applied to the input data and a total of 40 independent components (IC maps) were extracted based on a previous work 4. We used dual regression (DR) (v0.6) for between-subject analysis allowing voxel-wise comparisons of rs-fMRI data 5,6. Non-parametric permutation based inference analysis 7 was performed with subject-specific component spatial maps concatenated across subjects and submitted to voxel-wise between-subject analysis testing for effect of night and day cycle using FSL-randomise 8. FSL’s general linear model (GLM) was used to define design contrasts based on unpaired t-test, testing circadian condition effect among the two groups. For each analysis we ran 5000 randomized permutations as recommended, while threshold-free cluster enhancement (TFCE) 9 was used for statistical inference to validate the likelihood of extended areas of signal, which also considers information from neighboring voxels. Correction for multiple comparisons across space was applied assuming an overall significance of p < 0.05 using permutation testing and TFCE.
Results:
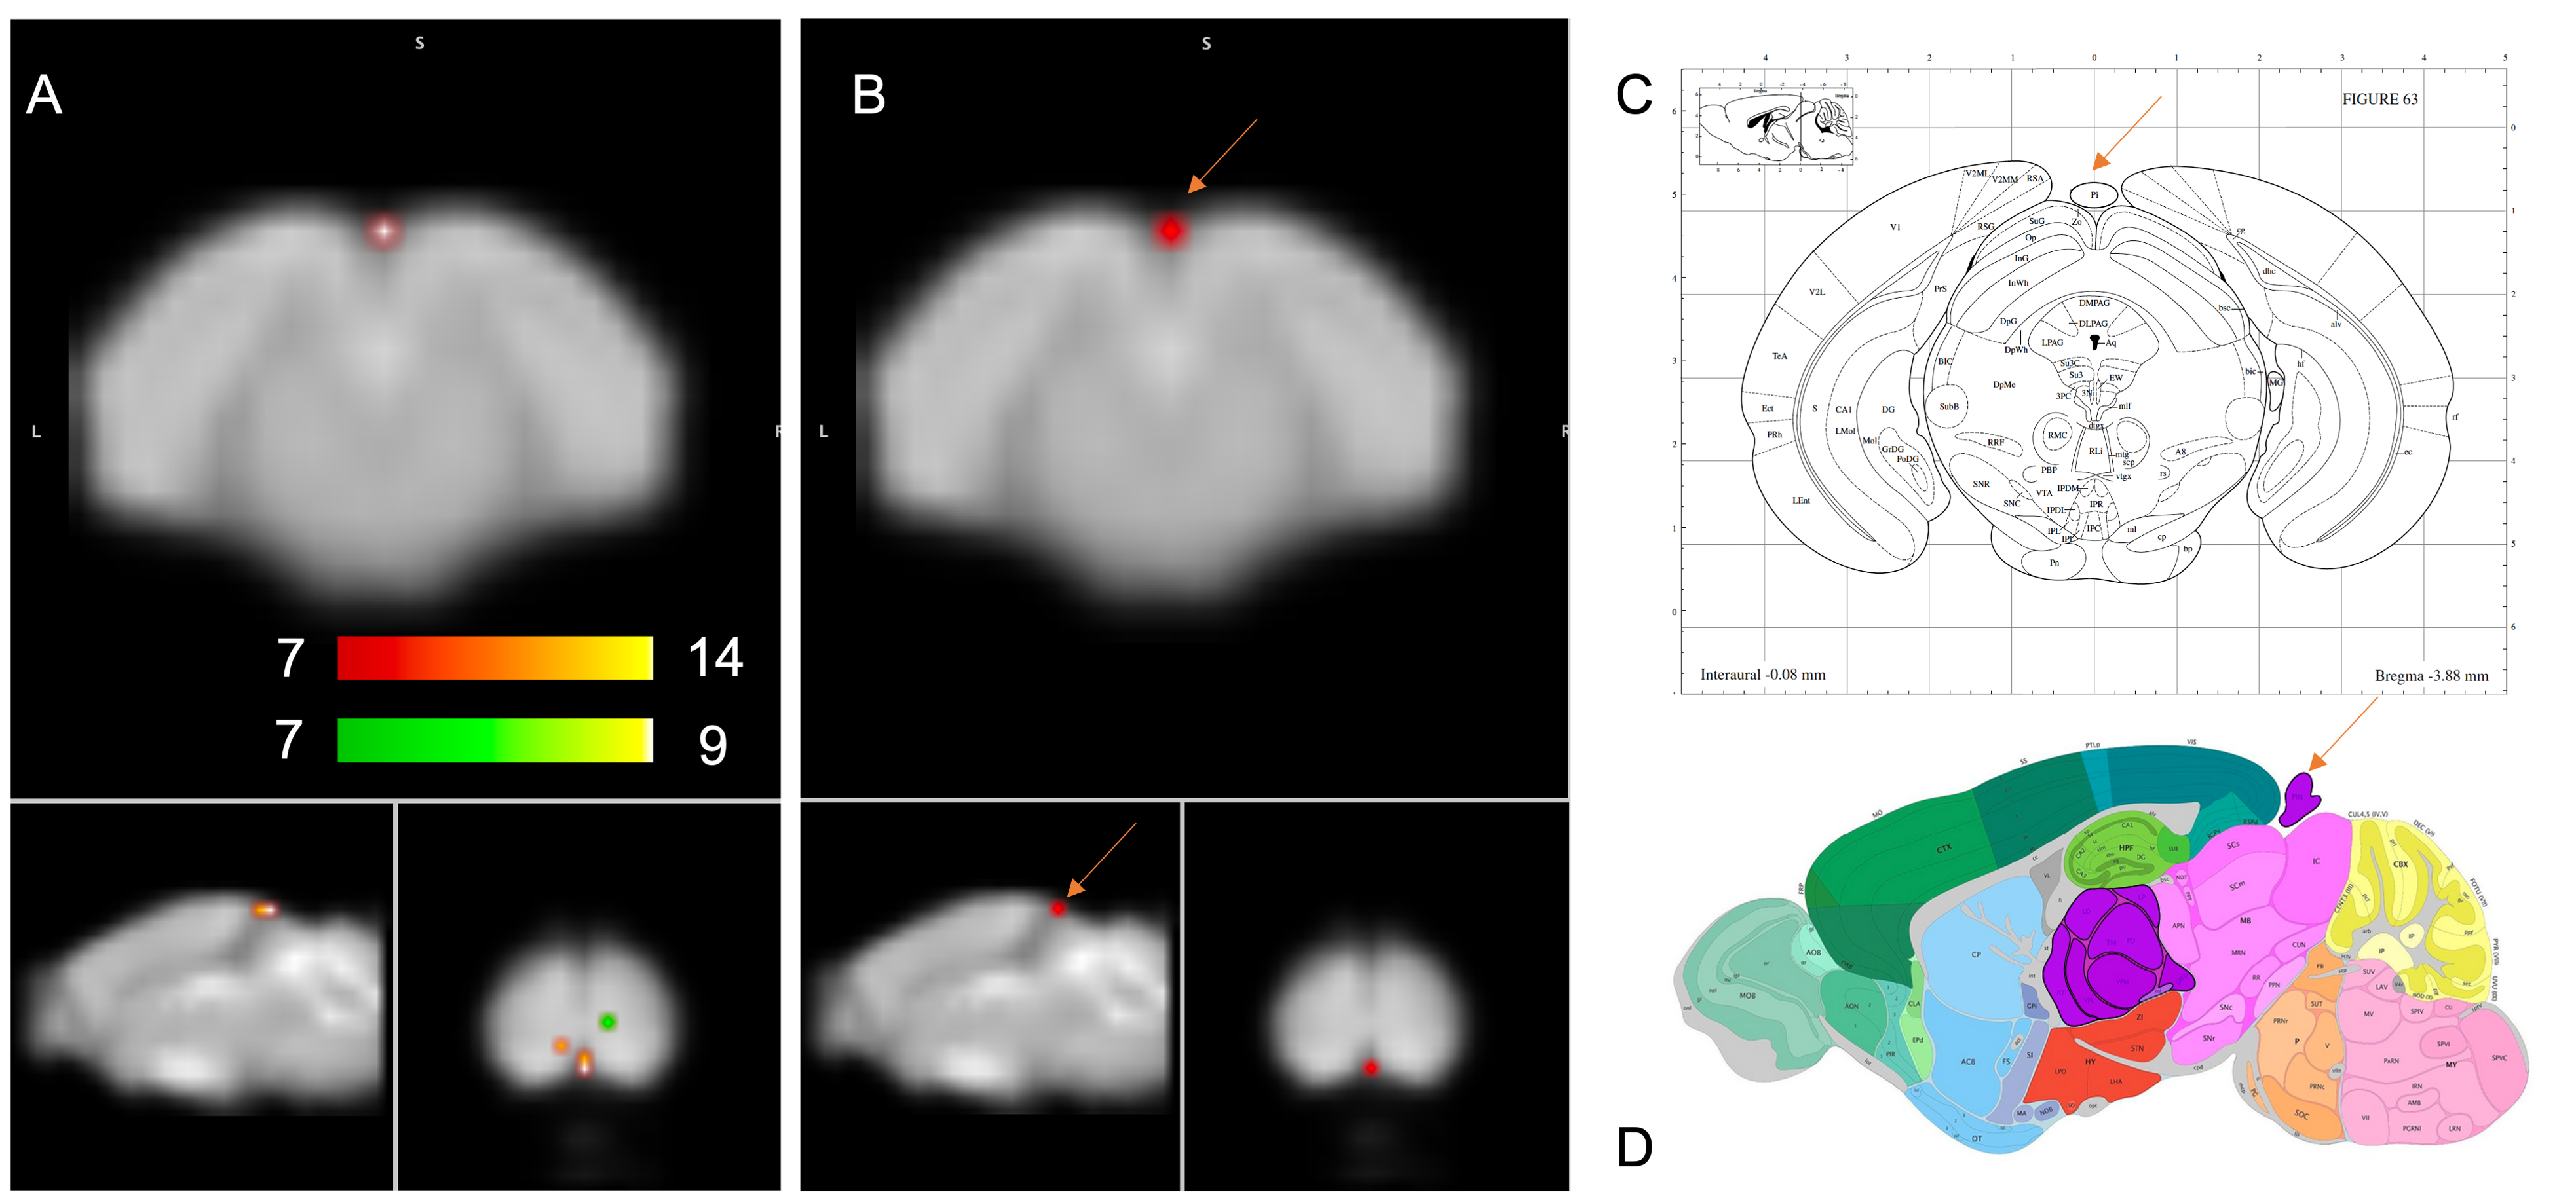
Of the 40 components derived from group-ICA, 15 were identified as plausible resting state networks according to the networks reported in the literature 4,10,11 after discarding components at the brain surface and those involving vascular structures and ventricles. Among the interesting ICA components, one appeared statistically different between the two groups. The cluster was significantly increased in the group in Night Condition (figure 1).Discussion:
Figure 1 shows the only significant difference found in NC for pineal gland which is in accordance with its role in the circadian rhythm by the nighttime secretion of melatonin 12,13. One caveat of this study is that the animals were disrupted during the diurnal phase (rest phase) because of the MRI exploration. Another limitation is the small number of exclusively female animals. The analysis of the effect of the circadian rhythm on both males and females at different ages is under way.Conclusion:
Our study showed that functional connectivity increases in the pineal gland during night condition. Our ongoing studies will include more animals and more time points for a better coverage of the day and night cycle, which could lead to the identification of other networks depending on the circadian rhythm.Acknowledgements
ANR Connectome (grant ANR-17-CE37-0001-03)
France Life Imaging (grant ANR-11-INBS-0006 from the French “Investissements d’Avenir” program)
References
1. McCauley, J. P. et al. Circadian Modulation of Neurons and Astrocytes Controls Synaptic Plasticity in Hippocampal Area CA1. Cell Rep. 33, 108255 (2020).
2. Power, J. D., Barnes, K. A., Snyder, A. Z., Schlaggar, B. L. & Petersen, S. E. Spurious but systematic correlations in functional connectivity MRI networks arise from subject motion. NeuroImage 59, 2142–2154 (2012).
3. Beckmann, C. F. & Smith, S. M. Probabilistic Independent Component Analysis for Functional Magnetic Resonance Imaging. IEEE Trans. Med. Imaging 23, 137–152 (2004).
4. Bukhari, Q., Schroeter, A., Cole, D. M. & Rudin, M. Resting State fMRI in Mice Reveals Anesthesia Specific Signatures of Brain Functional Networks and Their Interactions. Front. Neural Circuits 11, (2017).
5. Filippini, N. et al. Distinct patterns of brain activity in young carriers of the APOE -ε4 allele. Proc. Natl. Acad. Sci. 106, 7209–7214 (2009).
6. Veer, I. M. Whole brain resting-state analysis reveals decreased functional connectivity in major depression. Front. Syst. Neurosci. 4, (2010).
7. Nichols, T. E. & Holmes, A. P. Nonparametric permutation tests for functional neuroimaging: A primer with examples. Hum. Brain Mapp. 15, 1–25 (2002).
8. Winkler, A. M., Ridgway, G. R., Webster, M. A., Smith, S. M. & Nichols, T. E. Permutation inference for the general linear model. NeuroImage 92, 381–397 (2014).
9. Smith, S. & Nichols, T. Threshold-free cluster enhancement: Addressing problems of smoothing, threshold dependence and localisation in cluster inference. NeuroImage 44, 83–98 (2009).
10. Bajic, D., Craig, M. M., Mongerson, C. R. L., Borsook, D. & Becerra, L. Identifying Rodent Resting-State Brain Networks with Independent Component Analysis. Front. Neurosci. 11, 685 (2017).
11. Grandjean, J. et al. Common functional networks in the mouse brain revealed by multi-centre resting-state fMRI analysis. NeuroImage 205, 116278 (2020).
12. Macchi, M. M. & Bruce, J. N. Human pineal physiology and functional significance of melatonin. Front. Neuroendocrinol. 25, 177–195 (2004).
13. Sapède, D. & Cau, E. The Pineal Gland from Development to Function. in Current Topics in Developmental Biology vol. 106 171–215 (Elsevier, 2013).
Figures