1825
Humanized mouse brain biomarkers through transcriptomic conversion
Roël Matthijs Vrooman1, Judith Homberg1, and Joanes Grandjean1
1DCMN, Donders Institute for Brain, Cognition and Behaviour, RadboudUMC, Nijmegen, Netherlands
1DCMN, Donders Institute for Brain, Cognition and Behaviour, RadboudUMC, Nijmegen, Netherlands
Synopsis
Since the translation of data between species remains subjective, our goal is to develop a data-driven tool to perform this translation based on the expression patterns of homologous genes. For this, human and mouse fMRI data, which was manually matched based on spatial homology between co-activation patterns, was modelled as a linear addition of gene expression maps. Weighting factors were then used to estimate synthetic brain states based on homologous genes. When comparing the synthetic brain states to their matched biological state, they showed higher correlation than compared to mismatched states, showing the effectiveness of the translational tool.
Introduction
The interpretation of whole-brain neuroimaging observations in animal models relies on assumptions of spatial homologies between species. These assumptions have been built upon comparative neuroanatomy, including neuronal composition and axonal projections. To date, these assumptions remain approximate, which in turn impairs our ability to transfer observations between species. Since gene expression patterns of homolog genes are expected to show some spatial correlation1, this could be used to more objectively translate data between species. The goal of this study is to develop a data-driven approach relying on transcriptomic similarity to seamlessly convert whole-brain biomarkers between the mouse and the human.Methods
The fMRI and transcriptomic data were taken from freely available online repositories.2,3,4,5 A list of mouse and human homolog genes was obtained using Ensemble Biomart and cross-referenced to the transcriptomic data.6 Six brain states were derived for both the human and mouse fMRI data using co-activation patterns (CAPs), which were manually matched based on spatial homology. Expression data was preprocessed and the mouse data was put into a linear model. Weighting factors from this linear model were then used to estimate a ‘synthetic’ version of the human brain states based on homologous genes. Figure 1 shows how the linear models were created as a linear addition of the expression maps for each gene and compared between homologous genes. The human synthetic brain states were cross-correlated with their ‘biological’ versions to see whether they showed an increased correlation between the matched brain states as compared to the mismatched brain states. All code is freely available online.7Results/Discussion
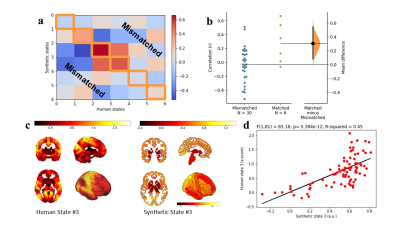
Conversion of the mouse brain states, using the transcriptomic homology model, resulted in six synthetic humanized brain states. To compare these synthetic brain states to both the matched biological states and mismatched states, the mean time series for 81 regions were taken from all maps and cross-correlated. These 81 regions were based on the brain parcellations used for the human transcriptomic data.8 Figure 2 shows that synthetic brain states matched to their biological version, indeed show higher correlation compared to mismatched states (difference: 0.305108, 95%CI: 0.082905 – 0.545104, p = 0.012). Furthermore, when comparing the 81 regions from state 3 to its synthetic version, the correlation is highly significant (synthetic 3 ~ state 3: F(1,81) = 65.18, p = 5.384x10⁻¹²).Conclusion
Here we demonstrate the possibility to translate between mouse and human data using a data-driven conversion model purely based on homologous gene expression. Although the model shown is currently only validated on fMRI data of co-activation patterns, it should generalize to any type of brain dataset. This model can provide a new way for researchers to translate their mouse brain data to humans, increasing their relevance.Acknowledgements
RMV is supported by the Dutch Research Council grant OCENW.KLEIN.334 awarded to JGReferences
- Strand, A. D., Aragaki, A. K., Baquet, Z. C., Hodges, A., Cunningham, P., Holmans, P., ... & Olson, J. M. (2007). Conservation of regional gene expression in mouse and human brain. PLoS genetics, 3(4), e59.
- Allen Institute for Brain Science. (2004) ‘Allen Mouse Brain Atlas’, Available from: https://mouse.brain-map.org/
- Allen Institute for Brain Science. (2010) ‘Allen Human Brain Atlas’, Available from: http://human.brain-map.org/
- Van Essen, D. C., Smith, S. M., Barch, D. M., Behrens, T. E., Yacoub, E., Ugurbil, K., & Wu-Minn HCP Consortium. (2013). The WU-Minn human connectome project: an overview. Neuroimage, 80, 62-79.
- Grandjean, J., Azzinnari, D., Seuwen, A., Sigrist, H., Seifritz, E., Pryce, C. R., & Rudin, M. (2016). Chronic psychosocial stress in mice leads to changes in brain functional connectivity and metabolite levels comparable to human depression. Neuroimage, 142, 544-552.
- Kinsella, R. J., Kähäri, A., Haider, S., Zamora, J., Proctor, G., Spudich, G., ... & Flicek, P. (2011). Ensembl BioMarts: a hub for data retrieval across taxonomic space. Database, 2011.
- https://gitlab.socsci.ru.nl/preclinical-neuroimaging/homologous-brain-expression-map
- Desikan, R. S. et al. (2006) ‘An automated labeling system for subdividing the human cerebral cortex on MRI scans into gyral based regions of interest’, NeuroImage, 31(3), pp. 968–980.
Figures

Figure 1: A 3D mouse brain map (Mouse.mapxyz), e.g. derived
from functional MRI group comparison, can be explained as the linear addition
of the weighted expression maps (βi * Genei, xyz). The
weighting factors (βi) estimated in the previous step, are then transferred to homologous
genes expressed in the human brain. The resulting Human.map is a humanized
synthetic version of the mouse brain map in standard human coordinates
(MNI152). Gene expression information is obtained from the ABA.2,3

Figure 2: a/b. Synthetic
brain states matched to their biological version show a higher correlation than
mismatched brain states (difference: 0.305108, 95%CI: 0.082905
– 0.545104). c. Human state 3
next to its matched humanized synthetic version derived from a mouse brain map.
d. Correlation between state 3 and
its synthetic version (synthetic 3 ~ state 3: F(1,81) = 65.18,
p = 5.384x10⁻¹²).
DOI: https://doi.org/10.58530/2022/1825