1824
Identifying modulation of brain states by optogenetic stimulation of lateral hypothalamus1High-field Magnetic Resonance, Max Planck Institute for Biological Cybernetics, Tübingen, Germany, 2Institute of Neuroscience and Medicine (INM-4), Forschungszentrum Jülich, Jülich, Germany, 3Martinos Center for Biomedical Imaging, Massachusetts General Hospital and Harvard Medical School, Charlestown, MA, United States
Synopsis
The lateral hypothalamus (LH) plays an important role in regulating the brain state changes during sleep and arousal state fluctuation. Although the anatomical projections of LH have been well-investigated, the brain-wide functional map by LH stimulation under different brain states has not been characterized. Here, we applied fMRI to characterize the whole brain activation maps under different brain states during anesthesia in response to LH optogenetic stimulation. We demonstrate that the underlying brain state determines distinct functional mapping features upon LH activation.
Introduction
The lateral hypothalamus (LH) is one of the primary regions to modulate the brain state, as well as pupil dynamics due to its unique structure containing diverse arousal-modulating neural cell types1. Although the role of arousal-modulating neurons in the LH has been widely studied2-4, brain state-dependent changes of the whole brain functional map upon LH activation has seldom been investigated. The study of this whole brain functional map is particularly important because arousal modulation is often mediated by interactions of different neural cells at the whole brain level, particularly, through subcortical structures known to regulate the brain state5,6. In order to investigate the whole brain functional map of LH activation under different brain states, we performed optogenetic stimulation of the LH and evaluated the brain state changes under anesthesia through electrophysiology with real-time pupillometry and Ca2+ fiber photometry with simultaneous fMRI. LH activation led to varied neuronal responses depending on the underlying brain state and presented distinct whole brain functional maps at different anesthetized states.Methods
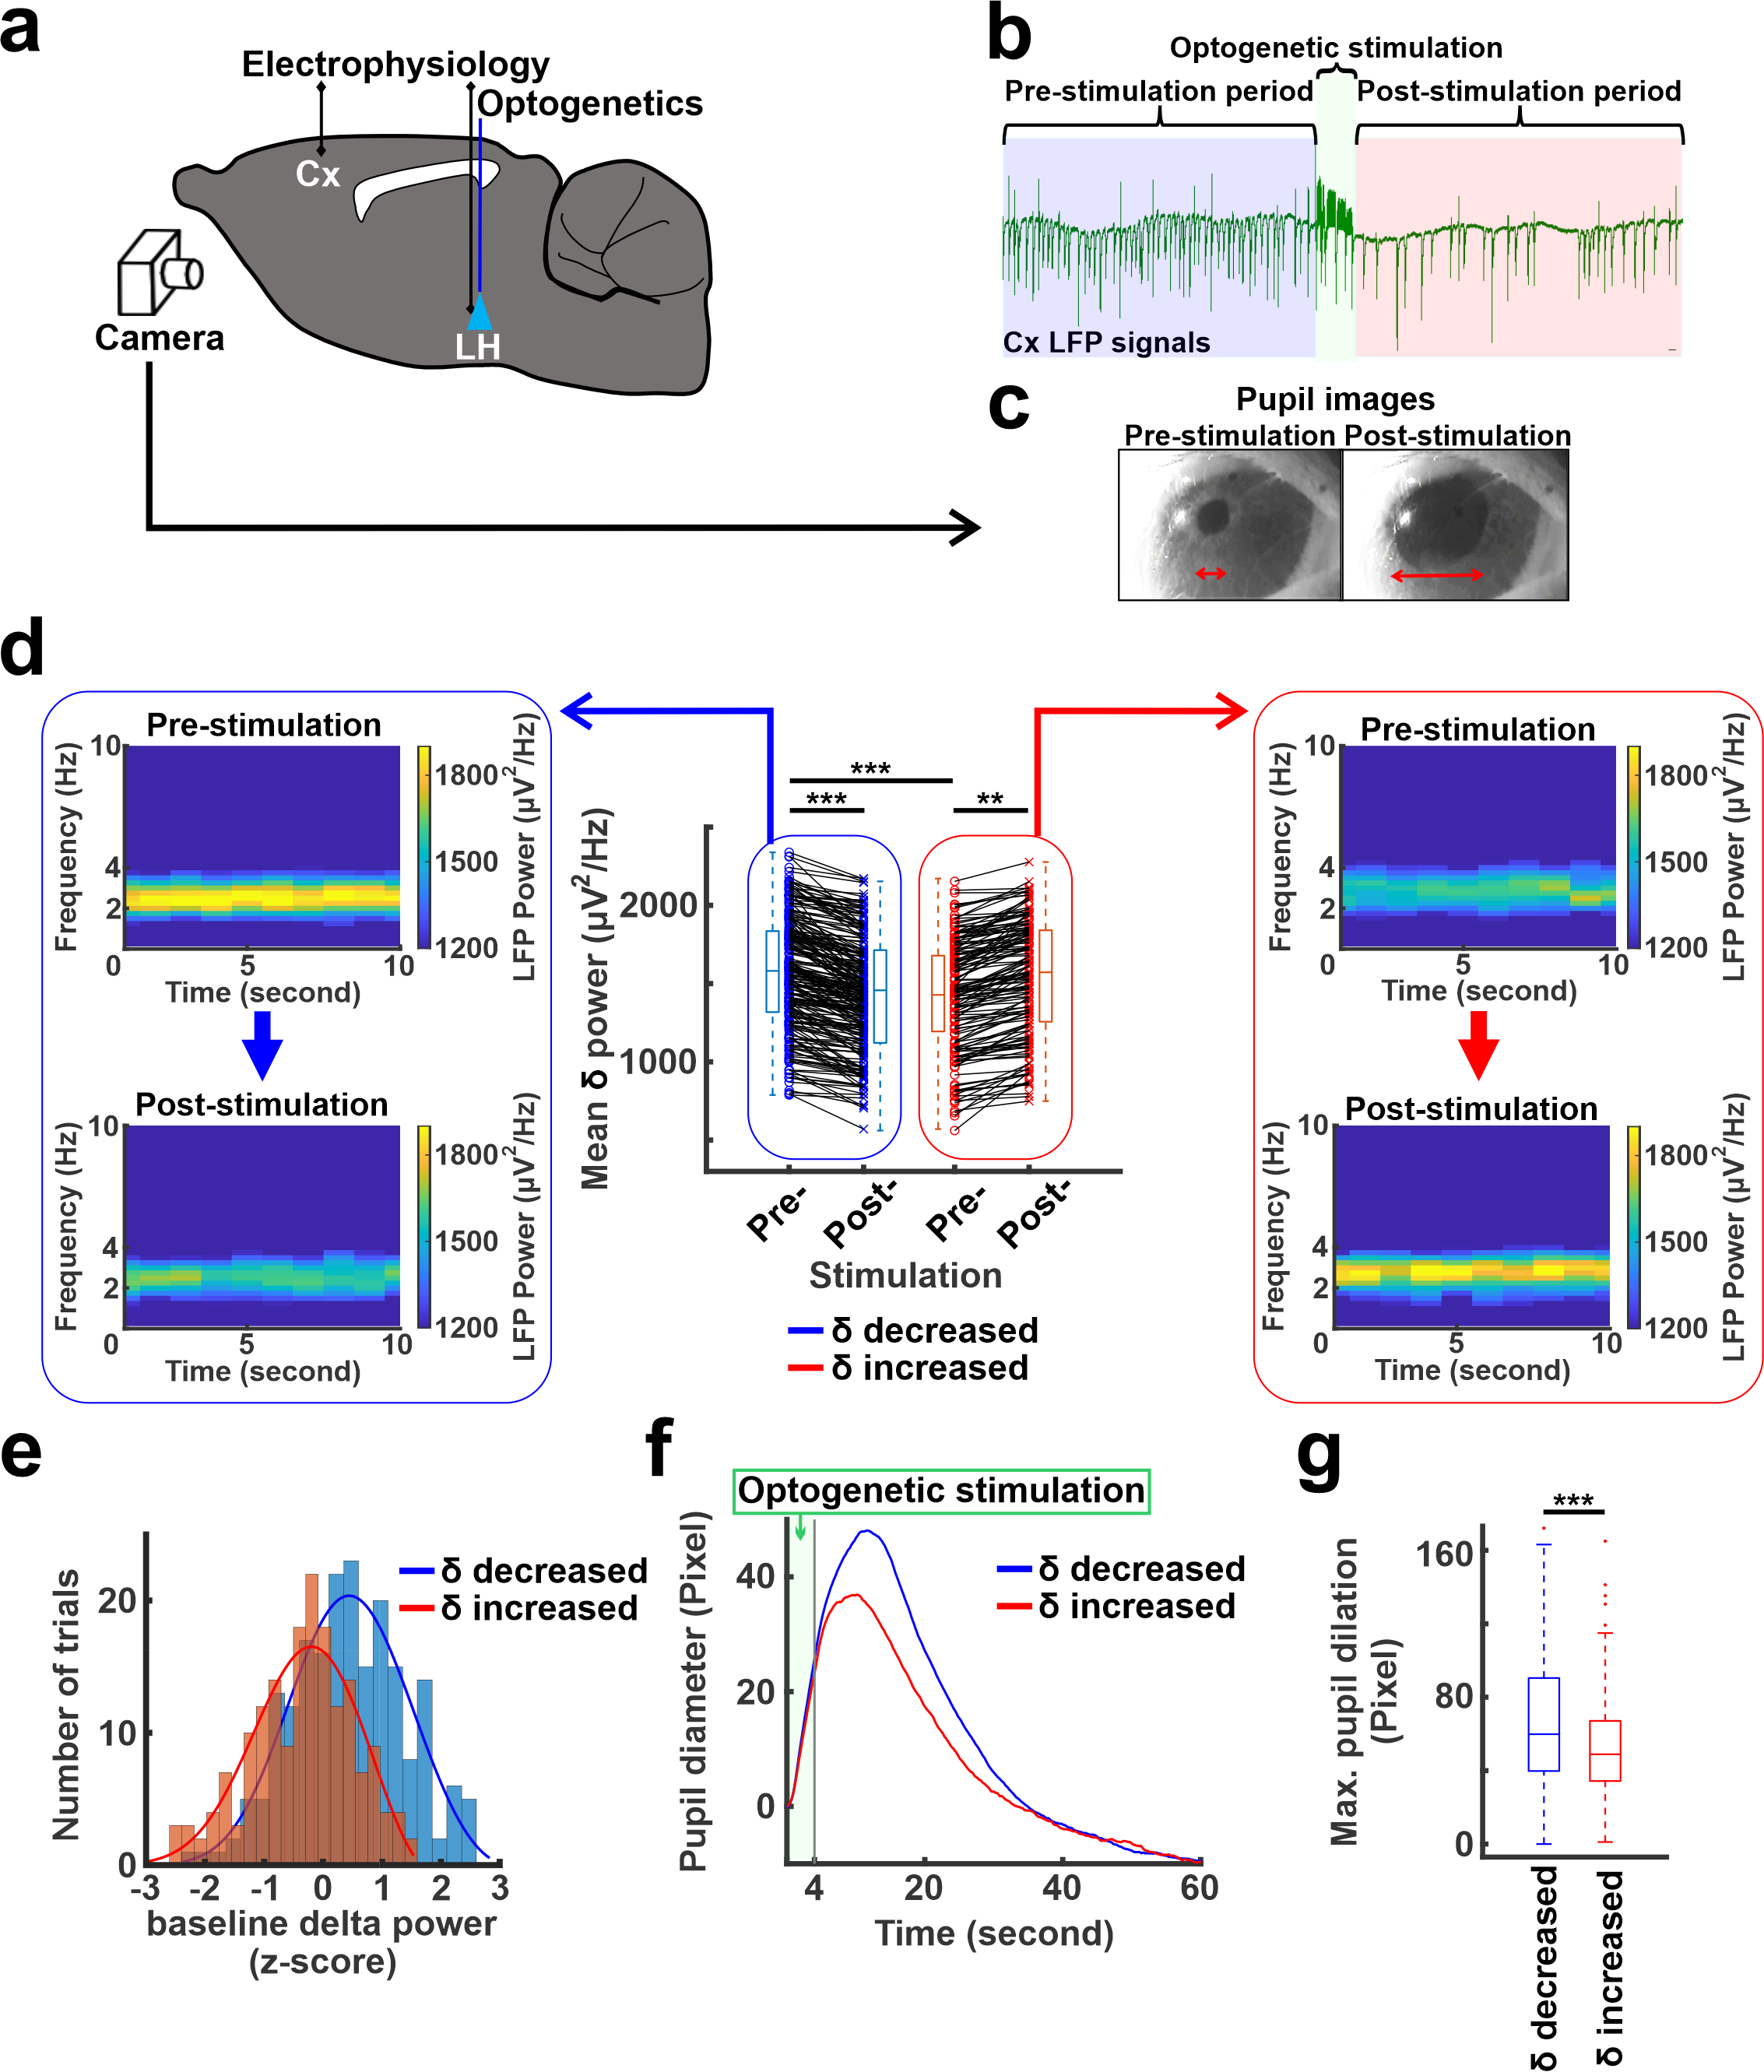
Optogenetic stimulation with LFP recording and pupil diameter measurementOptogenetic stimulations at 5Hz were performed at the LH where CaMKII-ChR2 were expressed by viral vectors from five rats anesthetized with alpha-chloralose (n= 380 trials). Simultaneously, electrophysiology signals at the anterior cingulate cortex were recorded together with real-time pupillometry (Fig 1a).
Optogenetic stimulation with fMRI and fiber photometry Ca2+ recordings
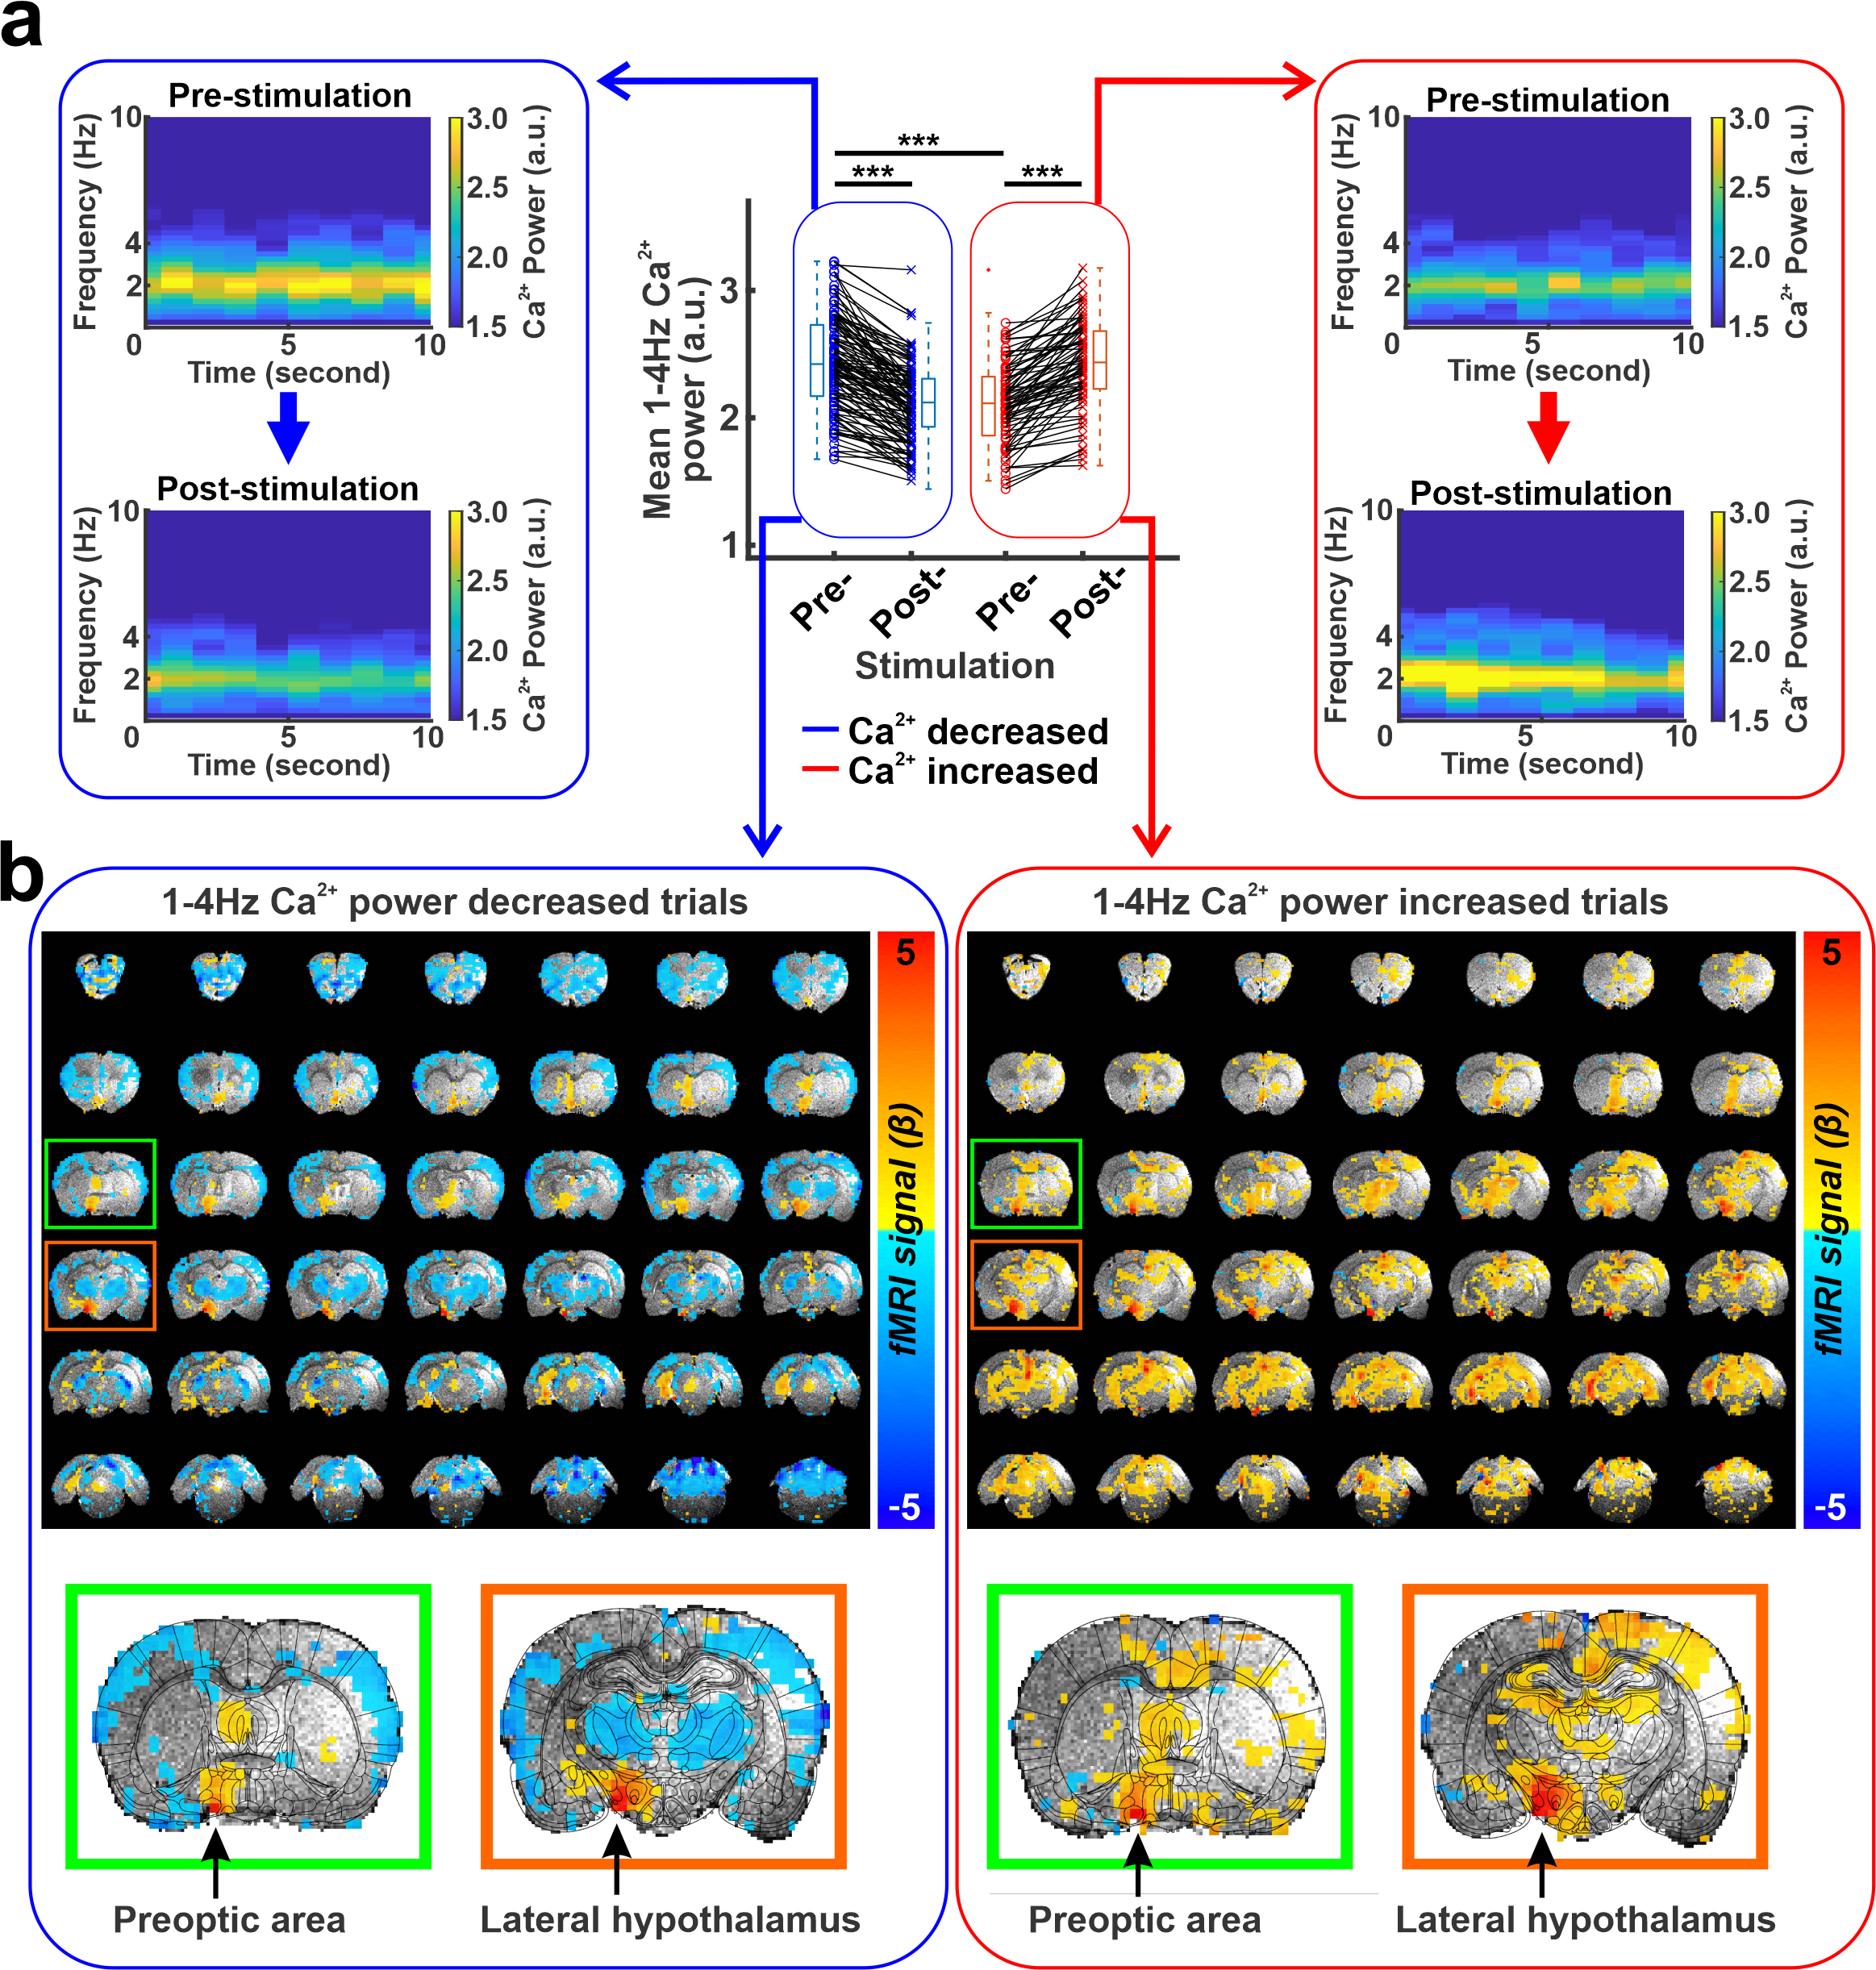
Similar optogenetic stimulation was performed with simultaneous whole-brain fMRI (14.1 T/26 cm magnet, Magnex) and optical fiber-mediated Ca2+ recording from the barrel cortex based on the GCaMP expression from an anesthetized rat with alpha-chloralose (n=192 trials), as previously described7.
Results
Optogenetic stimulation at the LH caused cortical LFP changes in the anterior cingulate cortex and pupil dilation (Fig. 1b, c). Interestingly, optogenetic stimulation decreased LFP delta (1-4Hz) power in 60% (n=228) of trials but increased the power in 40% (n=152) of trials (Fig. 1d). Interestingly, two-sample t-test demonstrated that the baseline mean delta power of pre-stimulation period (10s) in the trials where the delta power reduced after stimulation was significantly higher than the mean delta power of other trials where delta power increased (Fig. 1d,e). As higher magnitude of delta power under anesthetized states indicates a lower arousal state8-10, this result suggests that LH neurons respond differently depending on the underlying brain states. In addition, the pupil dilation also showed a larger size in the trials where the delta power reduced (Fig. 1f, g). Similarly, optogenetic stimulation also decreased the power of cortical 1-4Hz Ca2+ signal in 60% (n=116) of trials but increased the power in 40% (n=76) of trials, where the Ca2+ was recorded in the barrel cortex (Fig 2a). In the trials where 1-4Hz Ca2+ power decreased, the baseline power from the pre-stimulation period was significantly higher than in other trials when the power increased, showing similar observation to the LFP recording (Fig. 1d). Fiber photometry Ca2+ recording is an MRI-compatible method to measure neural signals11,12. In the trials with increased 1-4Hz Ca2+ power following LH stimulation, positive BOLD signals were observed in both LH and projected subcortical nuclei, e.g. the preoptic area3,13. In contrast, in the trails with decreased 1-4Hz Ca2+ power following LH stimulation, a brain-wide negative BOLD signal was observed in the cortical, thalamic, and cerebellar regions besides activation of the LH and its projected regions (Fig. 2b). These results indicate that the LH neuronal activation can lead to distinct brain-wide functional maps depending on the underlying brain state.Discussion and Conclusion
Using multi-modal fMRI method and electrophysiology with pupillometry, we revealed that LH activation alters neuronal responses depending on the underlying brain state, which is similar to previous electrophysiological studies2,4. In particular, when optogenetic LH stimulation caused reduction of the power in neural signals, global BOLD-fMRI signals showed negative responses. In contrast, when increased power of cortical responses were detected, global fMRI signals showed positive responses. These results demonstrate a unique feature of the LH to induce brain state-dependent functional activation and provide an essential knowledge about the subcortical circuit regulation of arousal changes.Acknowledgements
This work was supported by Max Planck Society, German Research Foundation (DFG), and the Graduate Training Center of Neuroscience (International Max Planck Research School).References
1. Saper, C. B., Scammell, T. E. & Lu, J. Hypothalamic regulation of sleep and circadian rhythms. Nature 437, 1257-1263, doi:10.1038/nature04284 (2005).
2. Adamantidis, A. R., Zhang, F., Aravanis, A. M., Deisseroth, K. & de Lecea, L. Neural substrates of awakening probed with optogenetic control of hypocretin neurons. Nature 450, 420-424, doi:10.1038/nature06310 (2007).
3. Venner, A., Anaclet, C., Broadhurst, R. Y., Saper, C. B. & Fuller, P. M. A Novel Population of Wake-Promoting GABAergic Neurons in the Ventral Lateral Hypothalamus. Curr Biol 26, 2137-2143, doi:10.1016/j.cub.2016.05.078 (2016).
4. Herrera, C. G. et al. Hypothalamic feedforward inhibition of thalamocortical network controls arousal and consciousness. Nat Neurosci 19, 290-298, doi:10.1038/nn.4209 (2016).
5. Scammell, T. E., Arrigoni, E. & Lipton, J. O. Neural Circuitry of Wakefulness and Sleep. Neuron 93, 747-765, doi:10.1016/j.neuron.2017.01.014 (2017).
6. Reimann, H. M. & Niendorf, T. The (Un)Conscious Mouse as a Model for Human Brain Functions: Key Principles of Anesthesia and Their Impact on Translational Neuroimaging. 14, doi:10.3389/fnsys.2020.00008 (2020).
7. Chen, Y., Pais-Roldan, P., Chen, X., Frosz, M. H. & Yu, X. MRI-guided robotic arm drives optogenetic fMRI with concurrent Ca(2+) recording. Nat Commun 10, 2536, doi:10.1038/s41467-019-10450-3 (2019).
8. Brown, E. N., Lydic, R. & Schiff, N. D. General anesthesia, sleep, and coma. N Engl J Med 363, 2638-2650, doi:10.1056/NEJMra0808281 (2010).
9. Murphy, M. et al. Propofol anesthesia and sleep: a high-density EEG study. Sleep 34, 283-291A, doi:10.1093/sleep/34.3.283 (2011).
10. Frohlich, J., Toker, D. & Monti, M. M. Consciousness among delta waves: a paradox? Brain 144, 2257-2277, doi:10.1093/brain/awab095 %J Brain (2021).
11. Pais-Roldan, P. et al. Indexing brain state-dependent pupil dynamics with simultaneous fMRI and optical fiber calcium recording. P Natl Acad Sci USA 117, 6875-6882, doi:10.1073/pnas.1909937117 (2020).
12. Wang, M. S., He, Y., Sejnowski, T. J. & Yu, X. Brain-state dependent astrocytic Ca2+ signals are coupled to both positive and negative BOLD-fMRI signals. P Natl Acad Sci USA 115, E1647-E1656, doi:10.1073/pnas.1711692115 (2018).
13. Mavanji, V. et al. Promotion of Wakefulness and Energy Expenditure by Orexin-A in the Ventrolateral Preoptic Area. Sleep 38, 1361-1370, doi:10.5665/sleep.4970 (2015).
Figures