1823
Remapping of functional connectivity with optogenetic locus coeruleus activation in rats1Biomedical Engineering, Georgia Tech and Emory University, Atlanta, GA, United States, 2Human Genetics, Emory University, Atlanta, GA, United States
Synopsis
High tonic (3-5 Hz) locus coeruleus (LC) activity drives anxiety-like behaviors and the stress response via its dense afferents and receptor distribution profile. Previous studies have utilized DREADD stimulation to understand the global effects of elevating LC activity, but lacked temporal and patterned control of stimulation. Here, we combined optogenetic stimulation of the LC (5 Hz) with functional magnetic resonance imaging to better understand global changes in functional connectivity as a result of high tonic LC activity. We found that LC stimulation at 5 Hz resulted in a shift toward increased connectivity in ChR2 injected animals compared to mCherry controls.
The locus coeruleus (LC) is a small brainstem region responsible for synthesis and release of a majority of norepinephrine in the brain1. Normal LC firing is categorized by 0.5-2 Hz pacemaker activity, which facilitates general arousal, while brief bursts of 10-20 Hz activity promote goal-directed behavior and attention to salient stimuli. Elevated LC pacemaker activity (3-5 Hz) induced by stress or artificial stimulation is aversive and can induce anxiety-like behavior. The differing effects of LC activity are thought to be mediated by these firing patterns and by varied adrenergic receptor distribution of innervated brain regions. However, with its dense afferent profile, it is still unclear how the LC influences whole brain dynamics. Two studies have shed some light onto this area, by stimulating the LC with Designer Receptors Exclusively Activated by Designer Drugs (DREADDs) during functional magnetic resonance imaging (fMRI) scans2,3. Both studies demonstrated the ability of LC stimulation (approximately 2-3 Hz4) to rapidly alter brain states and the strength of connectivity between brain regions. However, DREADDs cannot recapitulate the distinct patterns of LC firing and lack the temporal resolution of methods like optogenetics, leaving questions about whether different modes of LC activity engage unique brain states. We used a combination of optogenetic LC stimulation and fMRI to understand the effects of elevated tonic LC firing on brain-wide connectivity.
Methods
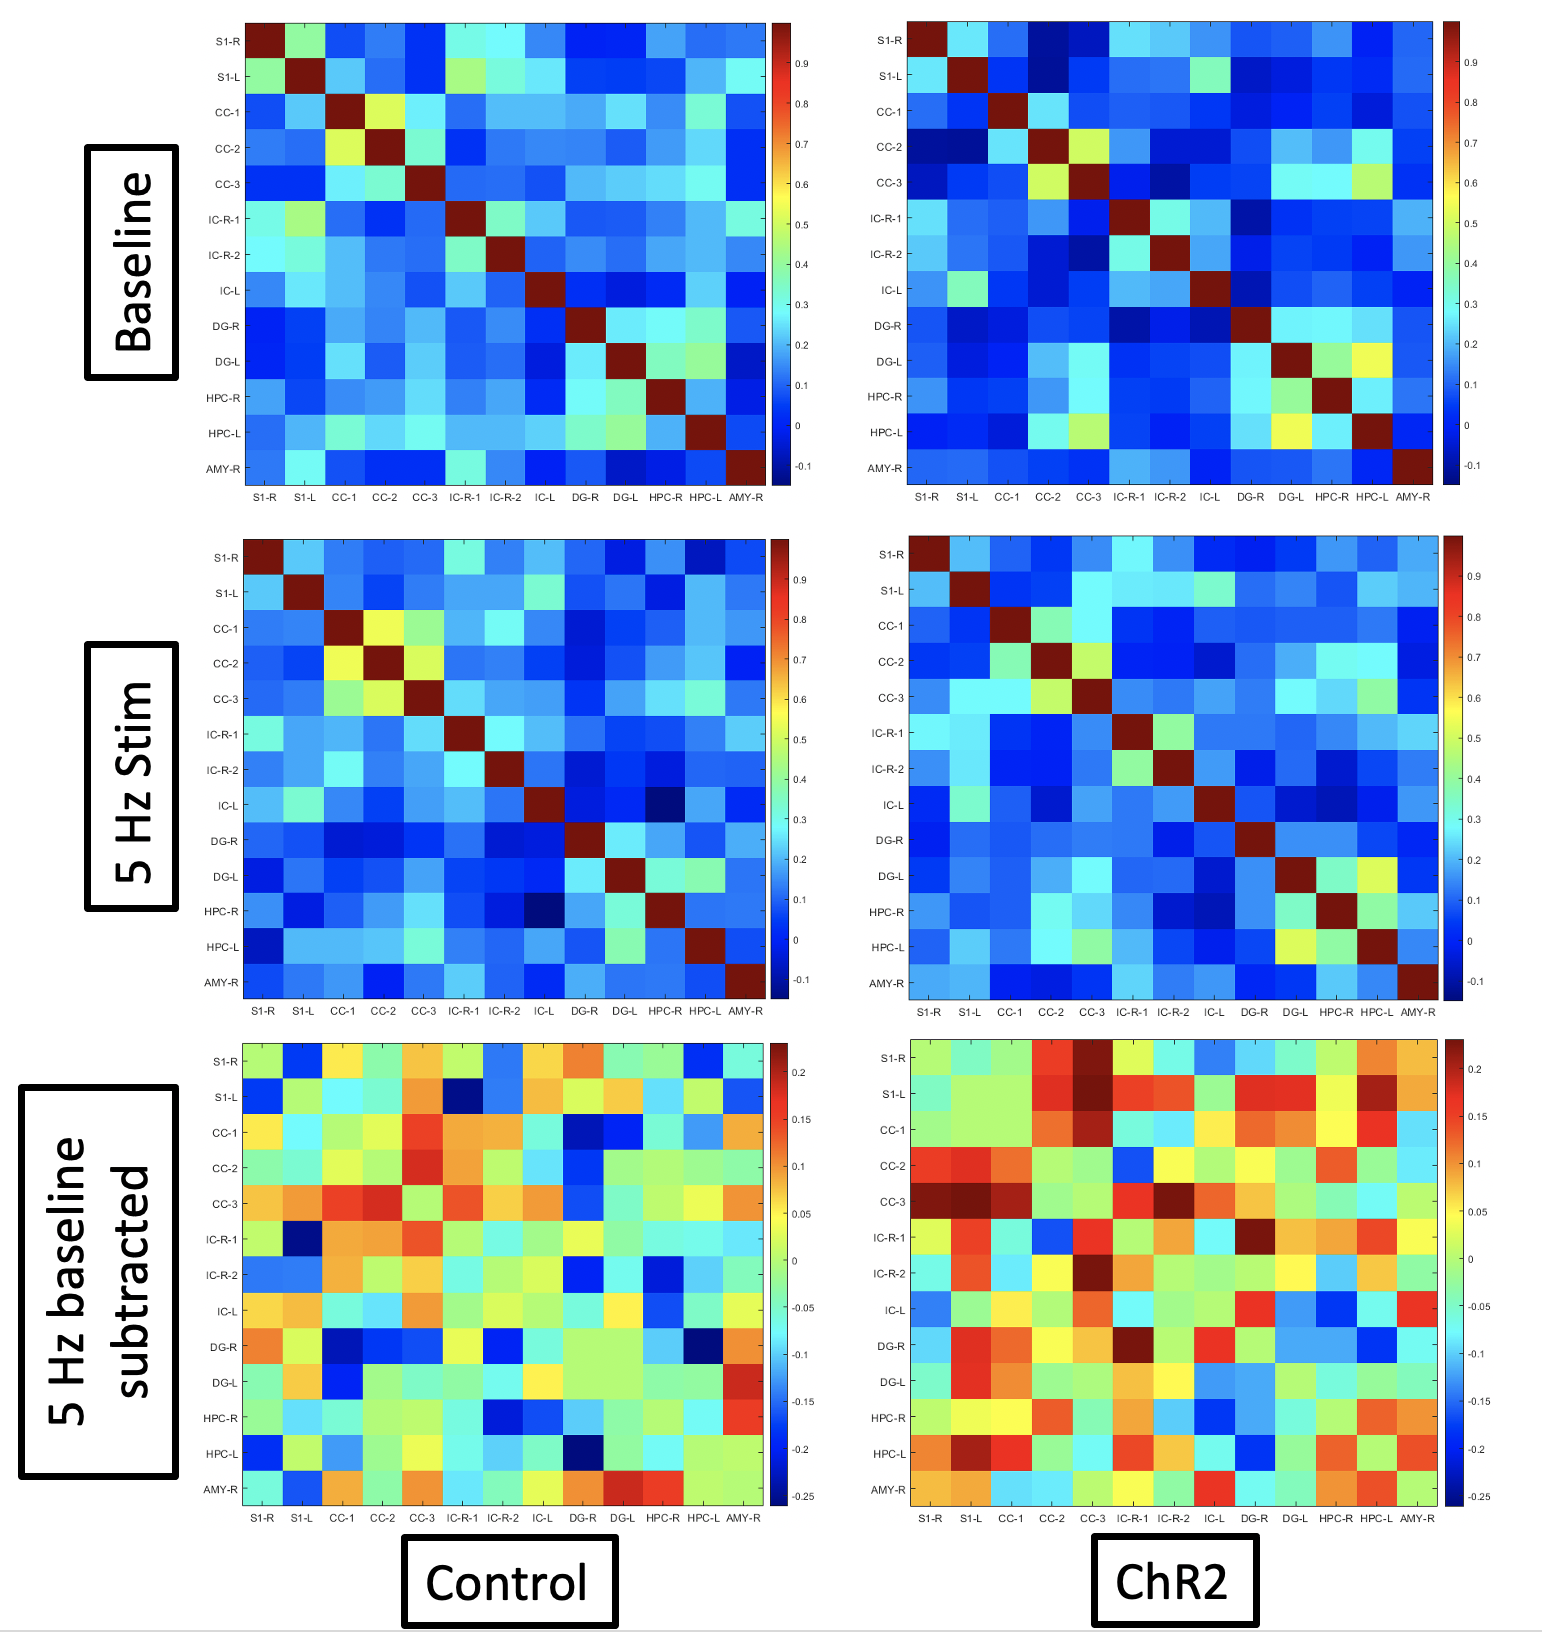
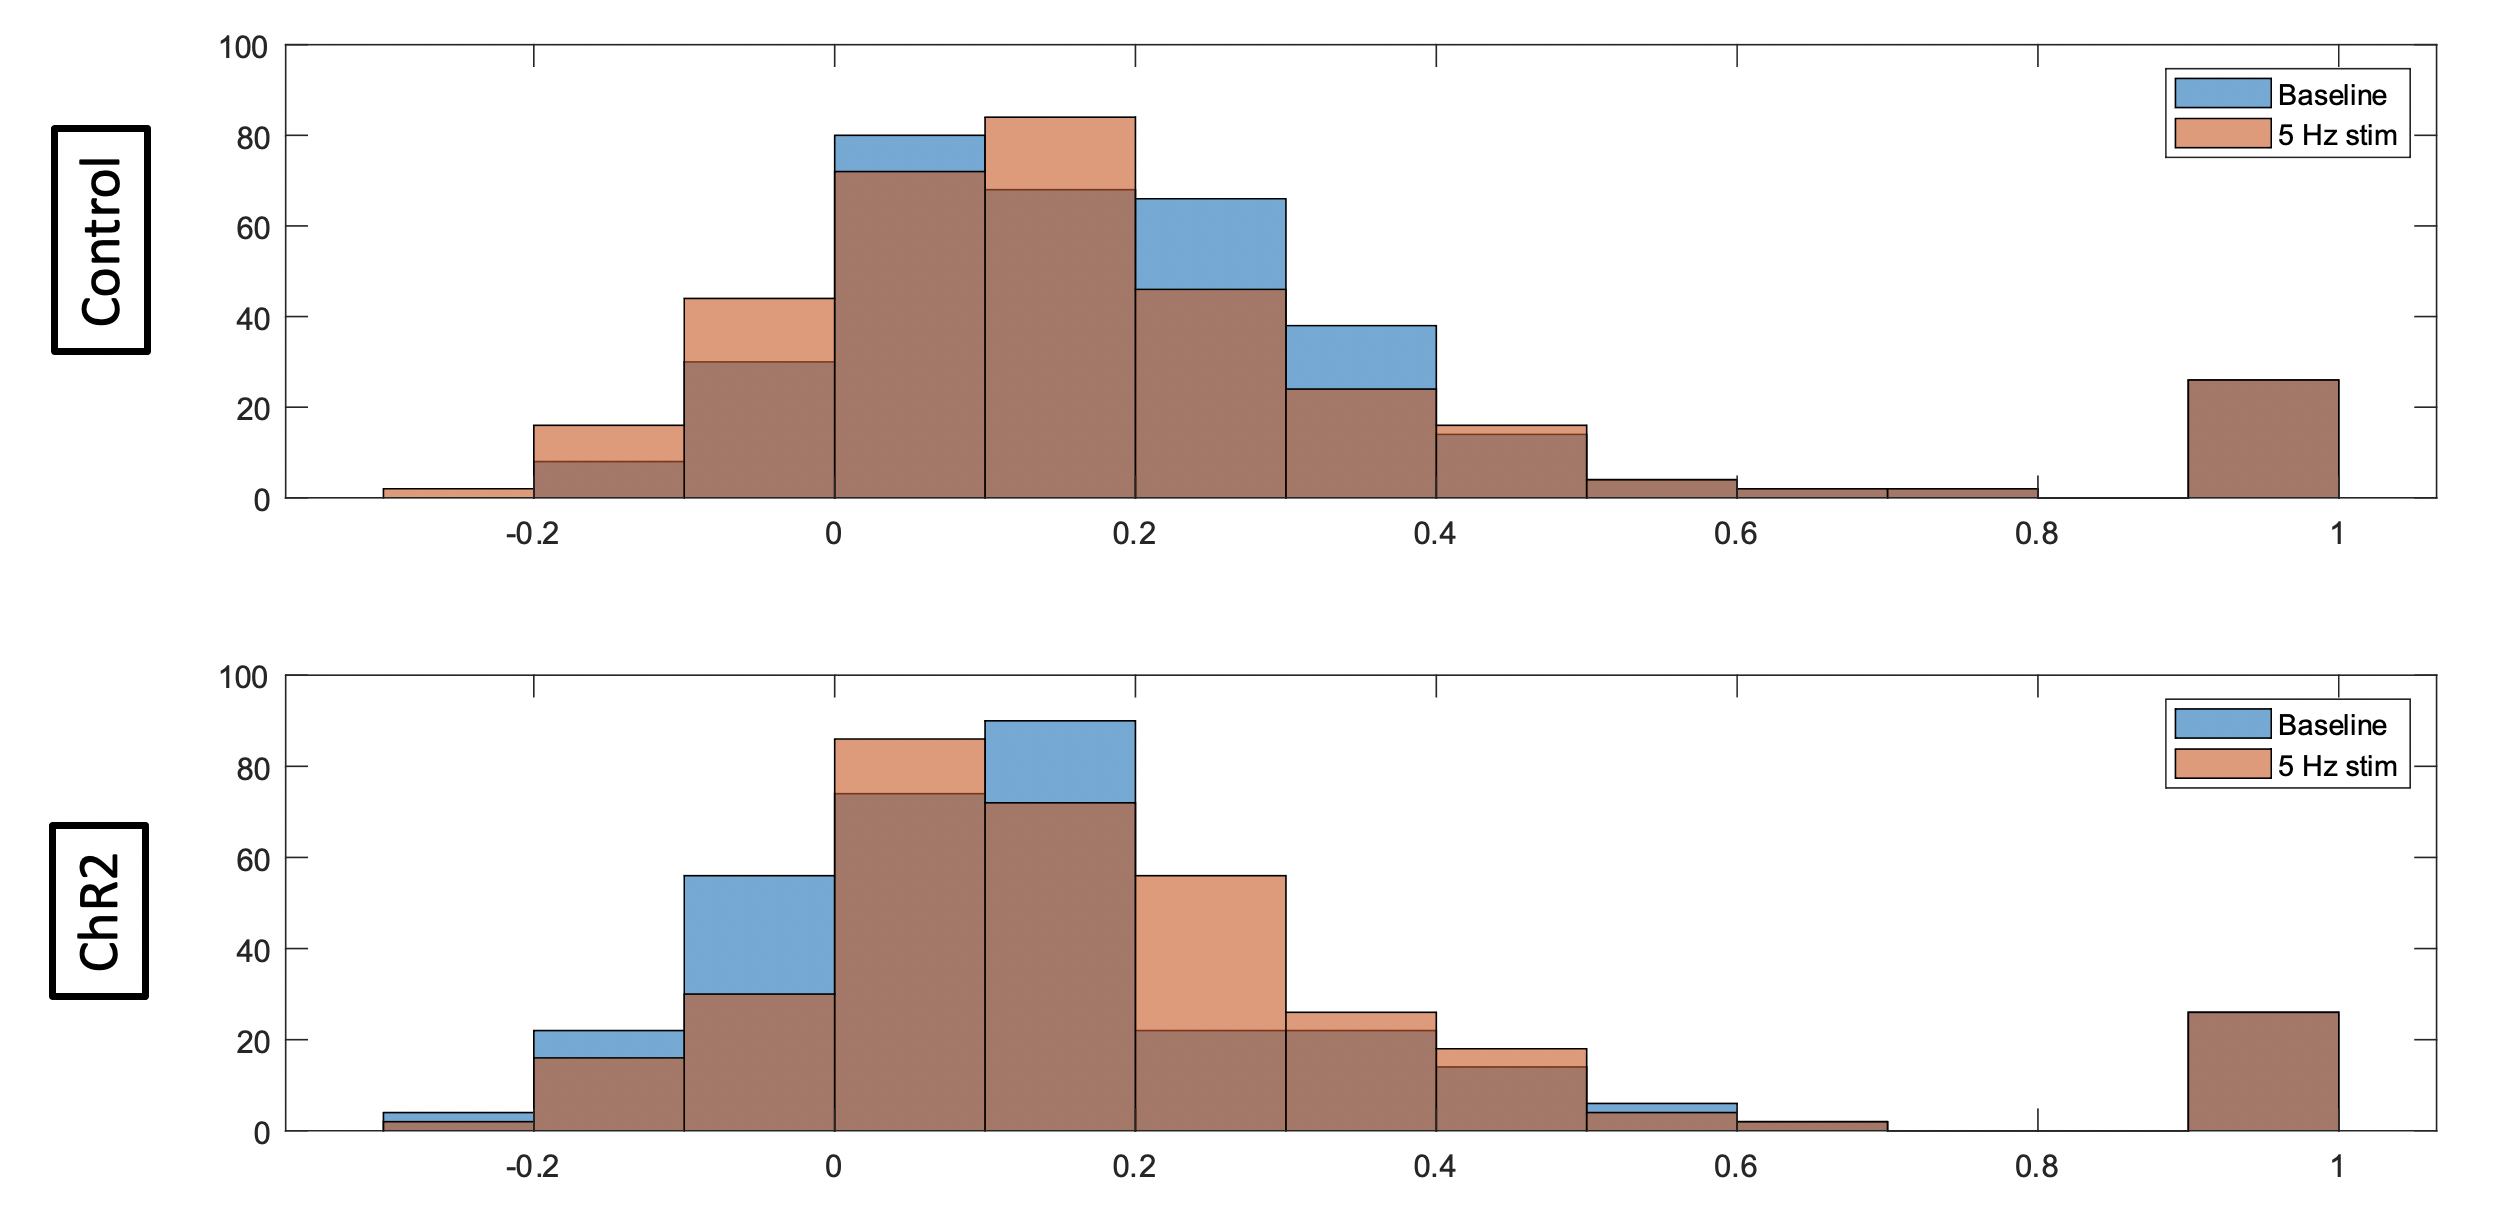
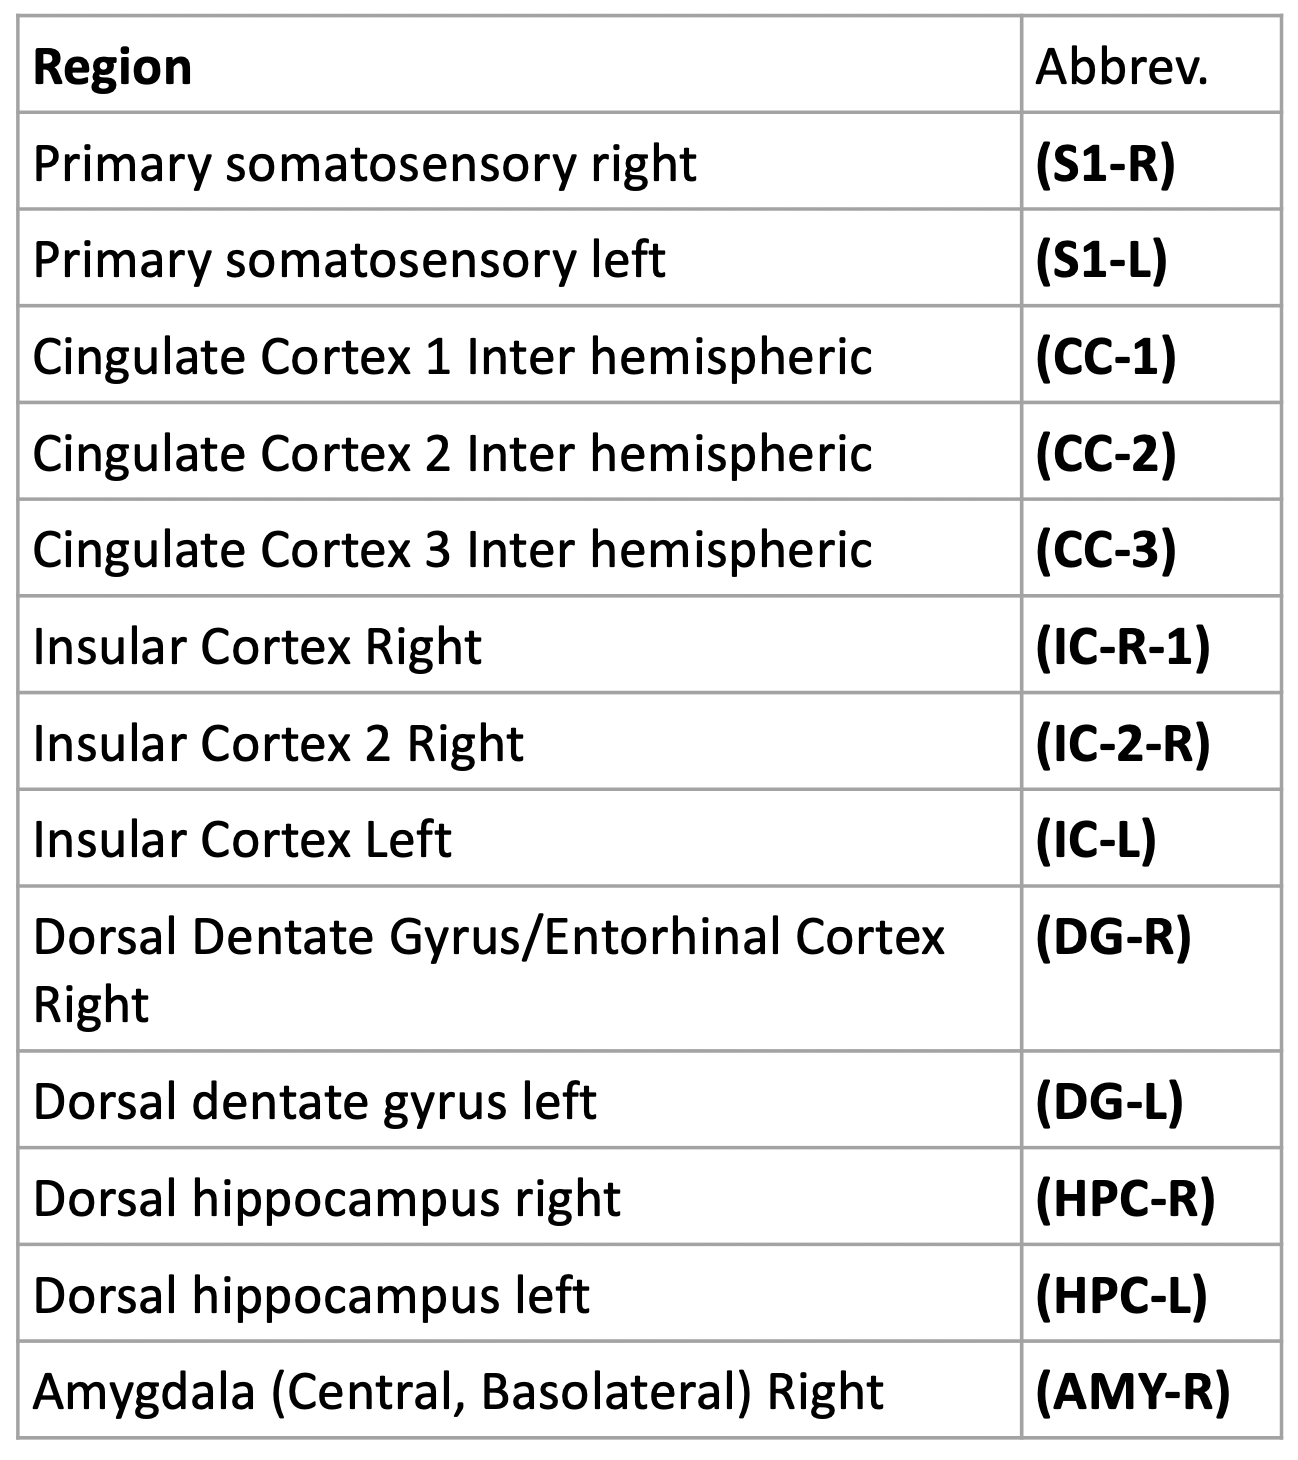
This study included the use of four Fischer 344 rats (3 male, 1 female) that were bred in-house. At approximately 2 months of age, rats were injected intra-LC with either a channelrhodopsin-2 (ChR2) or mCherry control virus under the expression of the noradrenergic specific PRsX8 promoter. At approximately 5.5 months of age, rats were implanted with optic ferrules above the LC, and correct targeting was confirmed in real-time using pupillometry5. Two weeks later, rats were intubated and maintained under 1.3% isoflurane anesthesia during resting state-fMRI scans using a 9.4T Bruker MRI scanner. A baseline scan without stimulation was followed by a scan with optogenetic stimulation of the LC at 5 Hz. All scans were 10-min gradient echo EPI with partial Fourier encoding with a factor of 1.4 and acquired with the following parameters: voxel size = 500 um, matrix size = 70 x 70, slice number = 24, TE = 15 ms, TR = 1.25 ms, and phase-locked to every other breath of a 1.6 Hz respiratory rate. Scans were preprocessed using the Rodent Whole-Brain fMRI Data Preprocessing Toolbox6. Functional connectivity matrices were calculated using Pearson’s linear correlations and parcellations from the SIGMA-Wistar functional rat atlas7. Correlations, via MATLAB, were collected for each rat at baseline and under 5 Hz stimulation. The correlations between structures were then averaged for the two rats in both the control group and the ChR2 group (Figure 2). The averaged correlations calculated at baseline were then subtracted from those calculated at 5 Hz for each group and an additional matrix was then produced displaying the resulting differences (Figure 2). A histogram for each group was produced using the correlation coefficients of both rats in each group, for both baseline scans (blue) and 5 Hz stimulation scans (orange) (Figure 3).
Results and Discussion
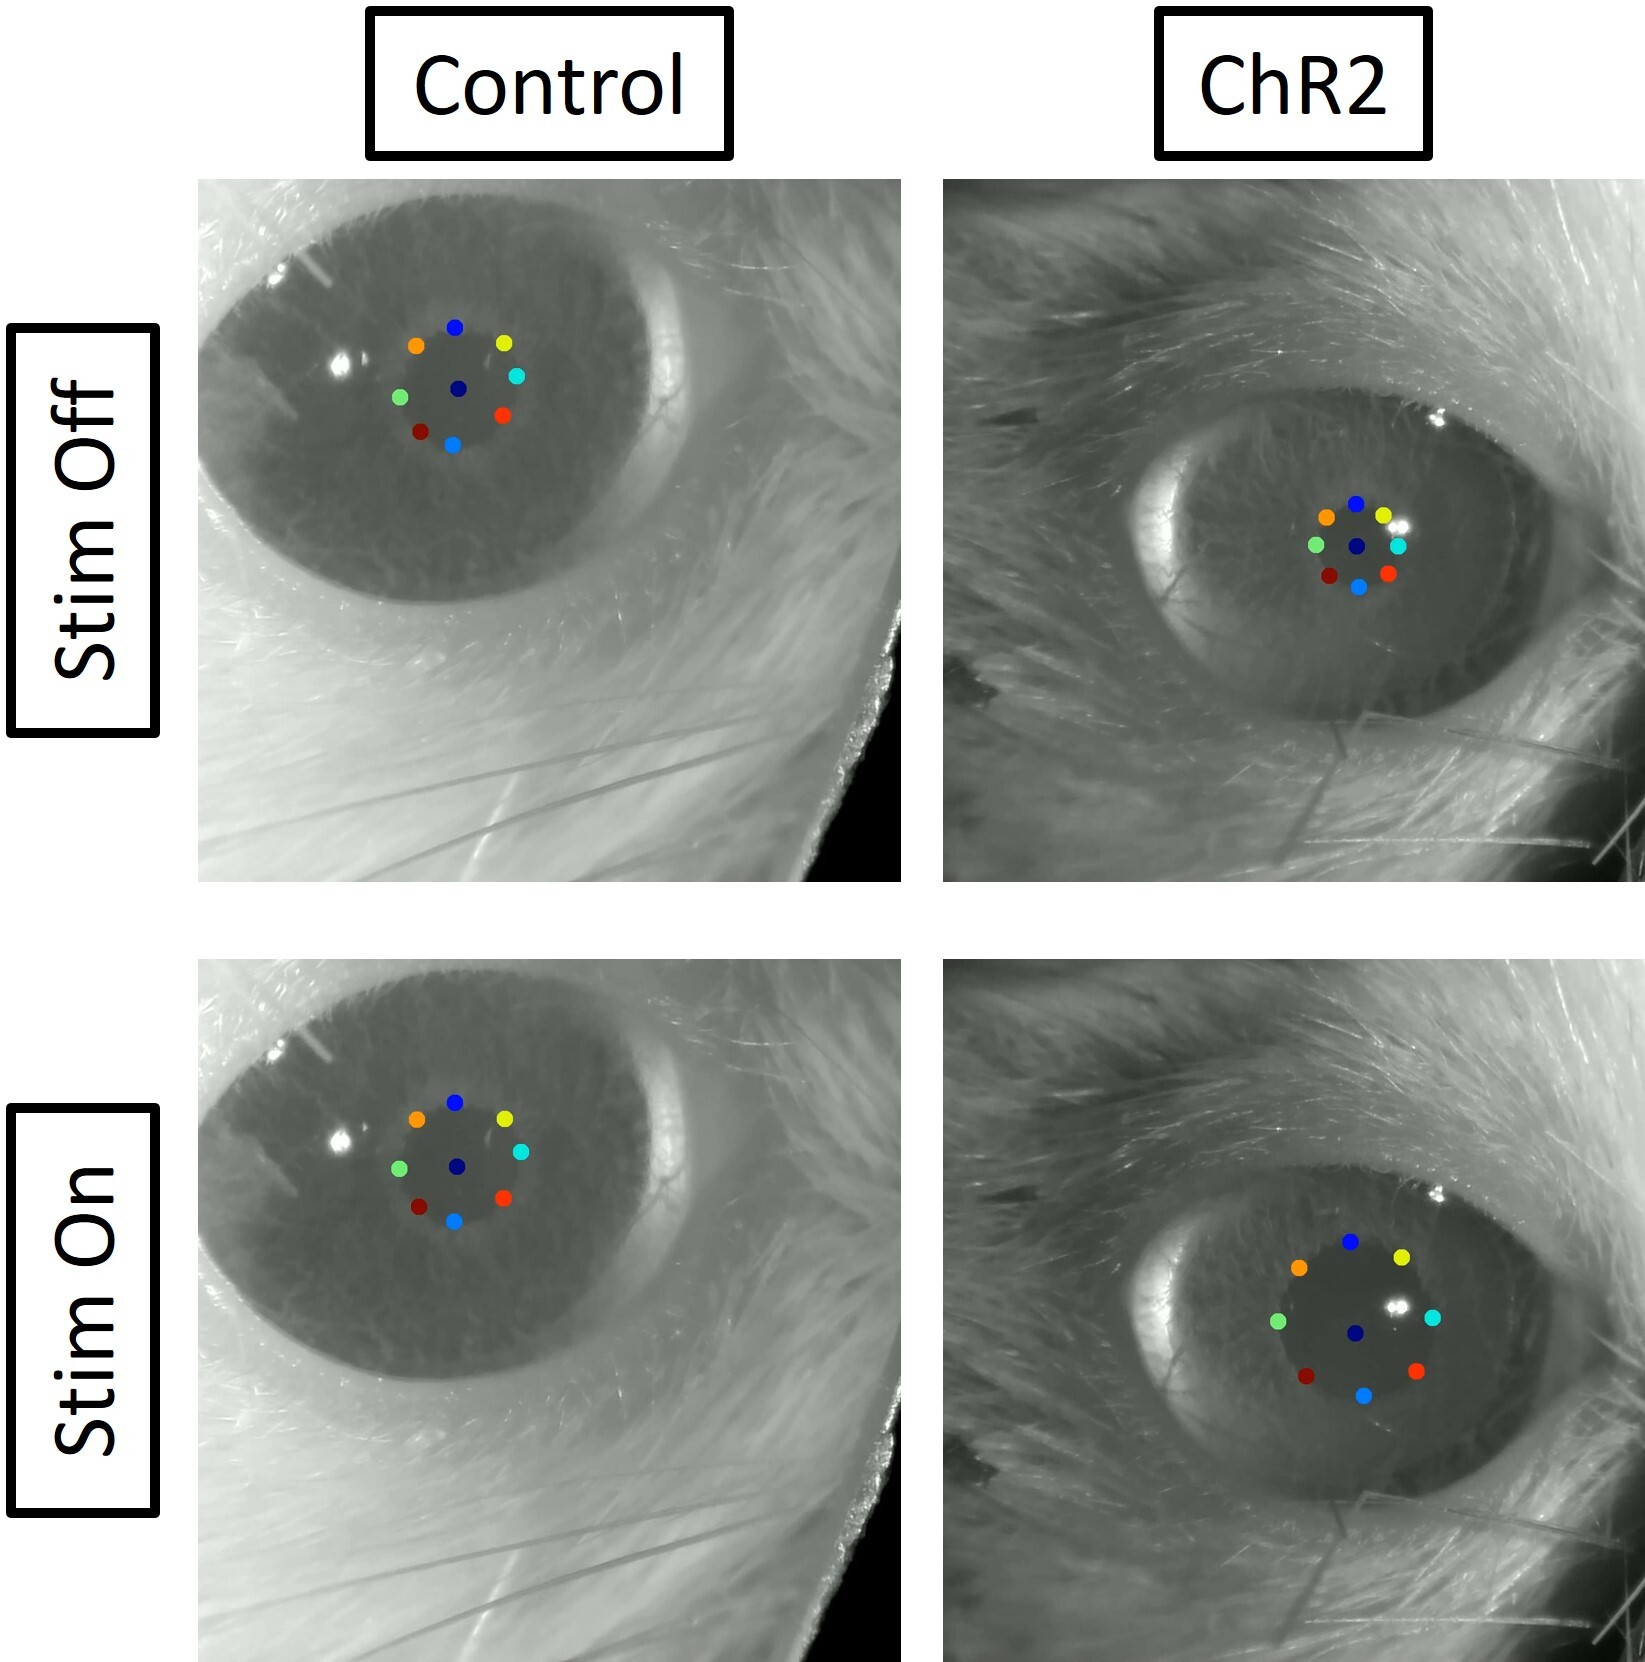
Constant (60 mW) stimulation of the LC induced robust pupil dilation in ChR2 injected animals compared to mCherry animals (Figure 1), confirming viral expression and optic ferrule targeting5. Functional connectivity matrices were calculated using two rats for each group (mCherry and ChR2; Figure 2). The difference in connectivity between the 5 Hz stimulation scan and the baseline scan are shown in the last row of Figure 2. Although fluctuations in connectivity are seen between baseline and 5 Hz stimulation in both groups, the difference matrix generally shows increased connectivity between structures in the ChR2 group. In contrast, differences observed in the control group appear to be more balanced between increases and decreases in connectivity, with a slight preference for decreased connectivity between structures. This observation is further illustrated in Figure 3, which depicts the distribution of correlation coefficients observed in each group and under each condition. The center of mass of the distribution shifts slightly toward more positive values under 5 Hz stimulation in the ChR2 animals, whereas in the control animals the distribution shifts slightly more toward negative values. Natural fluctuations in connectivity throughout a scan session are expected and most likely account for the changes seen in the control group. These results are preliminary and should be interpreted with caution because the sample size for each group (n=2) is not enough to make any definitive conclusions. However, we have demonstrated functional expression of ChR2 in the LC, and expect any connectivity trends as a result of LC stimulation to become more apparent with the inclusion of more animals in this study.
Conclusion
These results indicate that we achieved accurate viral targeting and expression of ChR2 in the LC and suggest that optogenetic stimulation of the LC drives changes in global functional connectivity. Though preliminary, these results show the potential of the LC to coordinate global functional connectivity. Future work will include the incorporation of more rats and testing the consequences of other patterns and frequencies of LC stimulation.
Acknowledgements
No acknowledgement found.References
1. Poe, G. R. et al. Locus coeruleus: a new look at the blue spot. Nature Reviews Neuroscience vol. 21 644–659 (2020).
2. Oyarzabal, E. A. et al. Chemogenetic activation of Locus Coeruleus Noradrenergic Neurons Modulates the Default Mode Network. bioRxiv 2021.10.28.463794 (2021) doi:10.1101/2021.10.28.463794.
3. Zerbi, V. et al. Rapid Reconfiguration of the Functional Connectome after Chemogenetic Locus Coeruleus Activation. Neuron 103, 702–718.e5 (2019).
4. Vazey, E. M. & Aston-Jones, G. Designer receptor manipulations reveal a role of the locus coeruleus noradrenergic system in isoflurane general anesthesia. Proc. Natl. Acad. Sci. U. S. A. 111, 3859–3864 (2014).
5. Privitera, M. et al. A complete pupillometry toolbox for real-time monitoring of locus coeruleus activity in rodents. Nat. Protoc. 15, 2301–2320 (2020).
6. Nan Xu, Leo Zhang+, Sam Larson+, Zengmin Li, Wen-Ju Pan, Kai-Hsiang Chuang, Shella Keilholz, 2021. Rodent whole-brain fMRI data preprocessing toolbox. https://github.com/GT-EmoryMINDlab/rodent-whole-brain-preprocessing-recipe (+ equal contributions)
7. Barrière, D. A. et al. The SIGMA rat brain templates and atlases for multimodal MRI data analysis and visualization. Nat. Commun. 10, 5699 (2019).
Figures