1821
Strong non-BOLD Effect of EPI Gradient Switching Sounds on Voxel Intensities Both Inside and Outside Rat Cranium1Yale University, West Tisbury, MA, United States, 2Harvard Medical School, Boston, MA, United States, 3Radiology, Brigham and Women's Hospital, Boston, MA, United States
Synopsis
Echoplanar images of rat head with and without blocking of external ear canals revealed large voxel intensity changes outside as well as inside the cranium. These are probably mechanical effects of vibrational energy originating in the tympanic membrane and coupled to other tissue compartments of the head through the auditory ossicles, basilar membrane, and cochlear round window. They are so large that even slight variations in them may distort magnetic resonance imaging measurements of neural activity and water diffusion. Awareness of that possibility may inform measures to remove or compensate for it.
Methods Using a Bruker 7T scanner, we acquired cranial EPI on 7 rats anesthetized with isoflurane. In 5, after making baseline multi-slice control images with ears open, images were again acquired after blocking one external ear canal with veterinary ophthalmic ointment, and again after also blocking the canal on the other side. The ointment appears in the ear canals in high-resolution but not in echoplanar images due to its long T1. It was applied from a pre-positioned tube so the animals were not moved during these perturbations. As tested in a dead rat, the ointment had no susceptibility effects. In 2 other rats, we first blocked both ear canals with rolled foam plugs for baseline images and repeated imaging after sequentially removing the plugs with attached threads to avoid moving the animal. For each condition, co-registered high-resolution images were also acquired for correlation with anatomy.
Results All ear canal manipulations in all 7 animals caused large, repeatable, lateralized voxel intensity changes widely distributed throughout tissues of the head in patterns mainly conforming to tissue anatomical compartments both inside and outside the cranium.
Fig 1 shows results of ear canal blockage with ointment - first on the rat's left side, then on the right - for a coronal slice at the level of the cochlear nuclei. The most prominent effects are clusters of increased voxel intensity in cervical muscle, where the largest single voxel increase is 1905% (“max ↑” in Fig 1g). Intensity went up or down by hundreds of percent in many other voxels inside as well as outside the cranium. Recognizably similar results were obtained in all 5 rats every time an ear canal was blocked.
Fig 2 shows effects of opening the ear canals one at a time after initial blockage with foam plugs. Regions of increased voxel intensity in cervical muscle are again the most prominent result, though their shapes and locations are different from those of Fig 1, and individual voxel intensity changes are in a lower range, the largest being “only” 521% (“max ↑” in Fig 2g).
Fig 3 shows that in slices rostral to the inferior colliculi, voxel intensity changes due to blocking (a, b) and unblocking (c, d) the external ear canals are much less prominently lateralized than in Figs 1 and 2 and are largely reciprocal in sign. Changes of both signs are clustered in or near the cerebrospinal fluid spaces around the brain, and many of the sign patterns due to blocking and unblocking are nearly mirror images of each other. All slices rostral to the inferior colliculi in both groups of rats showed intensity changes of similar anatomical distribution and sign.
Discussion The distribution and magnitude of the voxel intensity changes we report here have no precedent in brain MRI literature and were a complete surprise to us. We believe they are mechanical phenomena caused by basilar membrane vibrational energy that reaches extra-cochlear tissue compartments via the cochlear round window. Like signal attenuation by gradients used to measure water diffusion, attenuation or augmentation of signal will also ensue from cochlear vibrational energy depending on whether the amplitude of vibrations at a specific anatomical location are increased or decreased. This will in turn be influenced by basilar membrane spectral characteristics and resulting spatial pattern of acoustic propagation throughout the head. The voxel intensity changes we observed are so large that even smaller variations due to much weaker fluctuations of ambient auditory stimuli might distort or, worse, be mistaken for the ~1-3% changes typically reported in BOLD fMRI research. The same vibrational energy may also affect diffusion tensor imaging (DTI). EPI noise is always present in such experiments and is difficult to suppress. In BOLD fMRI, the danger is magnified by the fact that voxel clustering procedures commonly used in data analysis could obscure or conceal the kind of intensity changes we observed. Such changes may also be a factor contributing to the high false positive rates found in meta-analysis of BOLD fMRI experiments [2]. Even so, however, they need not substantially distort BOLD fMRI or DTI results if they can be documented to remain the same throughout data acquisition or can be monitored well enough to be taken into account in data analysis.
Conclusion Alteration of tympanic membrane input to the cochlea has large voxel intensity effects which are probably mechanical in origin and may be profoundly consequential for interpretation of BOLD fMRI and DTI data.
Acknowledgements
We are indebted to Nicholas Todd and Nathan MacDannold for donation of their personal time and laboratory resources to make these experiments possible, and for their penetrating criticism of early results. This work was supported by NIH grant R01EB028664.References
1. Bandettini, P.A., et al., Functional MRI of brain activation induced by scanner acoustic noise. Magnetic Resonance in Medicine, 1998. 39(3): p. 410-416.
2. Eklund, A., T.E. Nichols, and H. Knutsson, Cluster failure: Why fMRI inferences for spatial extent have inflated false-positive rates. Proc Natl Acad Sci U S A, 2016. 113(28): p. 7900-5.
Figures
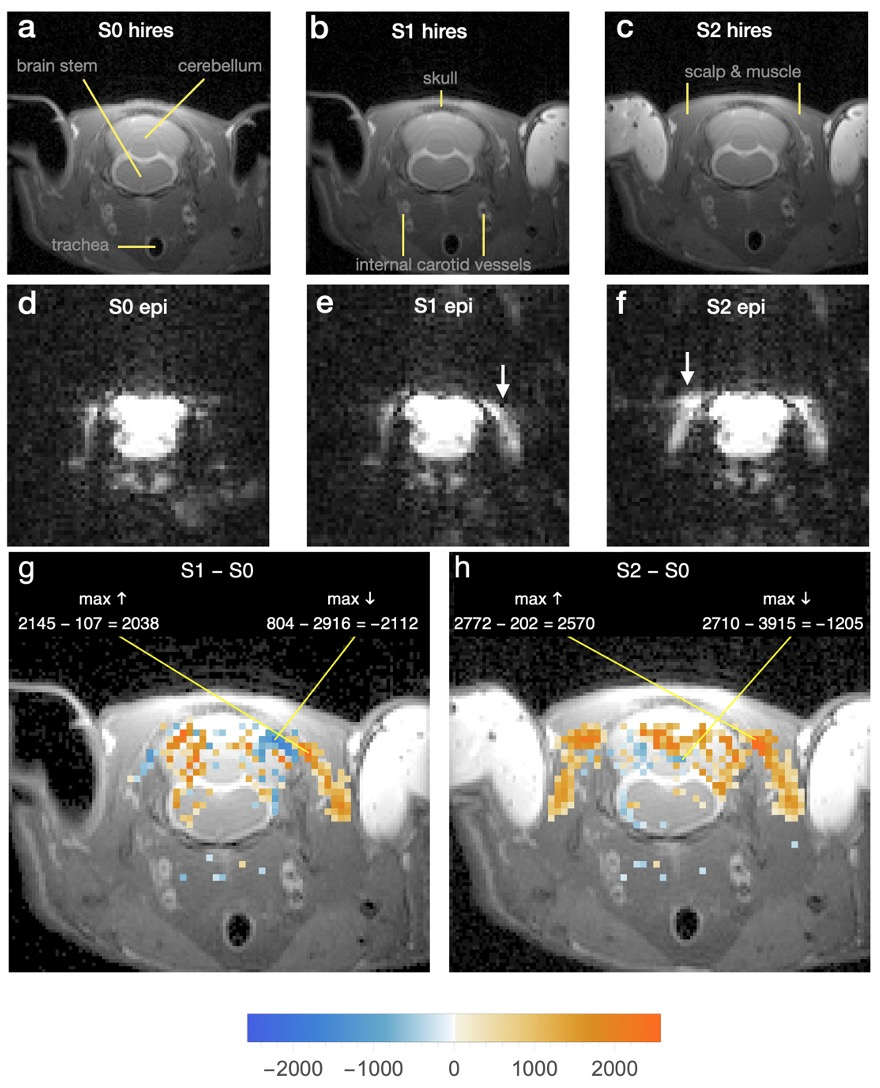
Fig 1
Hires (a-c) and echoplanar (d-f) images of slice through cochlear nuclei. Ear canals initially open closed with ointment, first on left, causing a large region of increased intensity in cervical muscle (e, arrow). Closing right canal had similar effect (f, arrow).
g 200 largest intensity increases/decreases due to subtraction S1epi-S0epi laid over hires image b. Opacity proportional to absolute intensity difference. Numbers in color bar and equations are in voxel intensity units. Orange/blue represent increased/decreased intensity.
h Same as g for S2epi-S0epi with hires c.
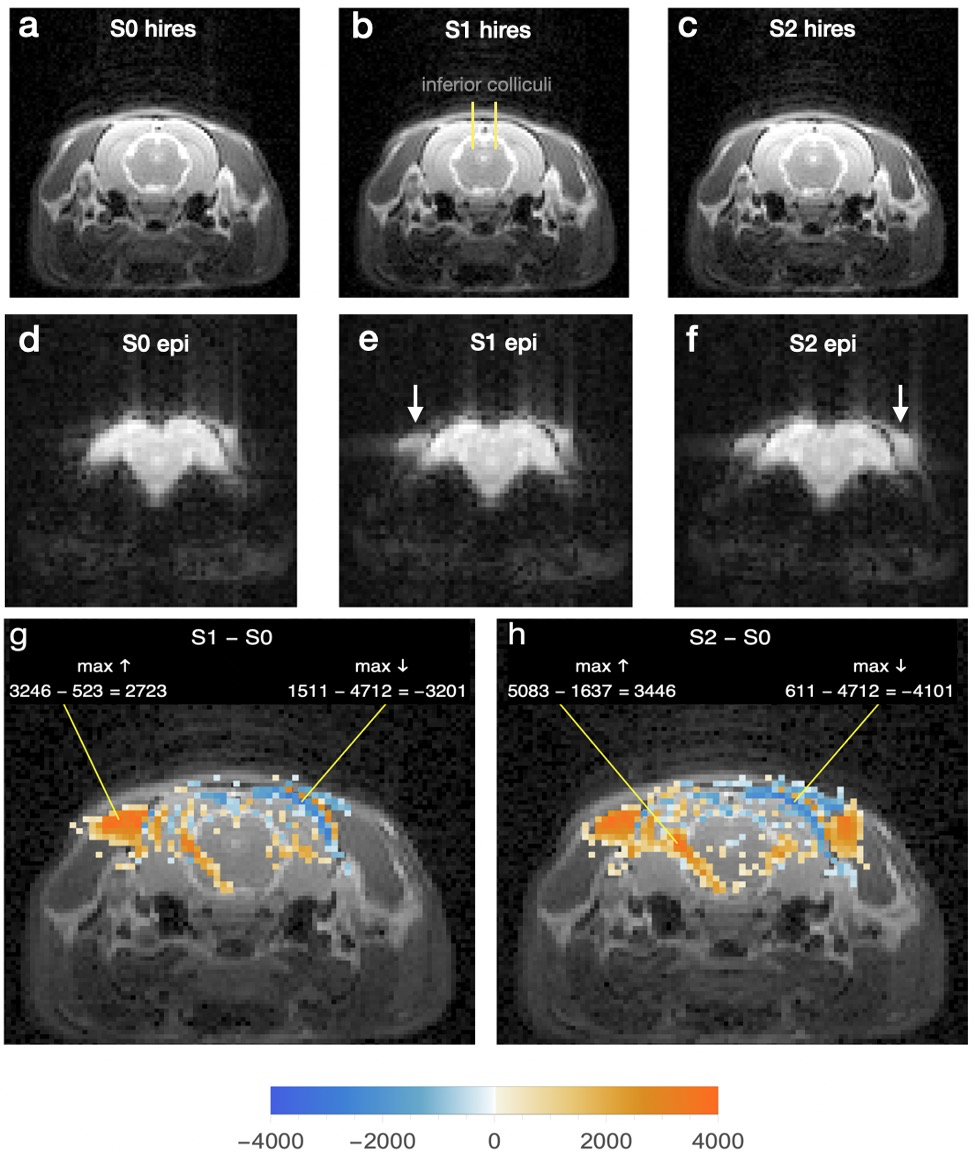
Fig 2
Hires (a-c) and echoplanar (d-f) images through inferior colliculi. Ear canals initially blocked with foam plugs were opened sequentially, first on right, whereupon the echoplanar image (e, arrow) showed a region of increased intensity compared to the same region of d. After opening of left canal, a similar intensity increase appeared in the echoplanar image on that side (f, arrow).
g Difference image made and labeled as in Fig 1g.
h Same as g for subtraction S2epi – S0epi.
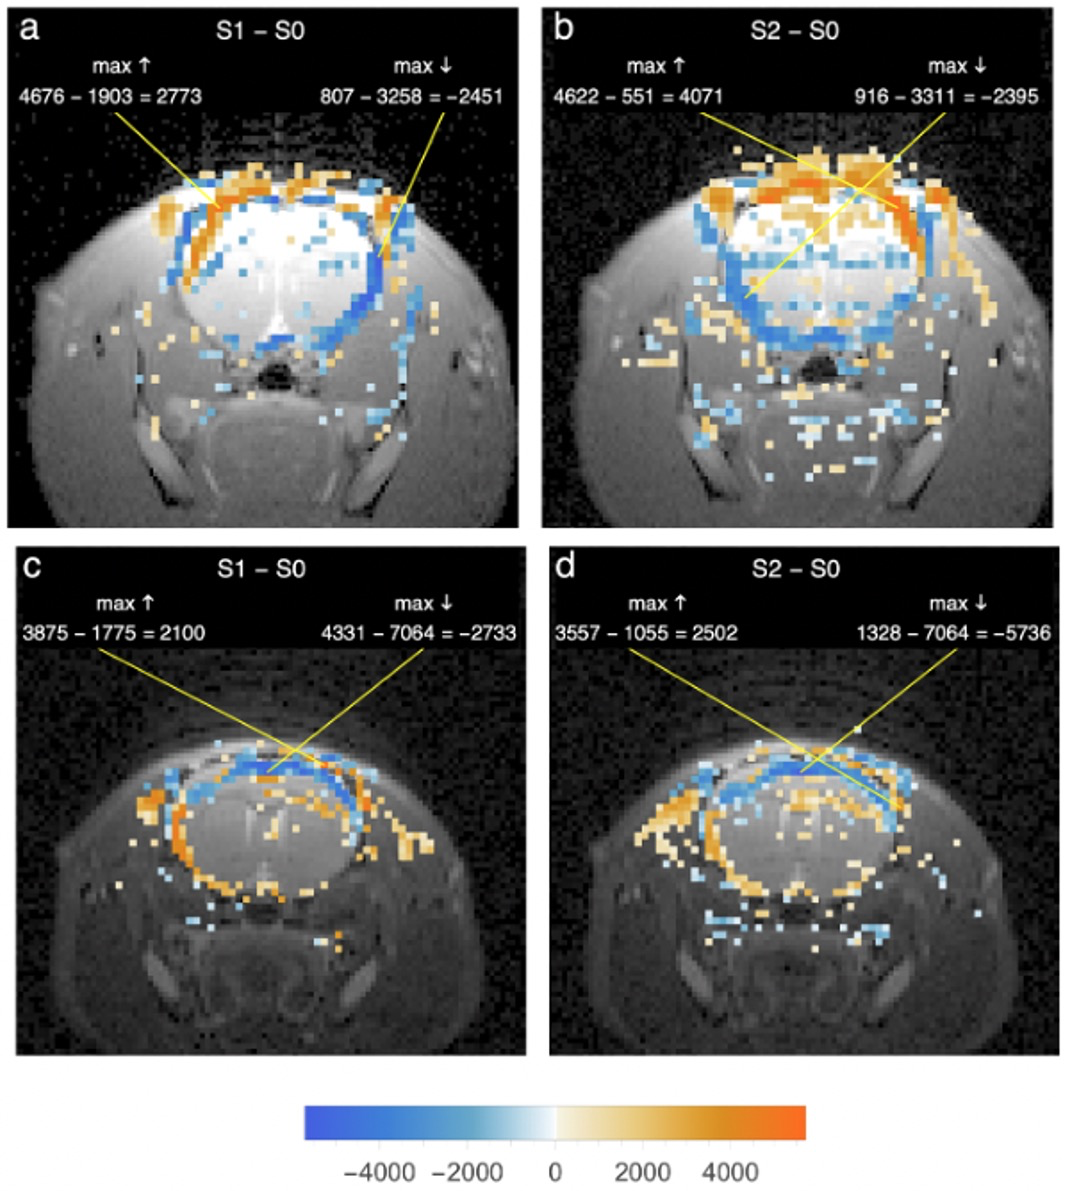
Fig 3
a Same rat and condition as Fig 1g. Hires image of slice 3.6 mm rostral to inferior colliculi overlaid with 200 largest positive/negative intensity differences from S1epi - S0epi after ointment-blocking of left ear canal.
b Same hires with S2epi - S0epi differences after right canal also blocked.
c Same rat and condition as Fig 2g. Same format as a and b, but with initially foam-blocked ear canals opened sequentially, first on left.
d Same as c after opening of right ear canal.