1815
Postmortem Multiple Sclerosis Brain Lesion Identification at Low Field1Physics and Astronomy, University of British Columbia, Vancouver, BC, Canada, 2Radiology, University of British Columbia, Vancouver, BC, Canada, 3International Collaboration on Repair Discoveries, Vancouver, BC, Canada, 4Hyperfine, Inc., Guilford, CT, United States, 5Medical Radiation Physics, Lund University, Lund, Sweden, 6Neuroimaging, King's College London, London, United Kingdom, 7MNCH D&T, Bill and Melinda Gates Foundation, Seattle, WA, United States, 8Pathology and Laboratory Medicine, University of British Columbia, Vancouver, BC, Canada, 9Medicine, University of British Columbia, Vancouver, BC, Canada
Synopsis
A single hemisphere of postmortem brain tissue from a subject with multiple sclerosis (MS) was scanned at high (Philips Elition 3T) and low (Hyperfine Swoop 64mT) field strength to determine whether lesions could be detected using a portable low field MRI system. T2-weighted scans were acquired at both field strengths with matching resolutions to assess the impact of low field. Comparisons with a high resolution 3T scan showed that of 17 visible lesions, 11 were seen on the lower resolution 3T and 10 were seen on the 64mT scan, demonstrating the feasibility of lesion detection at low field.
Introduction
Multiple sclerosis (MS) is a chronic inflammatory disease of the central nervous system characterised by demyelinating lesions that inform the diagnosis and monitoring of MS. Lesions are typically identified using FLAIR and T2-weighted1 (T2w) images at clinical field strengths of 1.5T and 3T. Recently developed, low field, point-of-care MRI scanners have the potential to vastly improve accessibility of imaging for MS diagnosis and care. Hyperfine Inc manufactures a 64mT point-of-care system2,3 with standard imaging sequences and protocols suited to MS. The purpose of this study was to determine whether lesions visible in postmortem tissue at 3T could be detected at 64mT. Here we compared a high resolution T2w 3T scan of postmortem brain tissue from a subject with MS to resolution-matched 64mT and 3T scans, to determine the feasibility of detecting lesions at low field.Methods
Acquisition: The following 3DT2w sequences were acquired at 3T (Philips Elition X, 32-channel head coil) or 64mT (Hyperfine Swoop, 8-channel head coil) for a single hemisphere of formalin fixed postmortem brain tissue from a 68-year-old male with MS:1. Higher resolution 3T: Turbo Spin Echo (TSE) factor=14, Compressed Sensing (CS) factor=3, effective TE/TR=42.36/1000ms, 299 slices acquired at 1x1x1mm3, reconstructed to 0.67x0.67x0.67mm3, 2 signal averages, acquisition time=6m:36s
2. Lower resolution 3T: TSE factor=14, no under sampling, effective TE/TR=42/1000ms, 40 slices at 1.5x1.5x5mm3, 4 signal averages, acquisition time=9m:50s
3. Lower resolution 64mT: custom sequence developed for scanning fixed tissue with TSE factor=10, effective TE/TR=28.85/2000ms, 40 slices at 1.5x1.5x5mm3, 6 averages in image space, acquisition time per average=21m:7s, total acquisition time=126m:42s
The container for the postmortem tissue did not fully fit in the 64mT scanner head coil, so all images presented here were cropped to only include the overlapping field-of-view.
Analysis: The higher resolution 3T 3DT2w scan was used as the gold standard for lesion identification. Lower resolution images were compared to the gold standard to identify and count lesions. For each scan, the volume of the smallest identifiable lesion was calculated from a manually drawn lesion mask (fslstats, FSL4).
Results
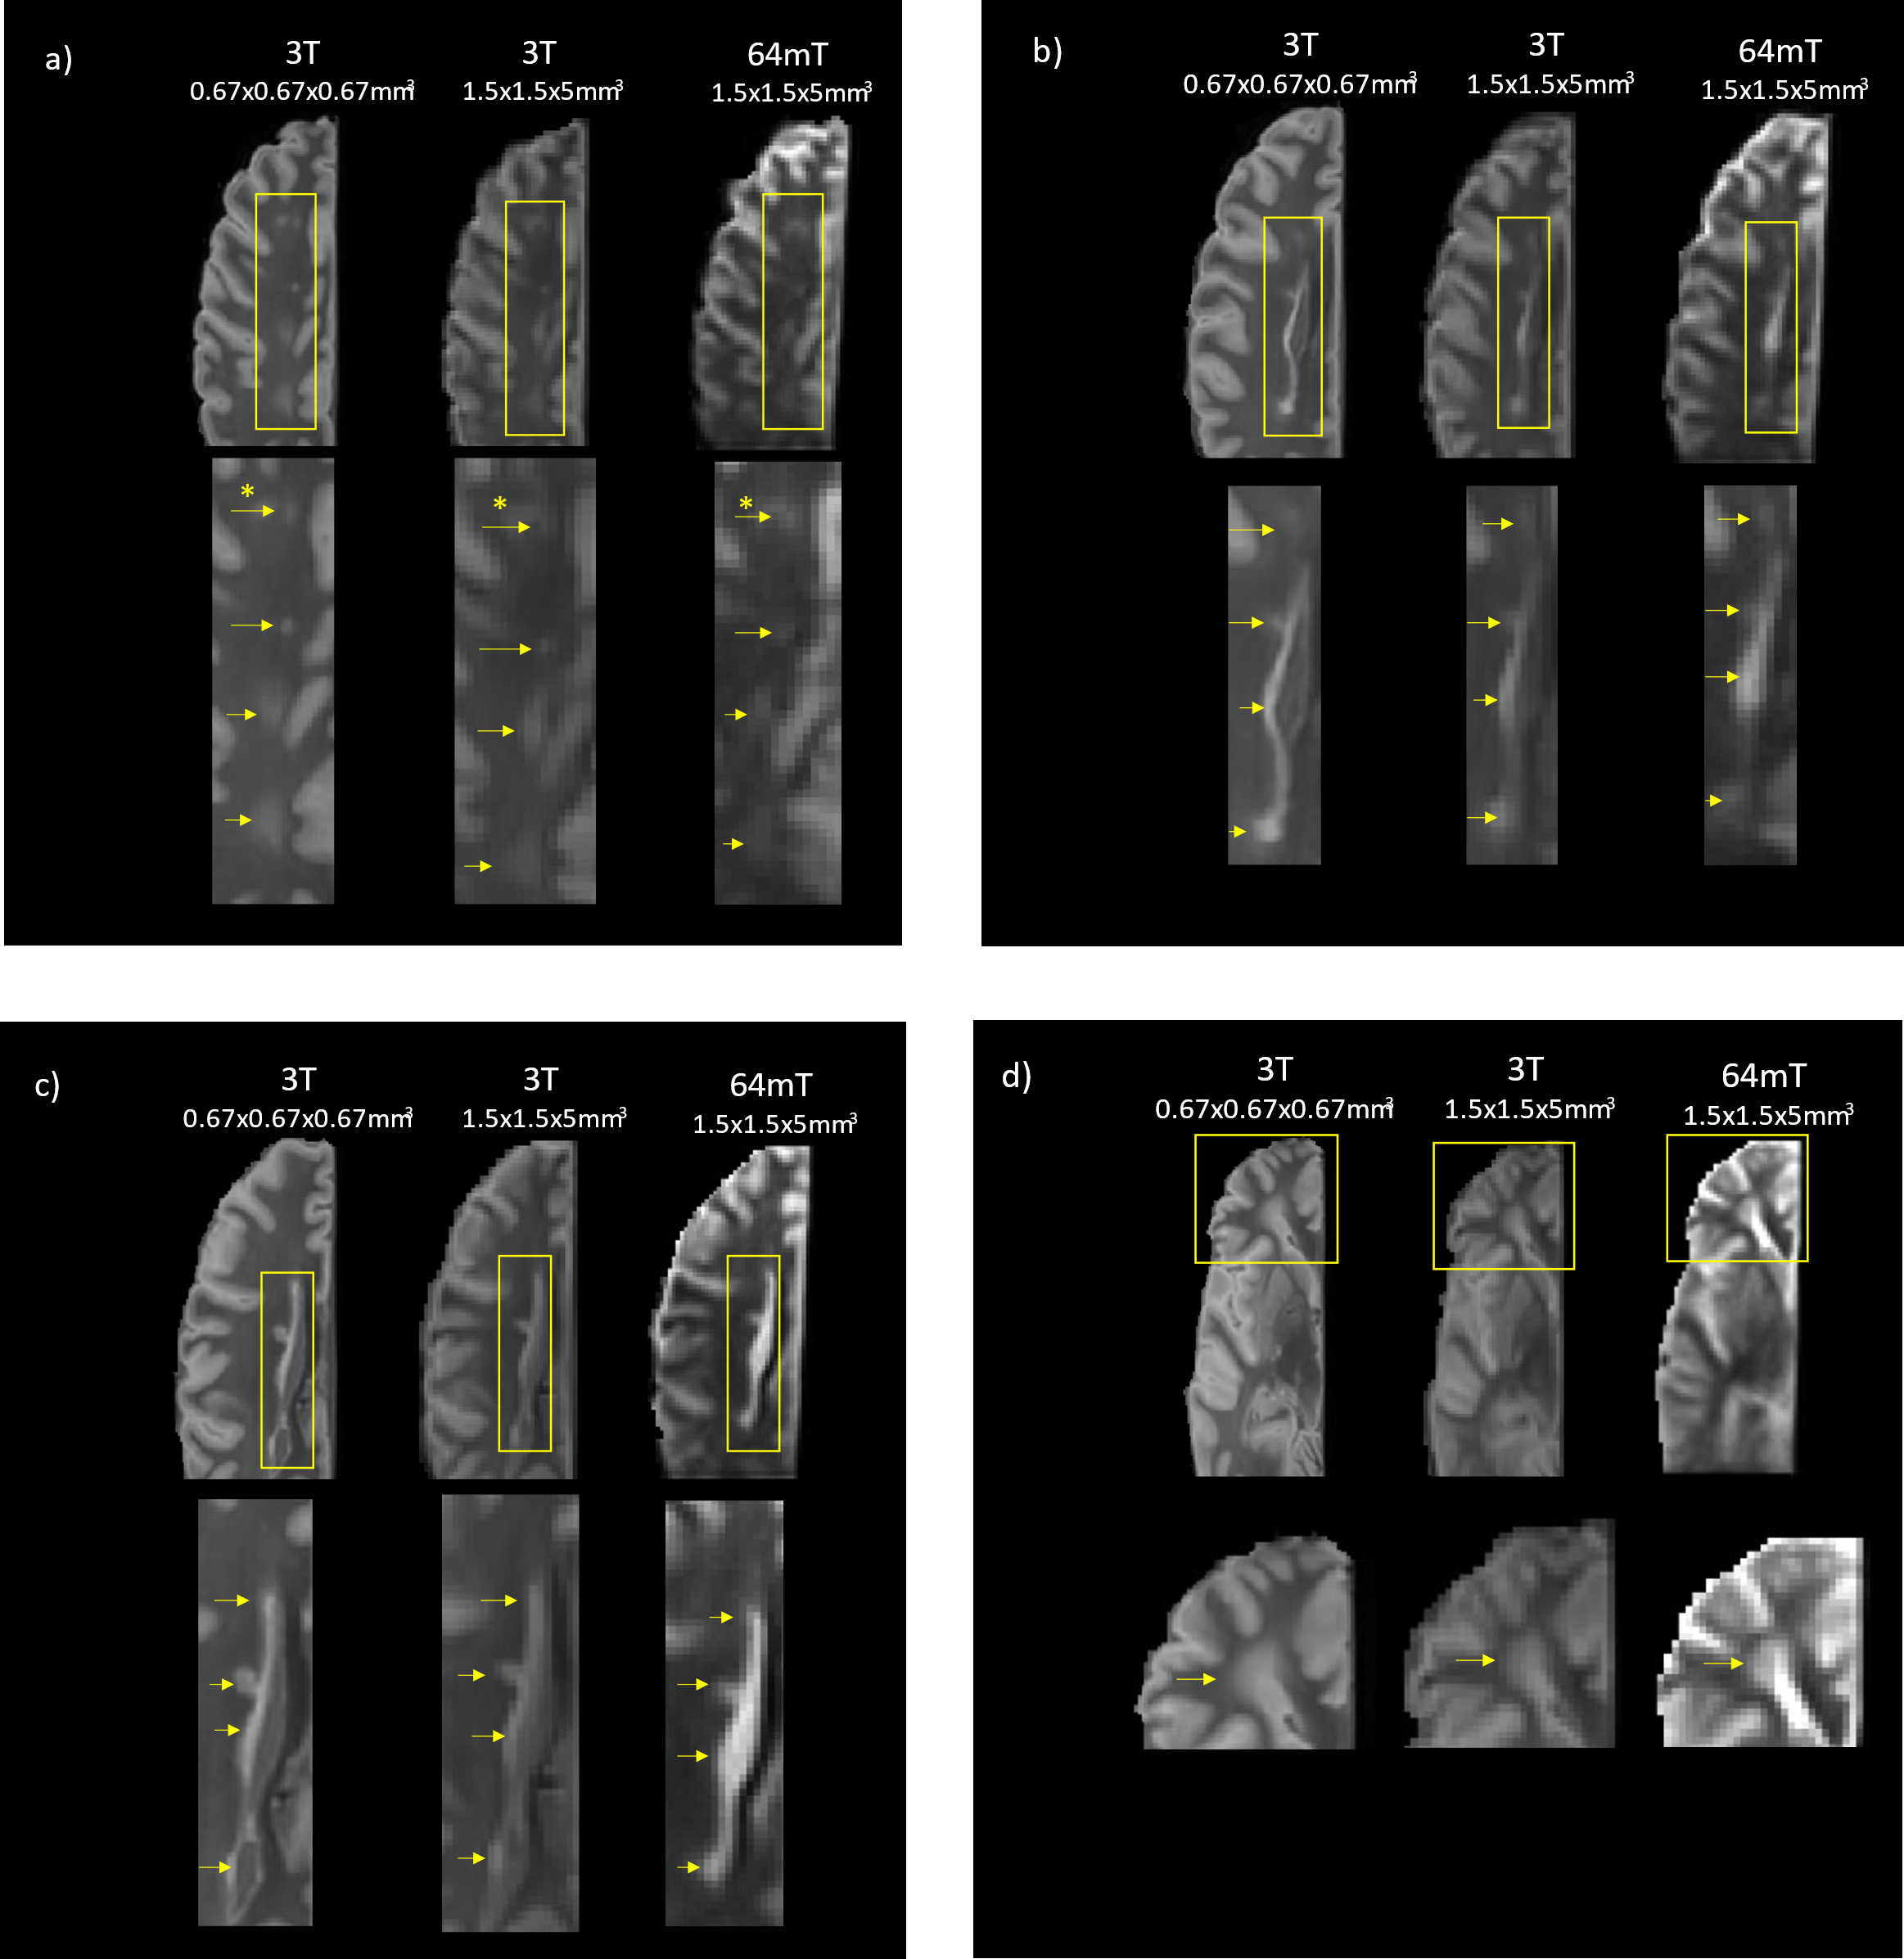
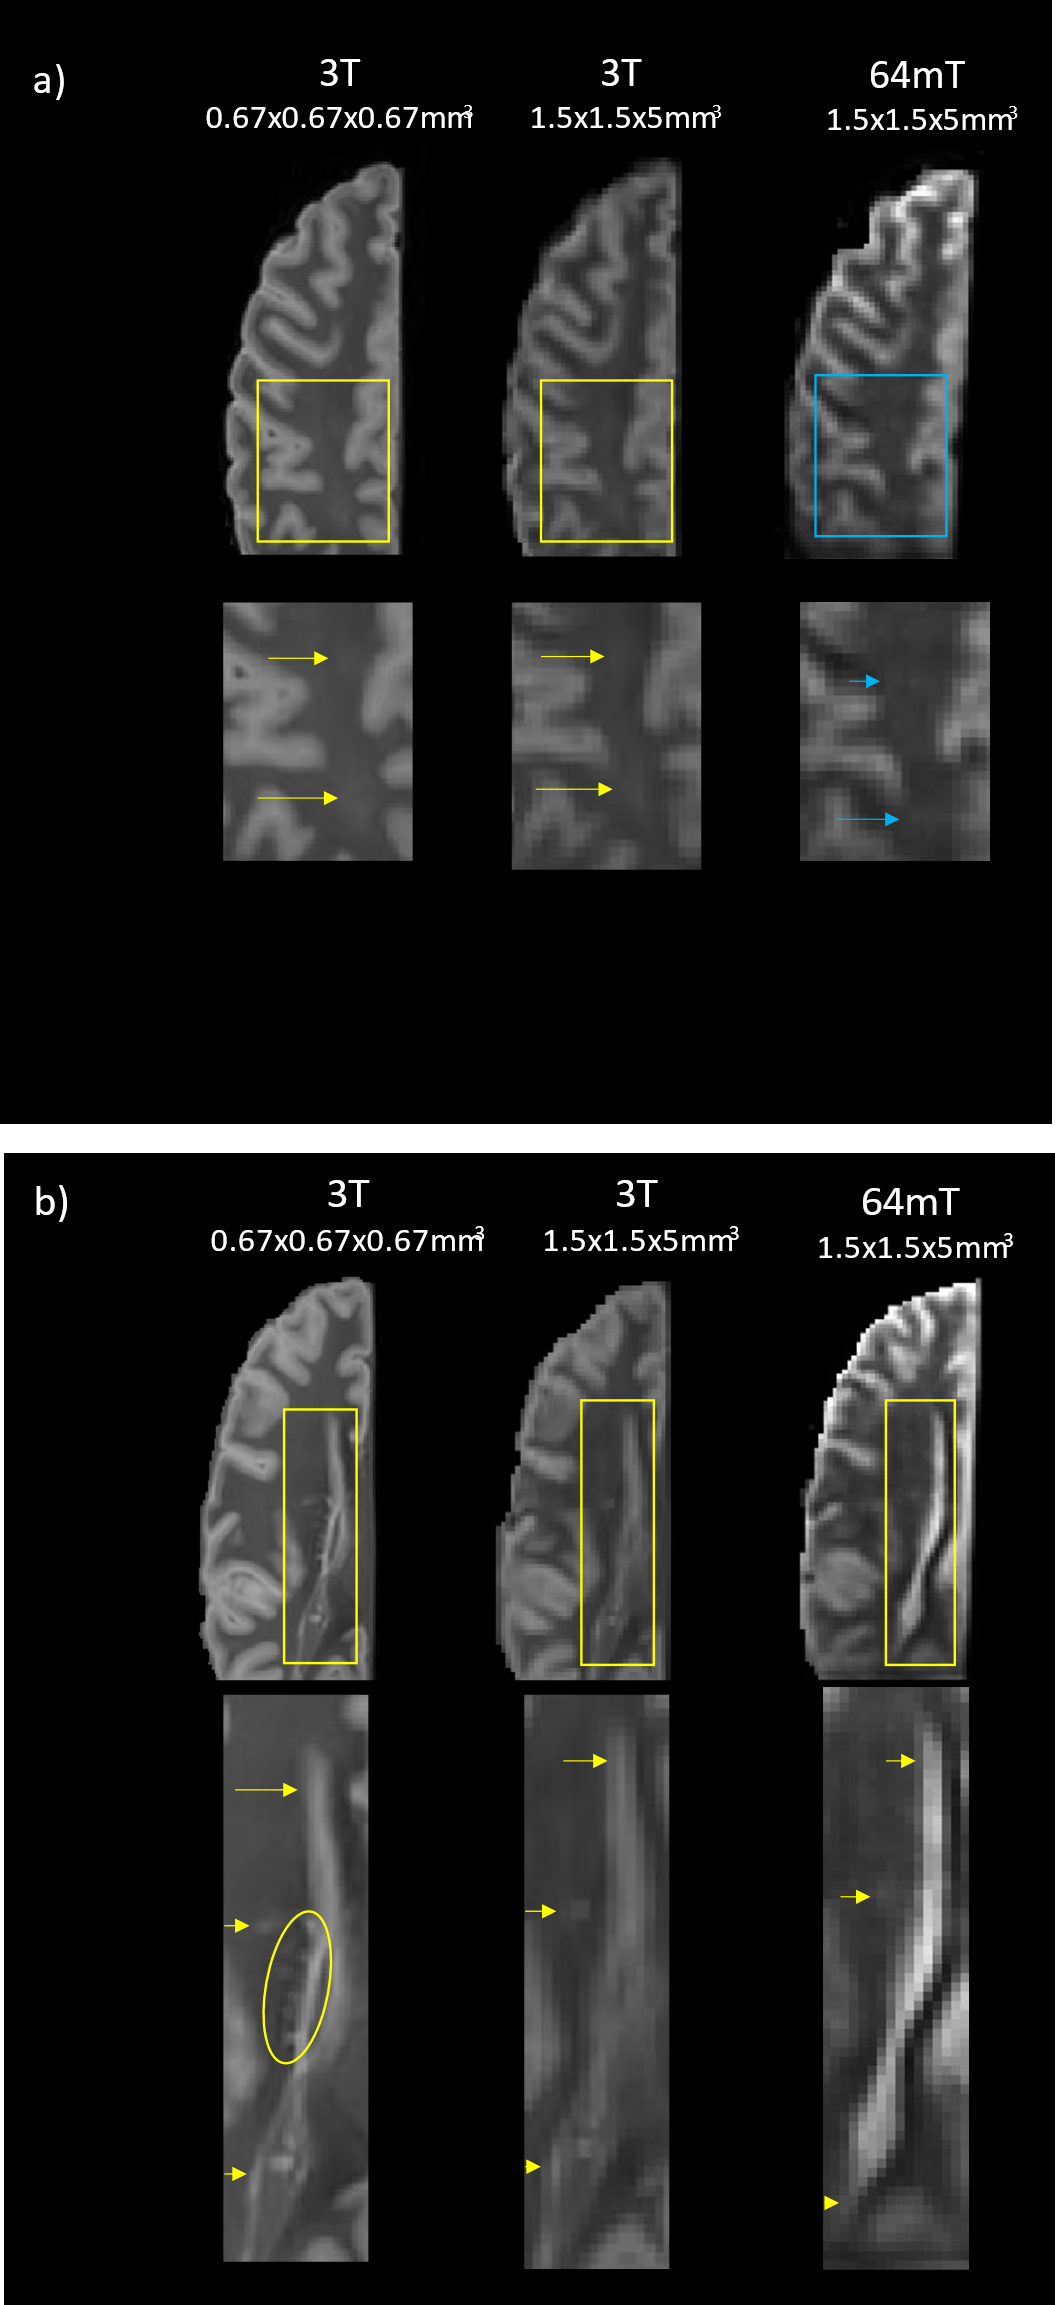
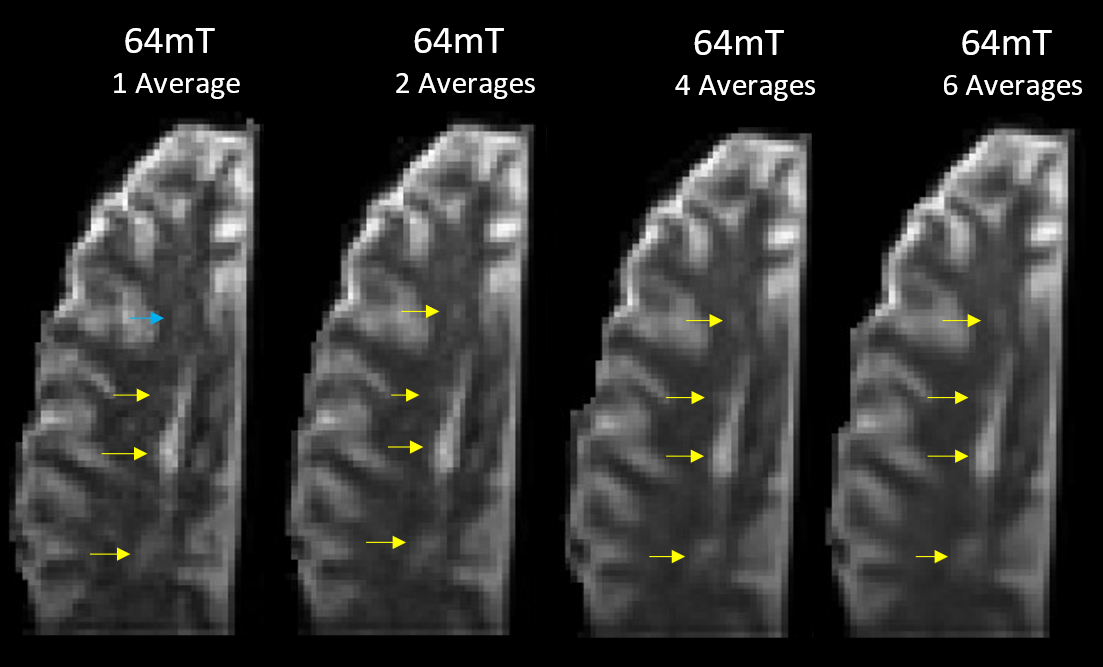
Figure 1 shows a qualitative comparison of the scans at similar slice locations where all lesions in the higher resolution 3T scan are visible in both lower resolution images. Figure 2 shows examples of slice locations where lesions in the higher resolution 3T scan are less visible in the lower resolution 64mT scan.Figure 3 shows a comparison of the lower resolution 64mT scan with 1, 2, 4 and 6 averages in image space.
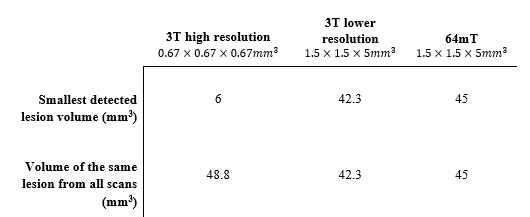
Table 1 shows the smallest detected lesion volume from each scan, and the volume of a common lesion (marked by an asterisk in Figure 1a) from each scan.
Discussion
Of the 17 lesions identified on the higher resolution 3T scan, 11 were clearly visible on the lower resolution 3T scan and 10 on the lower resolution 64mT scan. The lesions not positively identified at low field nevertheless showed as an area of mild hyperintensity, as seen in Figure 2a. The smallest detected lesion volumes varied between the higher resolution 3T and lower resolution scans. This suggests that resolution will be the major factor for lesion detection at either field strength. Image quality improved with averaging as expected, though most lesions were visible with fewer averages (Figure 3).The low field scan took 21m:7s to acquire a single average, longer than the higher or lower resolution 3T scans (2 averages in 6m:36s and 4 averages in 9m50s, respectively). This difference in acquisition time can be attributed to the ~50 times lower signal-to-noise ratio at 64mT versus 3T, which requires much more sampling to provide similar SNR5; further optimization of the sequence is expected to reduce the low field scan time. Fixation of ex vivo tissue is also known to cause changes to imaging characteristics, such as reduced relaxation times6–8. At 3T, echo times were lowered relative to standard in vivo echo times to account for the altered relaxation times and provide an acceptable level of contrast for lesion identification. Similar changes were then made at 64mT, taking into consideration the reduction in T1 and similar T2 values that can be expected at low field5,9,10.
Recent work in vivo using FLAIR at 64mT to detect MS lesions11,12 showed good agreement with the smallest detected lesion sizes presented here. Now that the feasibility of lesion detection has been demonstrated, further studies to map T1 and T2 of brain tissue at low field are needed to optimize lesion visibility at low field.
Conclusion
Resolution-matched T2w scans of postmortem MS brain tissue at 3T and 64mT were compared to a higher resolution 3T scan. Many of the lesions visible on the gold standard higher resolution 3T scan were also detected with the low-field portable MRI, showing the feasibility of lesion detection, and paving the way for further in vivo work in MS using low field, point-of-care systems.Acknowledgements
We sincerely thank the MS patient and family for tissue donation. We thank Hyperfine Inc and the MR technologists at the UBC MRI Research Centre for their involvement and support. This research was funded in parts by the Bill & Melinda Gates Foundation, Brain Canada (SK), Michael Smith Health Research BC (SK, HL), NSERC (SB, SK, AD) and the Multiple Sclerosis Society of Canada (GRWM).References
1. Filippi M, Preziosa P, Banwell BL, et al. Assessment of lesions on magnetic resonance imaging in multiple sclerosis: practical guidelines. Brain. 2019;142(7). doi:10.1093/brain/awz144
2. Sheth KN, Mazurek MH, Yuen MM, et al. Assessment of Brain Injury Using Portable, Low-Field Magnetic Resonance Imaging at the Bedside of Critically Ill Patients. JAMA Neurology. 2021;78(1). doi:10.1001/jamaneurol.2020.3263
3. Mazurek MH, Cahn BA, Yuen MM, et al. Portable, bedside, low-field magnetic resonance imaging for evaluation of intracerebral hemorrhage. Nature Communications. 2021;12(1). doi:10.1038/s41467-021-25441-6
4. Jenkinson M, Beckmann CF, Behrens TEJ, Woolrich MW, Smith SM. FSL. NeuroImage. 2012;62(2). doi:10.1016/j.neuroimage.2011.09.015
5. Marques JP, Simonis FFJ, Webb AG. Low‐field MRI: An MR physics perspective. Journal of Magnetic Resonance Imaging. 2019;49(6). doi:10.1002/jmri.26637
6. Raman MR, Shu Y, Lesnick TG, Jack CR, Kantarci K. Regional T 1 relaxation time constants in Ex vivo human brain: Longitudinal effects of formalin exposure. Magnetic Resonance in Medicine. 2017;77(2). doi:10.1002/mrm.26140
7. Shatil AS, Uddin MN, Matsuda KM, Figley CR. Quantitative Ex Vivo MRI Changes due to Progressive Formalin Fixation in Whole Human Brain Specimens: Longitudinal Characterization of Diffusion, Relaxometry, and Myelin Water Fraction Measurements at 3T. Frontiers in Medicine. 2018;5. doi:10.3389/fmed.2018.00031
8. Dawe RJ, Bennett DA, Schneider JA, Vasireddi SK, Arfanakis K. Postmortem MRI of human brain hemispheres: T 2 relaxation times during formaldehyde fixation. Magnetic Resonance in Medicine. 2009;61(4). doi:10.1002/mrm.21909
9. O’Reilly T, Webb AG. In vivo T 1 and T 2 relaxation time maps of brain tissue, skeletal muscle, and lipid measured in healthy volunteers at 50 mT. Magnetic Resonance in Medicine. Published online September 14, 2021. doi:10.1002/mrm.29009
10. Rooney WD, Johnson G, Li X, et al. Magnetic field and tissue dependencies of human brain longitudinal1H2O relaxation in vivo. Magnetic Resonance in Medicine. 2007;57(2). doi:10.1002/mrm.21122
11. Arnold TC, Tu D, Okar SV, Nair G, By S, Kawatra K, Robert-Fitzgerald TE, Desiderio L, Schindler MK, Shinohara RT, Reich DS, Stein JM. Portable, Low-Field Magnetic Resonance Imaging Sensitively Detects and Accurately Quantifies Multiple Sclerosis Lesions. In: European Committee for Treatment and Research in Multiple Sclerosis. ; 2021.
12. Okar SV, Nair G, Kawatra Karan D, By S, Arnold TC, Tu D, Robert-Fitzgerald TE, Shinohara RT, Stein JM, Reich DS. Sensitivity of Ultra-Low-Field Magnetic Resonance Imaging for White Matter Lesions and Leptomeningeal Enhancement in Multiple Sclerosis. In: European Committee for the Treatment and Research in Multiple Sclerosis. ; 2021.
Figures