1814
Quantitative MRI measurements for T1 and T2 at 0.064T
Kalina V Jordanova1, Michele N Martin1, Karl F Stupic1, Samantha By2, Megan E Poorman2, Rafael O'Halloran2, and Kathryn E Keenan1
1NIST: National Institute of Standards and Technology, Boulder, CO, United States, 2Hyperfine, Inc., Guilford, CT, United States
1NIST: National Institute of Standards and Technology, Boulder, CO, United States, 2Hyperfine, Inc., Guilford, CT, United States
Synopsis
Increased use of low-field MRI and quantitative MRI suggests a need for accurate quantitative measurements for fields <0.55T. We measure T1 and T2 for normal brain tissues at 0.064T using a Hyperfine scanner. T1 measurements gave a mean of 266±8.4ms for white matter, 358±6.6ms for grey matter; T2 measurements gave a mean of 95.8±2.4ms for combined white matter and grey matter, 794±357ms for CSF. Validation samples are measured on the Hyperfine system and compared to measurements taken on an electromagnet NMR at 0.064T.
Introduction
There is re-emerging interest in low-field MRI (<0.55T) as an alternative to clinical MRI (1.5-7T) for point-of-care diagnosis due to lower cost, greater portability, quieter operation, etc1. Quantitative MRI (qMRI) methods are increasingly used to differentiate tissue2, for which knowledge of quantitative values for normal tissue is crucial for clinical utility3,4. Though there are previous studies for low-field T1 and T2 quantitation5,6, there is a need for more inter-site normal quantitative measurements7, and there has been recent investigation into normal brain relaxation parameters at new low-field strengths8. We measure T1 and T2 relaxation parameters in normal brain tissue at 0.064T to contribute to growing efforts in low-field qMRI.Methods
Sample validation measurements were conducted on a 0.064T Hyperfine Swoop scanner (hardware v1.6), and on a Tecmag Redstone spectrometer using TNMR software with a variable field (0.050T–1T) electromagnet set to 0.064T. Three samples were scanned, chosen for their similar expected quantitative properties as white matter (WM) and grey matter (GM) at 0.064T. Two scans were conducted on each instrument to assess repeatability.For electromagnet measurements of the samples, a custom RF copper solenoid coil was designed to allow fluorinert (TMC Industries, Inc., FC-40) to flow around the sample for temperature control (temperature matched to the Hyperfine measurement). T1 values were measured using a 20-step inversion recovery sequence with a composite 180, with inversion times between 0.006s–6s. T2 values were measured with a 20-step Carr Purcell Meiboom Gill (CPMG) sequence.
For Hyperfine measurements of the samples, a 3D-printed phantom holder was used. Measurements were taken at lab temperature, 21.3C. Sample ROIs were located on a per-slice basis, from which mean and standard deviation (SD) were calculated for each scan.
Hyperfine T1 maps were acquired using a research version of the Hyperfine proprietary T1-weighted inversion recovery 3D FSE sequence with scan parameters described in Figure 1. T1 was calculated for each voxel using LMFIT in Python for the model:
$$S_i=S_0*(1-(1+d)*exp(-TI/T_1)+exp(-TR/T_1)))$$
with T1 the target value to fit, inversion time TI, repetition time TR, scale factor for imperfect inversion d, the nominal signal intensity for a voxel S0, and measured signal intensity Si.
Hyperfine T2 maps were acquired using a research version of the Hyperfine proprietary T2-weighted 3D FSE sequence with scan parameters described in Figure 1. The T2 map is calculated in the Hyperfine protocol using SciPy optimize curve_fit in Python for the model:
$$S_i=S_0*exp(-TE/T_2)$$
with T2 the target value for the fit, echo time TE, nominal signal intensity without relaxation S0, and measured signal intensity Si.
In vivo measurements were conducted on two 0.064T Hyperfine Swoop scanners (hardware v1.6 and v1.7), on eight healthy volunteers (four male, four female), ranging from 23-53 years. Informed consent was acquired from all volunteer subjects, in accordance with IRB guidelines. All Hyperfine system measurements used an 8-channel receive, 1-channel transmit head coil.
Use of traditional T1 and T2 mapping sequences resulted in increased imaging times. These sequences were chosen for confidence in measurement reliability and availability on the Hyperfine system. This resulted in two scan sessions per volunteer: one for T1 (53:37min), and one for T2 (20:52min).
To measure relaxation parameter mean and SD in vivo, we used a segmentation algorithm8 to segment WM, GM, and CSF by fitting a mixture of Gaussian distributions to histograms of the measured data. The model used Python Scikit-learn GaussianMixture to fit four Gaussians for each histogram. Measurements for long T1 tissues (CSF), which would be inaccurate using this TR of 3s, are excluded from this study. Additionally, T2 WM and GM measurements were indistinguishable by the segmentation algorithm, so one value is reported for both.
Results
Figure 2 compares T1 and T2 measurements between the Hyperfine and electromagnet systems for three validation samples. The measurements exhibit <10% difference, indicating that the Hyperfine system can provide accurate T1 and T2 measurements at 0.064T in the target quantitative parameter range.Figure 3 shows two representative examples of T1 and T2 in vivo measurements from the Hyperfine system. Examples of tissue segmentation using quantitative histograms are shown, used to segment WM and GM for T1, and the combined WM/GM and CSF for T2.
Figure 4 shows mean and SD for all in vivo measurements.
Discussion
Quantitative MR values were acquired at 0.064T. Many of our measurements are within the range of similar low-field measurements5,8-10.Due to low signal-to-noise ratio (SNR) with low-field MRI, the tissue segmentations were noisy. Similar to previous work8, segmentation based on T1 or T2 alone proved challenging, as the relaxation times of WM and GM were similar to each other.
Low SNR can affect accuracy of quantitative measurements. While most of the T1 and T2 measurements are comparable to literature (Fig. 4b), CSF T2 measurements had elevated uncertainty. The large spread in T2 CSF for our measurements and in literature highlights the difficulty in achieving confidence in those measurements due to long TR requirements that are often not met, as in this study.
Conclusion
To accelerate adoption of qMRI techniques clinically, there is a need for low-field qMR measurements and validation of measurement accuracy. This study contributes to the scientific effort to measure normal quantitative parameters at new low-field strengths.Acknowledgements
National Research Council Postdoctoral FellowshipReferences
- Marques JP, Simonis FFJ, Webb AG. Low-field MRI: An MR physics perspective. J Magn Reson Imaging 2019; 49(6):1528-1542.
- Rosenkrantz AB, Mendiratta-Lala M, Bartholmai BJ, Ganeshan D, Abramson RG, Burton KR, Yu JPJ, Scalzetti EM, Yankeelov TE, Subramaniam RM, Lenchik L. Clinical utility of quantitative imaging. Acad Radiol 2015; 22(1): 33-49.
- Tofts PS and du Boulay EPGH. Towards quantitative measurements of relaxation times and other parameters in the brain. Neuroradiology 1990; 32:407-415.
- Bojorquez JZ, Bricq S, Acquitter C, Brunotte F, Walker PM, Lalande A. What are normal relaxation times of tissues at 3 T? Magn Reson Imaging 2017; 35:69-80.
- Bottomley PA, Foster TH, Argersinger RE, Pfeifer LM. A review of normal tissue hydrogen NMR relaxation times and relaxation mechanisms from 1-100 MHz: dependence on tissue type, NMR frequency, temperature, species, excision, and age. Med Phys 1984; 11(4):425-48.
- Bydder GM, Steiner RE, Young IR, Hall AS, Thomas DJ, Mashall J, Pallis CA, Legg NJ. Clinical NMR imaging of the brain: 140 cases. AJR Am J Roentgenol 1982; 139(2):213-36.
- Keenan KE, Gimbutas Z, Dienstfrey A, Stupic KF, Boss MA, Russek SE, Chenevert TL, Prasad PV, Guo J, Reddick WE, Cecil KM, Shukla-Dave A, Nunez DA, Konar AS, Liu MZ, Jambawalikar SR, Schwartz LH, Zheng J, Hu P, Jackson EF. Multi-site, multi-platform comparison of MRI T1 measurement using the system phantom. PLoS ONE 2021; 16(6):e0252966.
- O’Reilly T and Webb AG. In vivo T1 and T2 relaxation time maps of brain tissue, skeletal muscle, and lipid measured in healthy volunteers at 50 mT. Magn Reson in Med 2021; 00:1–12.
- Fischer HW, Rinck PA, Van Haverbeke Y, and Muller RN. Nuclear Relaxation of Human Brain Gray and White Matter: Analysis of Field Dependence and Implications for MRI. Magn Reson in Med 1990; 16:317–34.
- Hopkins AL, Yeung HN, and Bratton CB. Multiple Field Strength in Vivo T1 and T2 for Cerebrospinal Fluid Protons. Magn Reson in Med 1986; 3:303–11.
Figures
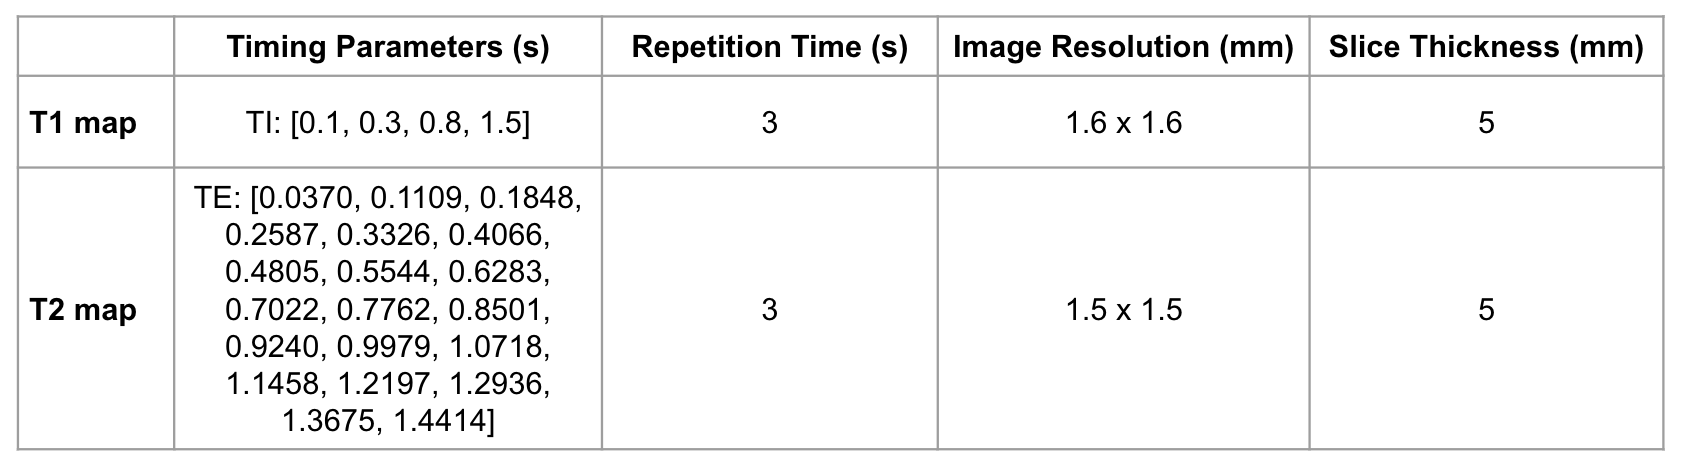
Figure 1: Sequence scan parameters for T1 and T2 maps acquired on the Hyperfine system. For T1, four inversion times (TI) were used. For T2, 20 echo times (TE) were used.
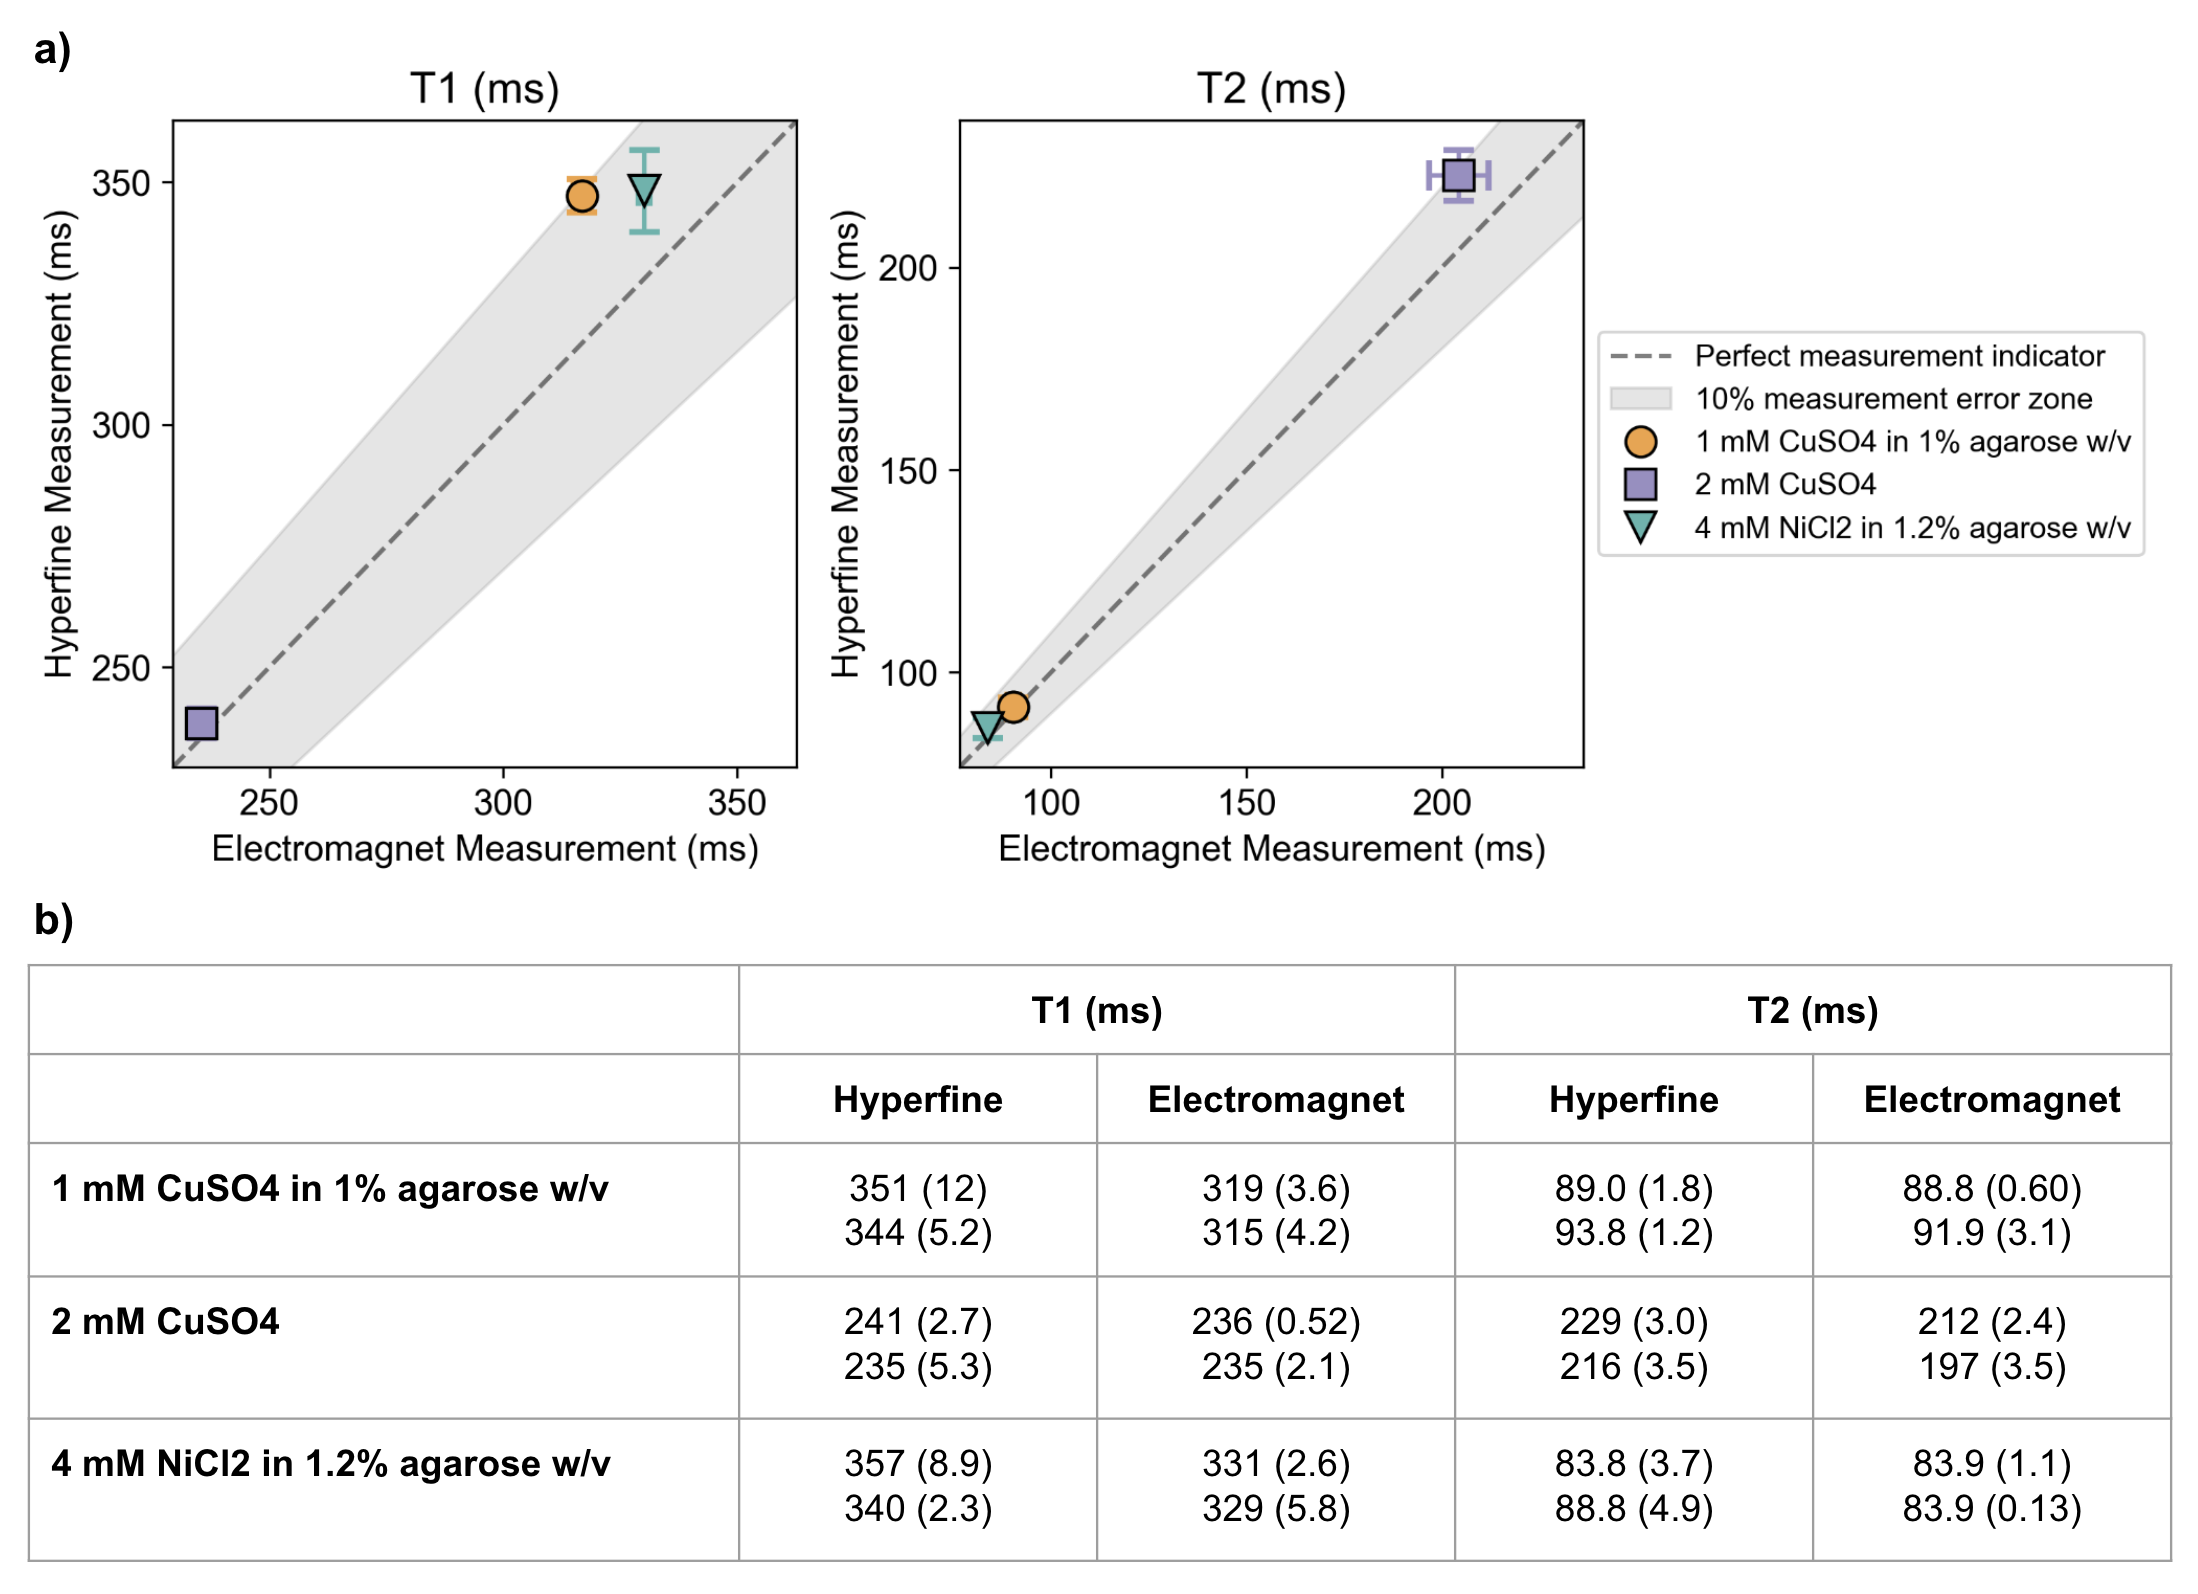
Figure 2: a) Mean values of repeat T1 and T2 measurements for three validation samples on two different systems (electromagnet and Hyperfine), both at 0.064T. Error bars indicate spread in measurements for each sample, for each system (if error bars are not visible, the spread is small). The dashed line indicates perfect equality of the systems, and the grey shaded area indicates 10% difference between the systems. b) Repeat T1 and T2 mean (and SD) for all measurements on both systems.
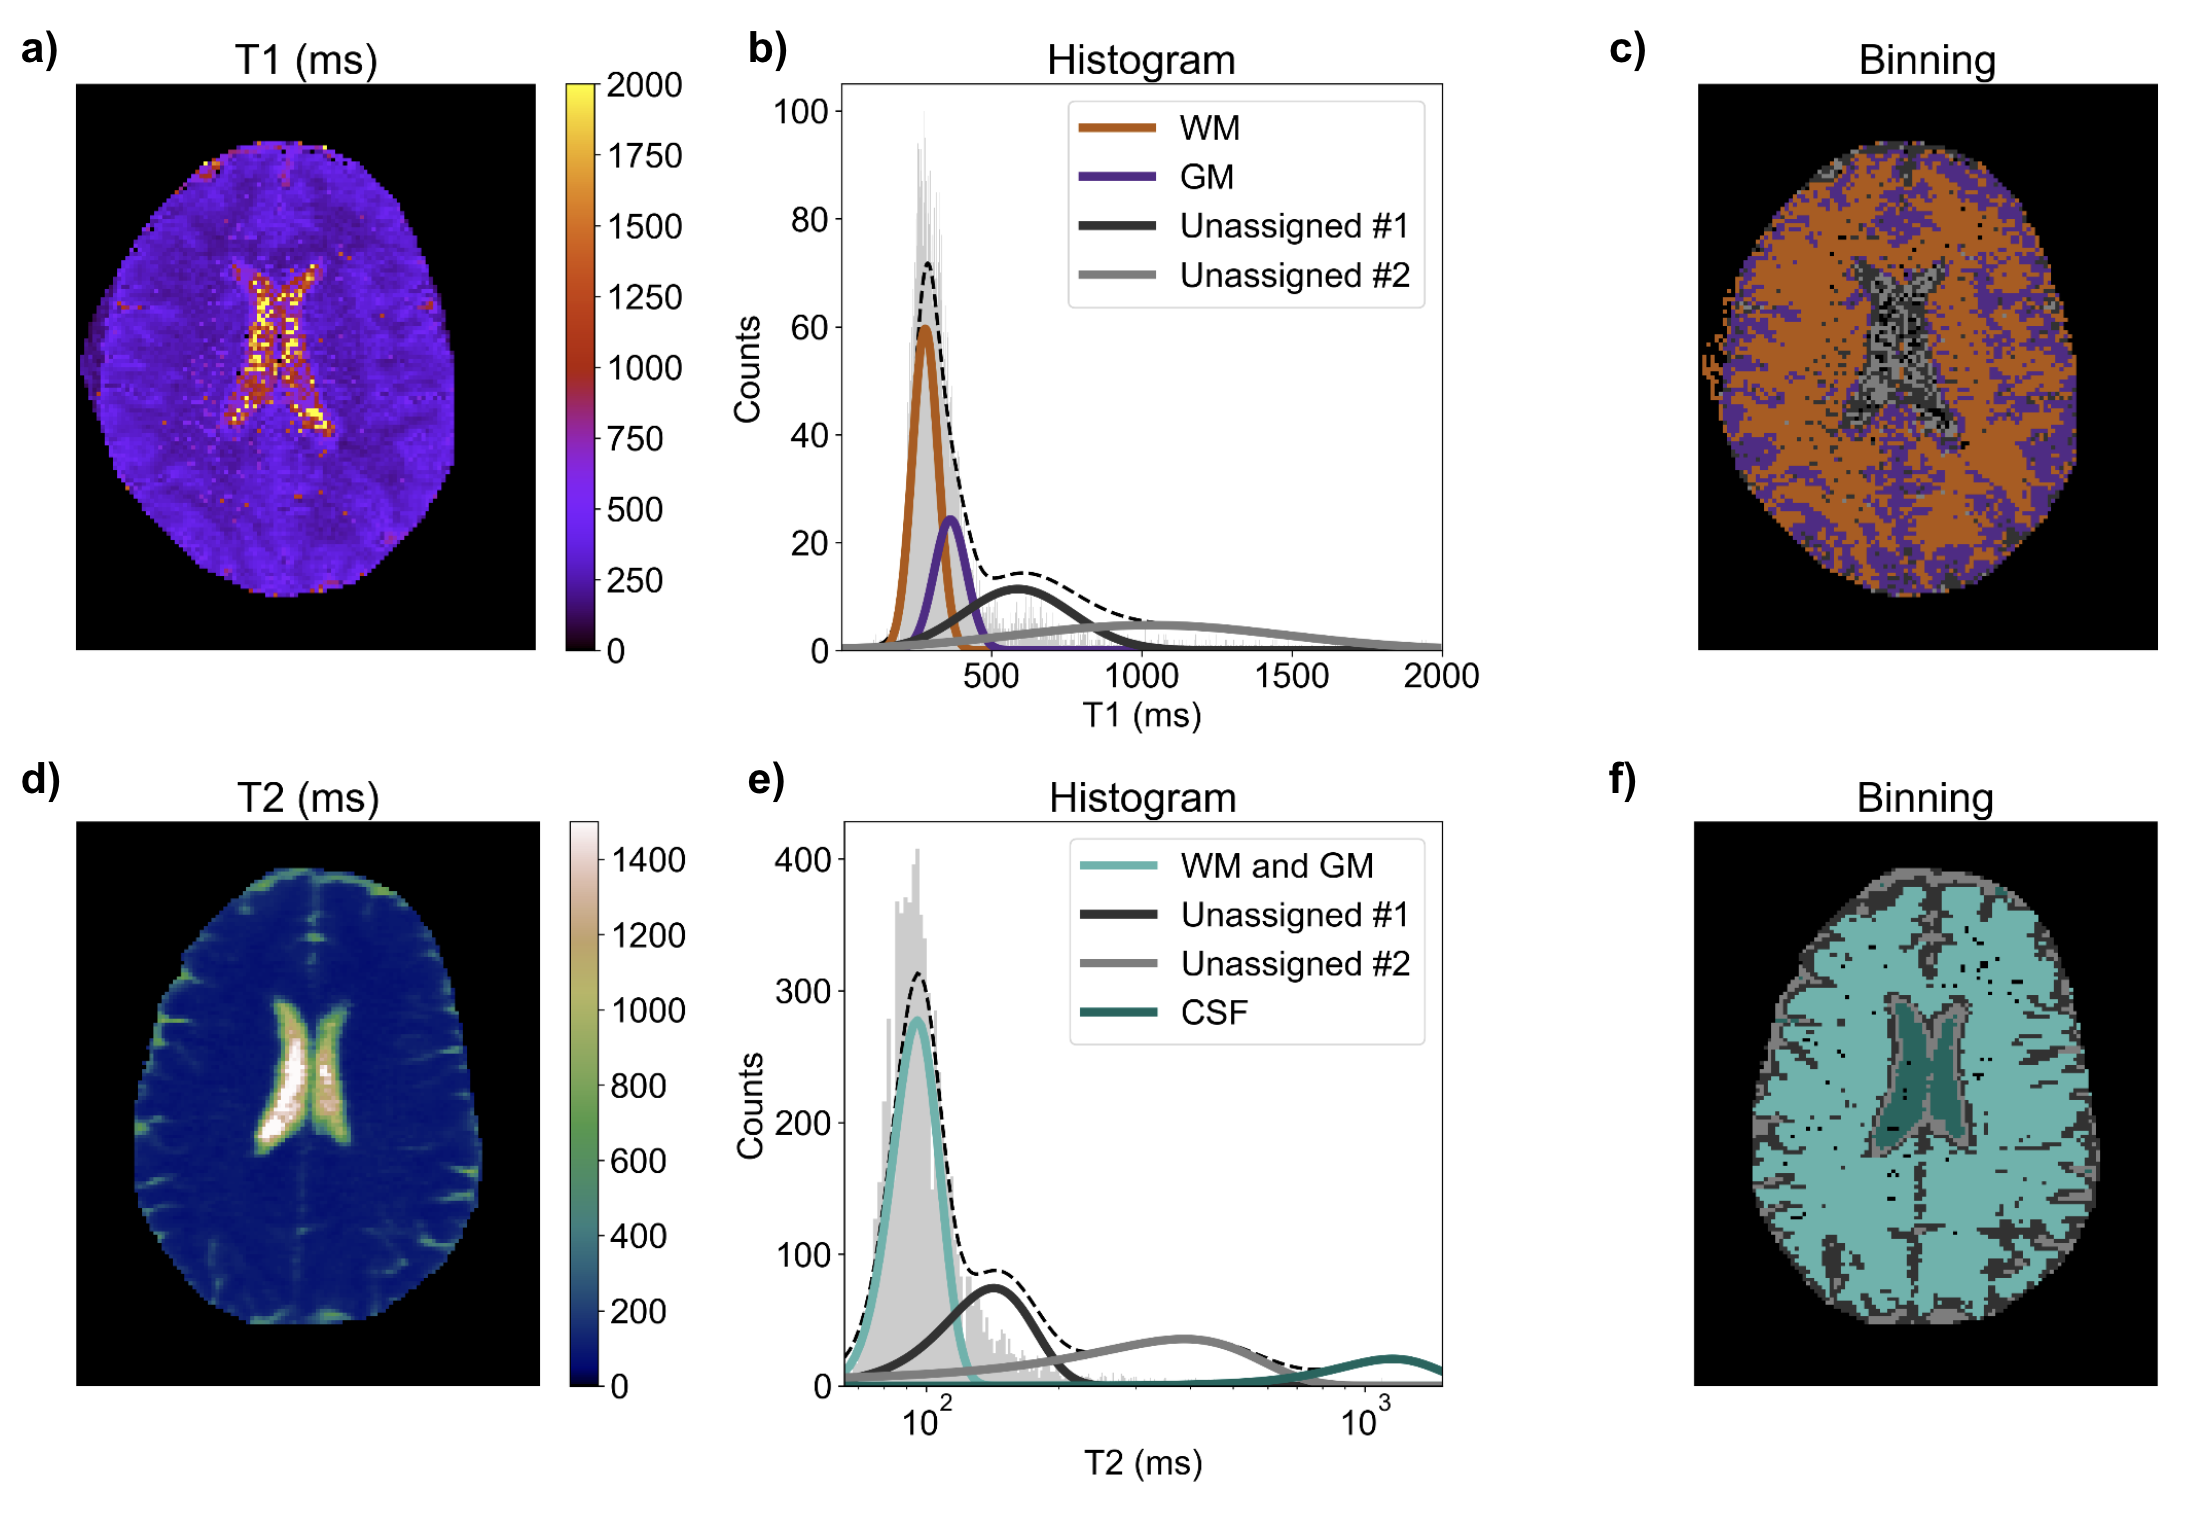
Figure 3: a-c) Example in vivo T1 measurement. a) T1 map; b) T1 histogram with Gaussian fits (representing WM, GM, and two unassigned fits); c) map of binned T1 values using (b) to determine tissue binning per voxel. d-f) Example in vivo T2 measurement. d) T2 map; e) T2 histogram with Gaussian fits (representing combined WM/GM, CSF, and two unassigned fits); f) map of binned T2 values using (e) to determine tissue binning per voxel.
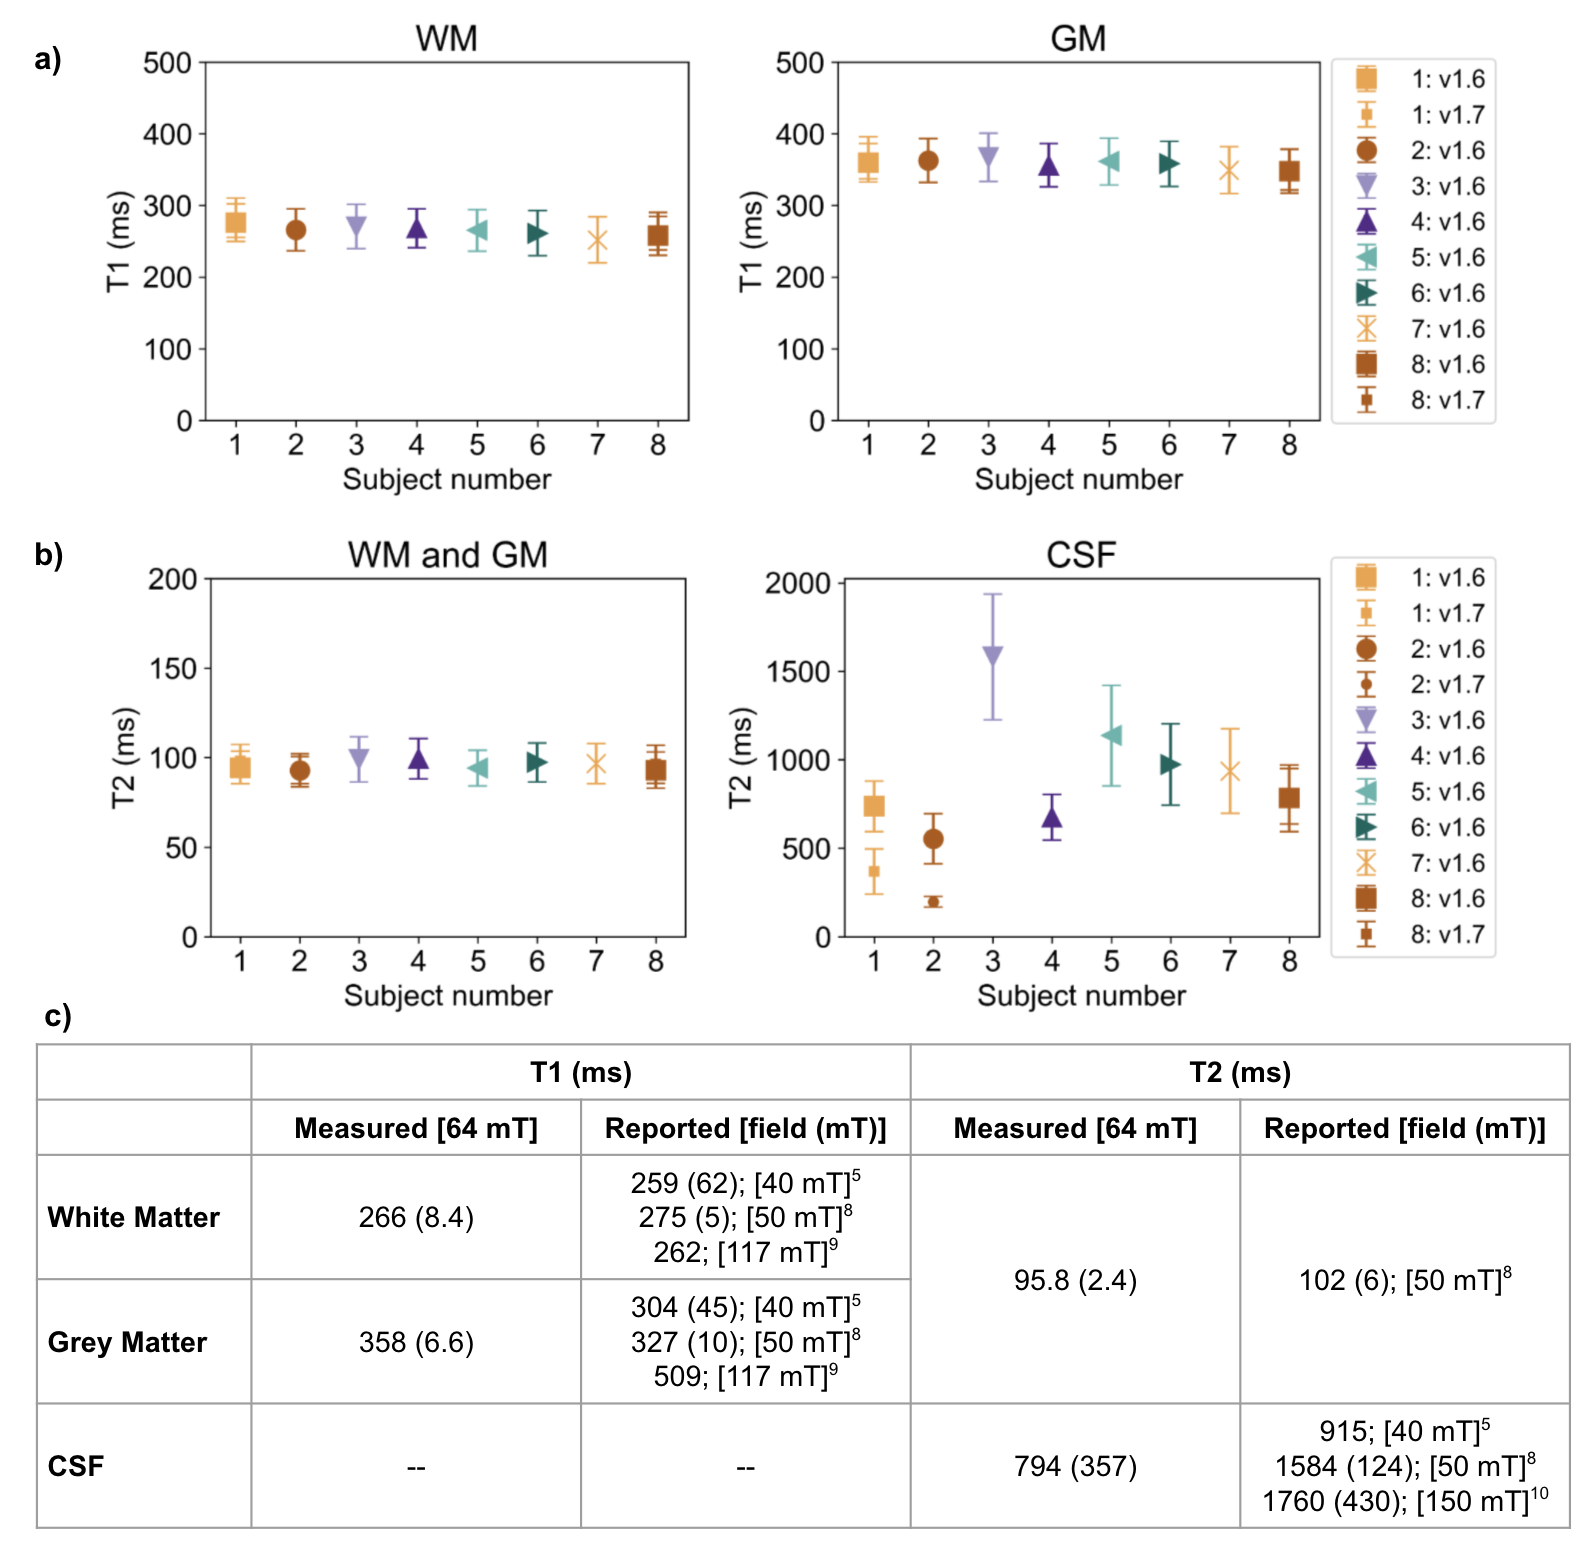
Figure 4: a-b) Mean and SD (error bars) of in vivo T1 (a) and T2 (b) measurements, for each tissue and volunteer. The key indicates whether the volunteer was scanned on v1.6 or v1.7 Hyperfine hardware; or in three cases on both v1.6 and v1.7. c) Overall mean (and SD) of T1 and T2 measurements for all in vivo measurements. Additionally, reported values in literature at similar field strengths are shown for each tissue. Similarly to previous work at low-field8, WM and GM are grouped for T2.
DOI: https://doi.org/10.58530/2022/1814