1813
In Vivo T1 Mapping of Neonatal Brain Tissue at 64mT
Francesco Padormo1,2, Paul Cawley1, Louise Dillon1, Emer Hughes1, Jennifer Almalbis1, Joanna Robinson1, Alessandra Maggioni1, Daniel Cromb1, Anthony Price1, UNITY Consortium3, Lori Arlinghaus4, Houchun Harry Hu4, Steve Williams3, Shaihan Malik1, Serena Counsell1, Mary Rutherford1, Tomoki Arichi1, A. David Edwards1, and Joseph V. Hajnal1
1Centre for the Developing Brain, King's College London, London, United Kingdom, 2Medical Physics, Guy's & St Thomas' NHS Foundation Trust, London, United Kingdom, 3Centre for Neuroimaging Sciences, King's College London, London, United Kingdom, 4Hyperfine Inc., Guildford, CT, United States
1Centre for the Developing Brain, King's College London, London, United Kingdom, 2Medical Physics, Guy's & St Thomas' NHS Foundation Trust, London, United Kingdom, 3Centre for Neuroimaging Sciences, King's College London, London, United Kingdom, 4Hyperfine Inc., Guildford, CT, United States
Synopsis
A promising application of ultra-low field portable MRI is neonatal imaging. In this work we show that neonatal brain T1 mapping is viable at 64mT utilising the Hyperfine Swoop portable MRI system.
Introduction
Ultra-low field (ULF) point-of-care MRI systems enable image acquisition in settings previously out-of-reach for conventional scanners. Neonatal clinical care is an important application, as portable systems will allow imaging on Neonatal Intensive Care Units as well as in low to middle income countries with restricted MRI access. However, neonatal brain tissue properties are significantly different from older subjects, and T1 in particular is strongly field dependent. Whilst T1 mapping has been performed in neonates at high field [1,2], studies estimating the neonatal brain tissue T1 at lower fields have been limited to ex vivo tissue samples [3]. In this work we perform in vivo neonatal brain T1 mapping at 64mT utilising the Hyperfine Swoop® portable MRI system.Methods
Eight neonates (mean post-menstrual age: 39+6, 4 clinically referred, 4 healthy controls) were scanned as part of two NHS UK REC approved studies (12/LO/1247, 19/LO/1384). The scanning protocol comprised a pre-scan calibration, localiser, and multiple inversion-recovery 3D turbo spin echo (TSE) acquisitions with the following sequence parameters: TR = 1.5s, TE = 4.62ms, scan time = 3m32s, FOV = 180x220x180mm (RLxAPxFH), res = 2.8mm isotropic, turbo factor (NTF) = 48, echo spacing (τ) = 4.62ms, BW = 64kHz, TI = 100ms to 600ms in steps of 100ms, with additional data at 700ms and 800ms in 3 subjects.Data was exported in DICOM format and processed using Matlab (The Mathworks, Natick MA, USA). No image registration was performed prior to fitting. A cost function penalising the squared error between the data and the predicted signal, S(TI), (equation below; M0 = fully relaxed magnetisation) was minimised using the lsqnonlin routine.
$$S(TI) = M_0\left|1-2e^{-\frac{TI}{T_1}}+e^{-\frac{TR-\left(N_{TF}-0.5\right)\tau}{T_1}}\right|$$
Regions of interest (ROI) measuring 3x3x3 voxels were drawn in the deep grey matter, cortical grey matter, frontal white matter and occipital white matter to obtain per subject average values and capture variations.
Results
Figure 1 shows data from one subject. Fig. 1A shows the four axial slices containing the selected regions of interest for all inversion times, with the centre of the ROIs marked. Figs. 1B and 1C show M0 and T1 maps for the same slices. Figs. 1D-G show the raw data and fit for the centre pixel of each selected ROI, with error bars showing the standard deviation of signals in the full ROI. Figure 2 shows the T1 maps for all subjects ordered by post-menstrual age at scan in weeks. Figure 3 shows the T1 values plotted against post-menstrual age, showing trends that are consistent with prior relaxometry studies at higher field [2] despite the limited data currently available. Taking the mean ± standard deviations across all subjects, the T1 values were 510ms ± 114ms (deep grey matter), 587 ± 112ms (cortical grey matter), 949 ± 302ms (frontal white matter), 772 ± 217ms (occipital white matter).Discussion
The results show that T1 mapping in neonates is viable at 64mT. Our white matter results differ significantly from the ex vivo results reported by Koenig [3], where T1 was approximately 494ms at 64mT. In vivo neonatal measurements reveal longer T1 values than in adults, as observed in local pilot data and at 50mT [4]. T1 in white matter in some subjects showed large variation, with isolated pixels having very high fitted values. Future work will extend the range of TIs sampled to better measure the longer T1 values in white matter and will enlarge the cohort to better track age-dependent variation. Additionally, we hope to use these methods to optimise T1-weighted structural imaging in this population, as well as to identify pathology and measure brain development.Acknowledgements
We thank Dr Nathan Artz for his input during the initial stages of this project. This work is supported by the Bill and Melinda Gates Foundation and the MRC (Translation Support Award: MR/V036874/1).References
[1] Williams L-A et. al., Radiology (2005) 235:595
[2] Schneider J et. al., AJNR Am J Neuroradiology (2016) 37:155
[3] Koenig S et. al., MRM (1990) 14(3):482
[4]O’Reilly T & Webb A, MRM (2021) 10.1002/mrm.29009
Figures
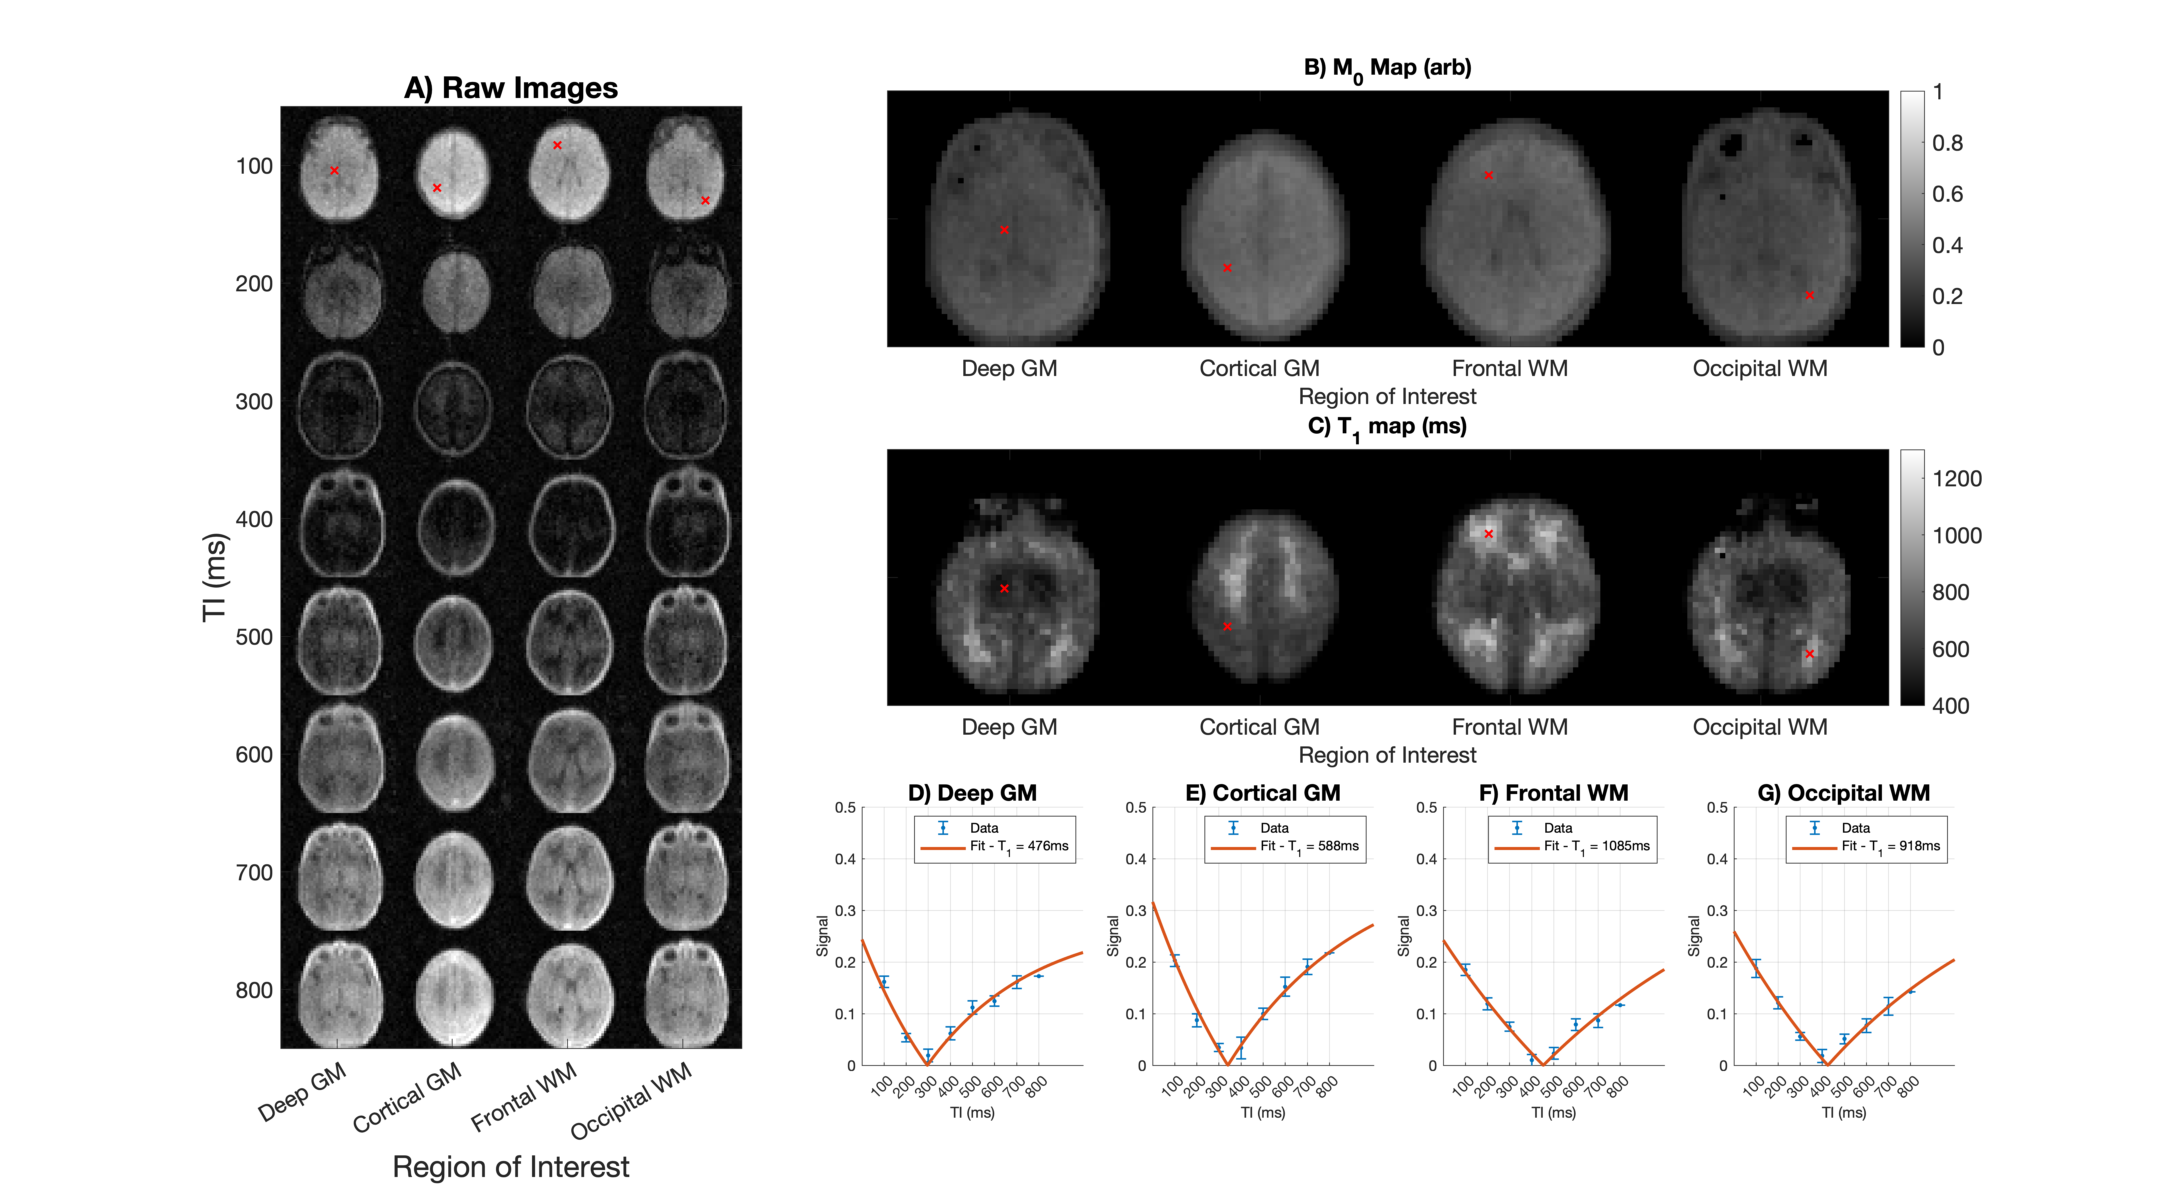
Figure 1 - Example images (A), M0 maps (B), T1 maps (C) and fits (D-G) for slices centred on the four regions of interest in a single subject.
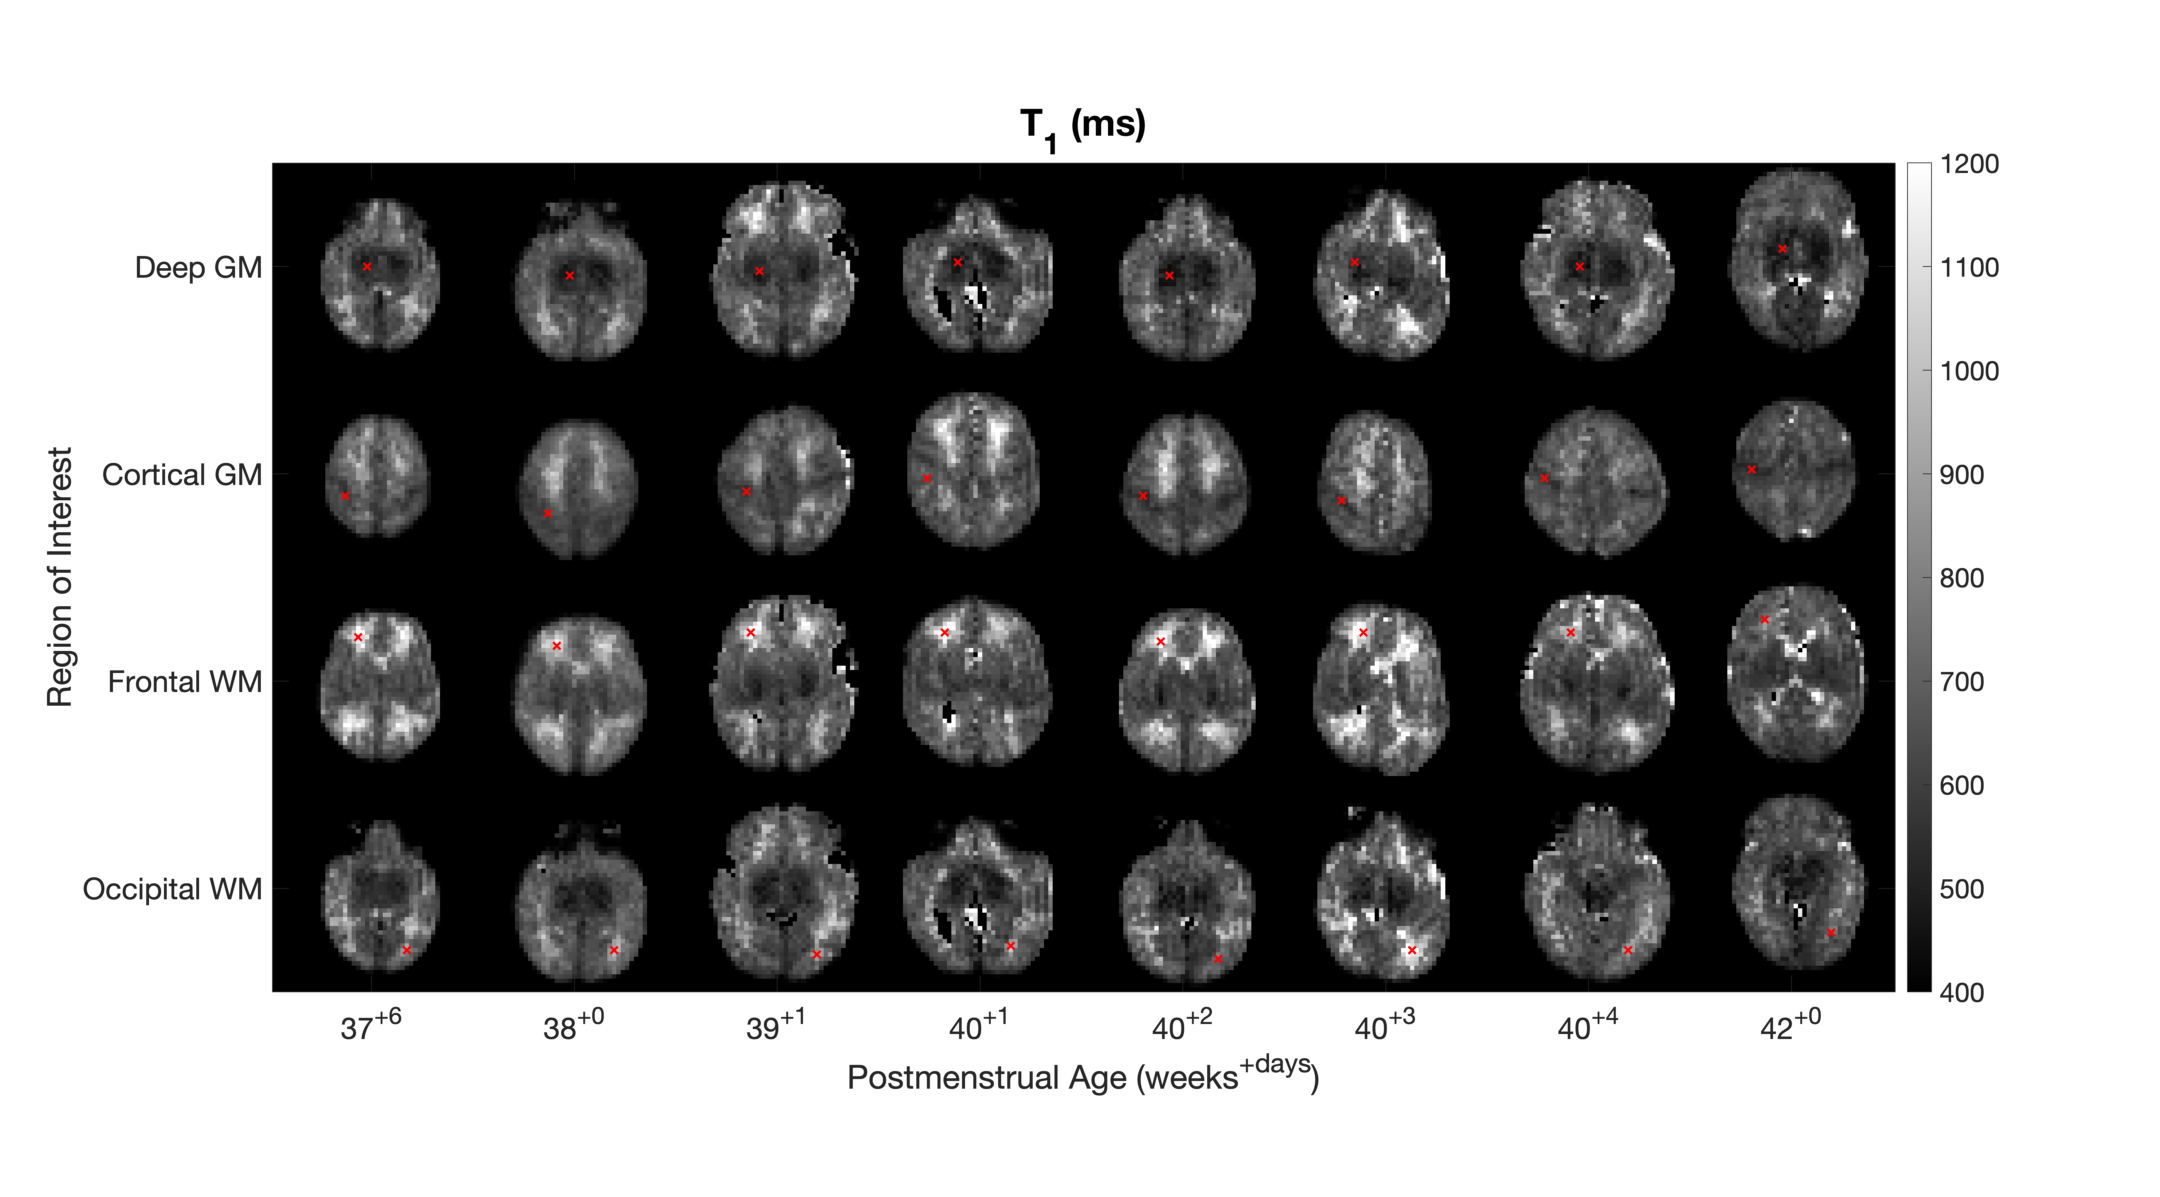
Figure 2 - T1 maps for all subjects. Slices through the centre of each region of interest are displayed.
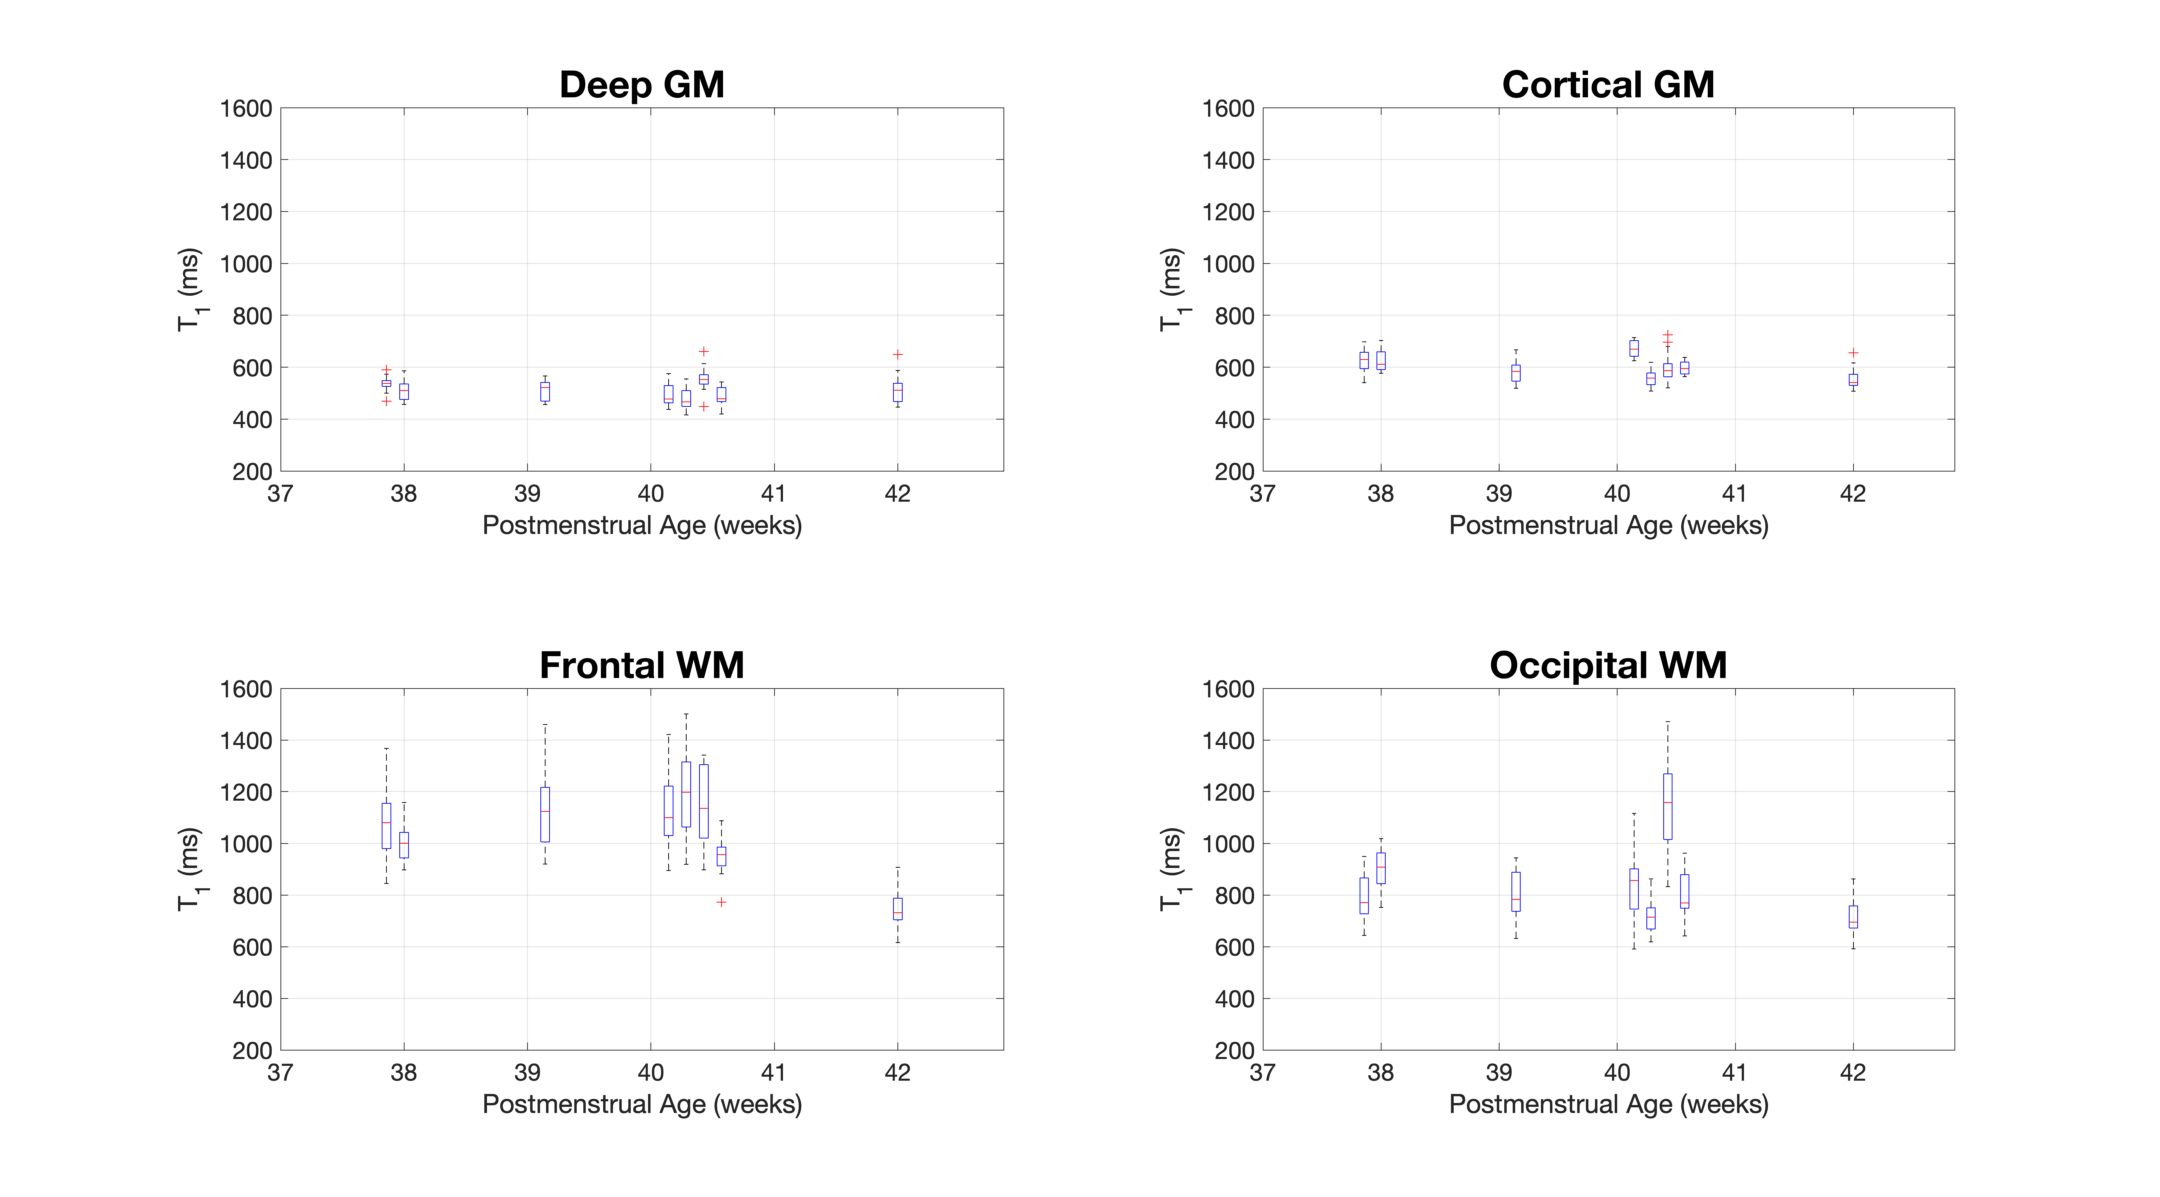
Figure 3 - Box plots showing the measured T1 for all subjects in each region of interest. The central red mark indicates the median, the box indicates the 25th and 75th percentile, the whiskers indicate the extent of the data excluding outliers (red crosses).
DOI: https://doi.org/10.58530/2022/1813