1811
T1 and T2 Mapping of the Infant Brain with a Low-Field, Portable MRI System
Nathan S Artz1, Maura S Sien1, Amie S Robinson1, Houchun H Hu2, Rafael O'Halloran2, Megan Poorman2, and Sherwin S Chan1
1Radiology, Children's Mercy Kansas City, Kansas City, MO, United States, 2Hyperfine, Inc., Guilford, CT, United States
1Radiology, Children's Mercy Kansas City, Kansas City, MO, United States, 2Hyperfine, Inc., Guilford, CT, United States
Synopsis
Low-field, portable MRI offers great potential to improve diagnostic ability in the neonatal intensive care unit. Brain relaxometry will be critical to tune scan parameters at a low magnetic field for infants, whose brain tissue composition is very different than adults. In this study, ten infants were scanned at bedside on a 64mT system. Whole brain T1 and T2 mapping was performed for five infants each. Regions of interest were drawn in the white matter and thalamus for all subjects. Mean T1 and T2 values were 702ms and 294ms for white matter and 364ms and 139ms for the thalamus.
Introduction
Hyperfine Inc. recently introduced an FDA 510k cleared low-field MRI system that is portable. Extending this bedside technology to infants in the neonatal intensive care unit (NICU) could aid in diagnosing pathologies such as hypoxic ischemic injury and hemorrhage. Infant brains are unique with higher water content that decreases over time and white matter (WM) initially containing very little myelin. The ultimate goal of this work is to optimize neuro MR acquisition parameters for infants at 64mT, as done previously at higher field strengths.1 To enable parameter optimization, this study first aims to quantify T1 and T2 values for gray and white matter in infants.Methods
A total of ten infants were recruited for this IRB approved HIPAA compliant study. Following consent, brain MRI was performed at bedside in the NICU using a 510k cleared 64mT Swoop scanner (Hyperfine; Guilford, CT) with sequences modified for this study. Non-sedated infants were provided ear protection, swaddled, placed into an infant cradle prototype, and then positioned within an eight-channel, transmit/receive head coil. A radiologist confirmed normal brain appearance for eight of ten subjects who received standard-of-care imaging. No neurological symptoms were reported in progress notes or discharge summaries for the remaining two subjects.T1 mapping scans were performed on five infants with average age of 7.2 weeks (range: 0.4 to 14.6 weeks) and average corrected age (weeks old - weeks premature) of -0.7 weeks (range: -6.1 to 0.9). A T2 mapping scan was performed on the remaining five subjects (average age=5.1, range: 2 to 8.9 weeks; corrected age=2.8, range: -1.4 to 8.9 weeks).
T1 Quantification: Inversion-recovery 3D fast spin-echo (FSE) sequences were acquired at five inversion times (TI = 600, 700, 850, 1000, 1150 ms) with parameters: Axial, FOV=16x16x18cm3, matrix=100x100x28, TR/TE=1.5s/5.4ms, ETL=28, echo spacing=5.4ms, TE_last=28*5.4ms=151.2ms, receiver BW=640 Hz/pixel, scan time 2:47min. Co-registration was not performed for the different image series. Voxel-by-voxel T1 mapping was performed across all slices using a non-linear least squares fitting algorithm (lsqnonlin in Matlab) to estimate M0 and T1 using an inversion recovery signal model that accounts for a FSE readout: $$Signal=M_{0}\left[1-2e^{\frac{-TI}{T1}}+e^{\frac{-\left(TR-TE_{last}\right)}{T1}}\right]$$
For each subject, T1 regions of interest (ROIs) were drawn on the TI=700ms source images and then applied to the same slice on the corresponding T1 map. White matter ROIs were drawn on a single slice in which WM areas were easily visible, and gray matter ROIs were drawn in the thalamus on a single slice level with the third ventricle. Pixels within all ROIs of a given tissue were averaged together.
T2 Quantification: A multi-echo 3D FSE was acquired with five echo times (TE=6, 105, 203, 302, 400ms) with parameters: Axial, FOV=22x18x18cm3, matrix=146x120x36, TR=2.2s, ETL=16, echo spacing=6.16ms, receiver BW=438 Hz/pixel, scan time 7min. Using the same fitting methods described above for T1 mapping, T2 maps were determined using the standard T2 decay equation: $$$Signal = M_{0}e^{-TE/TR}$$$. Also similar to T1 methods above, mean WM and thalamus T2 values were generated for each subject using ROIs drawn on the TE=302ms source images and applied to the same slice on the T2 maps.
WM and thalamus T1 and T2 values were also averaged across subjects.
Results and Discussion
Whole brain relaxation quantification was achieved in infants at 64 mT using ~14min of scan time for T1 mapping and 7min for T2 mapping. Examples of T1 and T2 maps are shown for select slices in Figures 1 and 2, respectively. The T1 maps are coarser as they were acquired with lower spatial resolution to reduce total scan time, although minor intra-subject motion between five back-to-back IR scans is also a likely contributor.Table 1 lists T1 and T2 values for WM and the thalamus for each subject. Mean T1 and T2 values were 702ms and 294ms for WM and 364ms and 139ms for the thalamus. As expected for a lower field strength, these T1 values are much shorter than those measured at 1.5T in neonates by Jones et al.1 (T1: WM=1,712ms, thalamus=1,116ms), and the T2 values are shorter as well (T2: WM=394ms, thalamus=191ms). This study and Jones et al. demonstrate that white matter has longer T1 and T2 than gray matter in infants; the reverse is true in adults. Neither T1 nor T2 of cortical gray matter was able to be measured due to insufficient spatial resolution.
The low number of infants in this preliminary study is a limitation. Data from many more infants will be necessary to better characterize brain T1 and T2 values because both water content and myelination can change significantly in early months.
Conclusion
Whole brain T1 and T2 mapping in infants was achieved at 64mT. WM and thalamus relaxation values at this low field strength were lower than values reported at high field strength. To our knowledge, this is the first T1 and T2 quantification study in infant brains at this field strength. Additional subjects will be needed for a more robust assessment that would enable optimization of scan parameters for infants at 64mT.Acknowledgements
Research support from Hyperfine, Inc.References
1. Jones R, Palasis S, Grattan-Smith J. MRI of the Neonatal Brain: Optimization of Spin-Echo Parameters. AJR. 2004;182:367-372.Figures
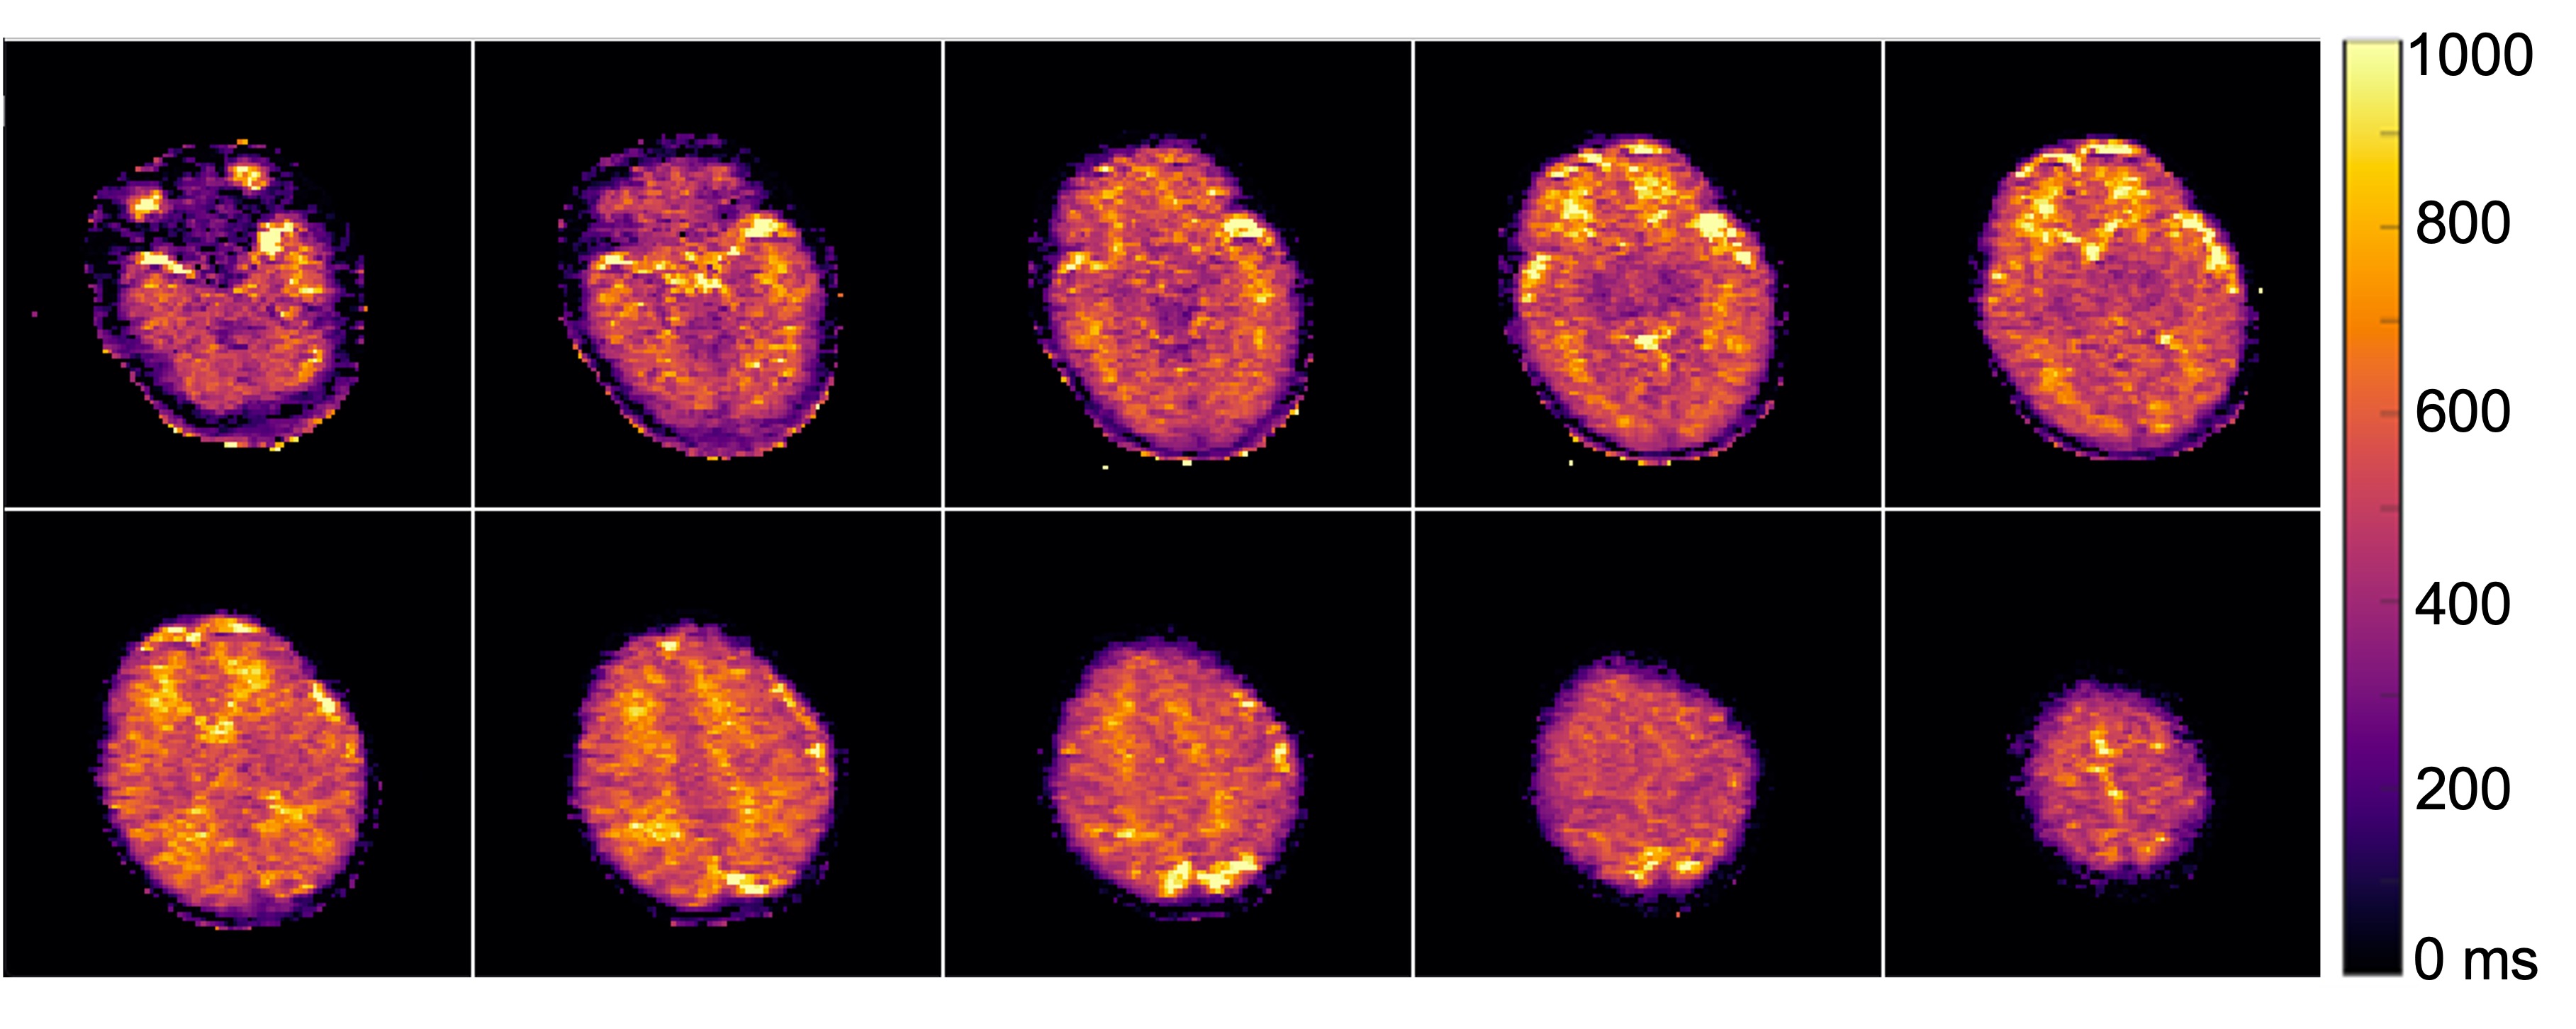
Figure 1 Whole brain T1 mapping was feasible using 3D FSE data from five scans acquired in ~14 min. Select slices are displayed here for neonate subject 3 (corrected age -6.1 weeks).
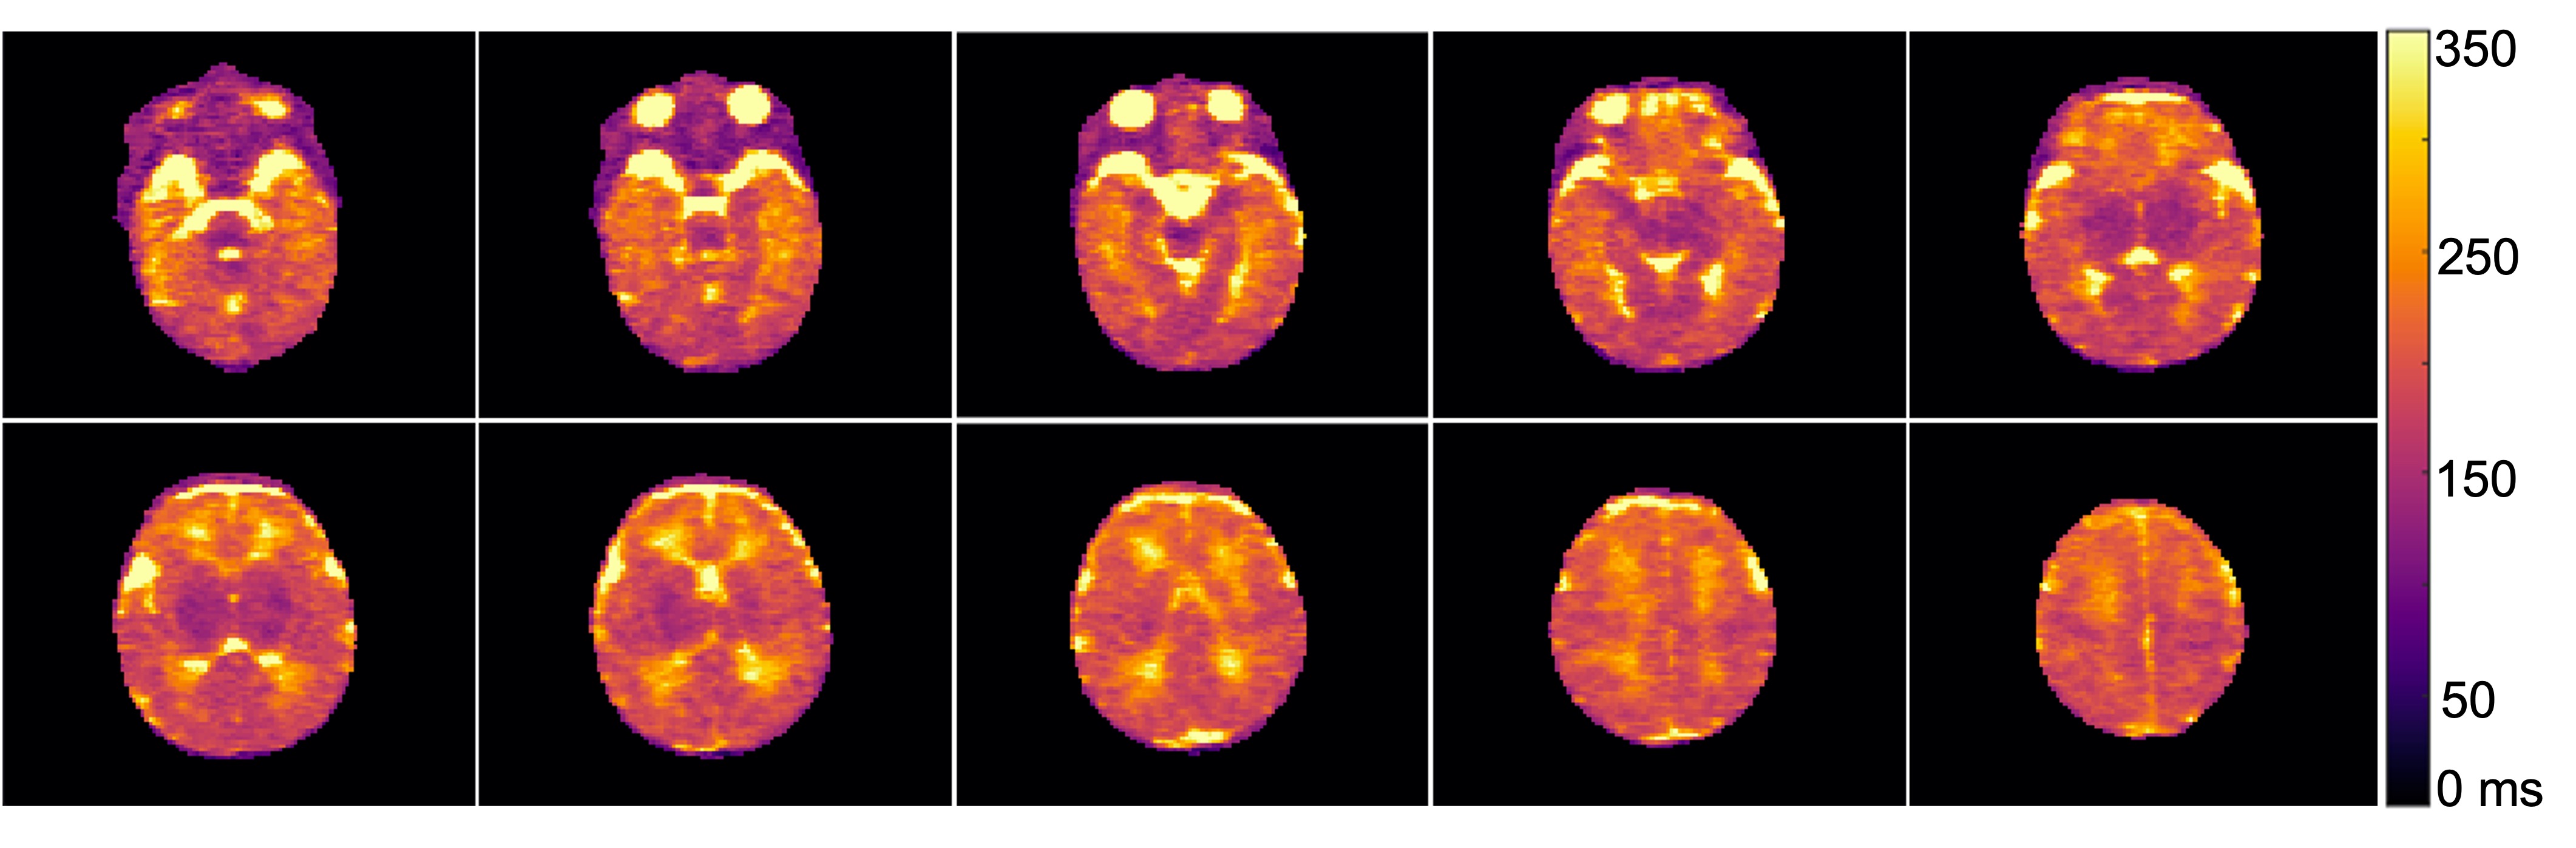
Figure 2 Whole brain T2 maps were achieved using a 7 min, multi-echo 3D FSE scan. T2 maps across several slices are shown for neonate subject 6 (corrected age -1.3 weeks).
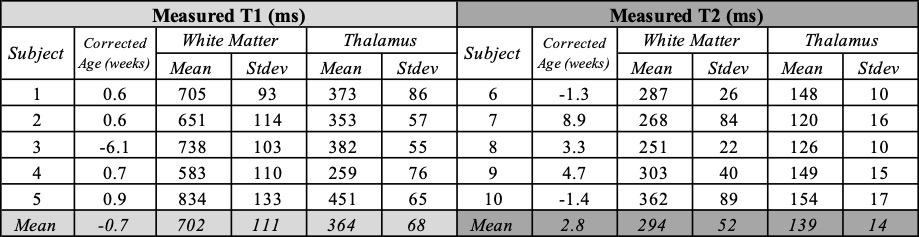
Table 1 Measured T1 and T2 values for infant white matter and thalamus tissues at 64 mT.
DOI: https://doi.org/10.58530/2022/1811