1810
Initial Evaluation of Neuroimaging at 0.55T1Department of Radiology, University of Michigan, Ann Arbor, MI, United States, 2Siemens Medical Solutions USA Inc., Houston, TX, United States
Synopsis
The purpose of this study was to determine which sequences can be immediately deployed for brain and spine imaging on a low-field 0.55T MRI system, with the goal of generating optimized protocols which can be used at other sites for routine clinical neuroimaging. The image quality of 174 brain and spine images was rated by two neuroradiologists. Almost all brain (T1w, T2w, FLAIR, DWI, MRA) and spine (T1w, T2w, DIXON) sequences received image quality scores corresponding to acceptable diagnostic image quality. These sequences form numerous neurological MRI protocols, which based on these results could be collected at 0.55T.
Introduction
The goal of this work is to assess the image quality of a wide range of routine neuroimaging sequences on a recently FDA-approved 0.55T MRI system to inform clinical protocol development. Low-field MRI systems are increasingly being examined for their potential for low-cost imaging and opportunities for improved image quality1,2. At low field strengths, susceptibility artifacts due to metallic implants and air-tissue interfaces are reduced, which may be valuable in neuroimaging applications. Previous work on low-field MRI systems has shown the feasibility of imaging the brain2,3 at 0.55T and the lumbar spine4 at 0.55T and 0.25T; specific neuroimaging protocols including MR Fingerprinting5 and fMRI6, and portable head-only scanners7 have also been explored. However, this novel whole body 0.55T system, with lower gradient strength, larger bore size, and limited receiver coils, has not yet been assessed for routine brain and spine imaging. Thus, the purpose of this study was to determine which sequences can be immediately deployed for brain and spine imaging on this MRI system, with the ultimate goal of generating optimized protocols which can be rolled out to other sites for routine clinical neuroimaging.Methods
Non-contrast brain and spine images were acquired in an IRB approved study on an FDA approved 0.55T MRI system (Free.Max, Siemens Healthineers, Erlangen, Germany). In total, 174 image volumes from 16 healthy volunteers were acquired using T1w, T2w, FLAIR, diffusion, Susceptibility Weighted Imaging (SWI), Dixon, and time-of-flight angiography sequences. Details on image volumes are shown in Figure 1. All images were rated by two neuroradiologists according to the image features and corresponding Likert scales shown in Figure 2. Image volumes were divided into brain and spine categories, and then further divided into the following sequence types: Angiography, Diffusion, Dixon, FLAIR, SWI, T1W, and T2W. For each category of image sequences, the mean and standard deviation of scores and the fraction of images rated to be of diagnostic quality (≥2) were calculated for each feature and each rater. To determine inter-rater agreement, the linear-weighted Cohen’s Kappa coefficient was calculated using all scored features for all images.Results
Image quality ratings for brain and spine images (Figure 3) show that is possible to perform high-quality neuroimaging exams on this 0.55T MRI system. In the brain, all sequence types except SWI had average ratings >2 for all features. In total, for 26 of the 38 features rated, at least 90% of the images were rated as “diagnostic quality images” (rating≥2). In the spine, T1W, T2W, and Dixon images had average ratings >2 for all features. In total, for 25 of the 30 features rated, at least 90% of the images were rated as “diagnostic quality images” (rating≥2). Several sequences, including brain SWI, spine angiography, and spine diffusion had lower average overall image quality ratings (average of both readers = 2.2, 1.0, and 2.0, respectively), with a larger fraction of images rated as non-diagnostic. Inter-reader agreement was calculated to be κ = 0.689, with the largest differences occurring in SWI images. Exemplary images are shown in Figure 4, with the sequence parameters listed in Figure 5.Discussion
Lower cost, low-field MR scanners may enable MRI to be accessed by more people around the world; while the whole-body 0.55T system assessed in this work could be used to image any part of the body, it is imperative that commonly run clinical neuroimaging protocols result in diagnostic image quality. Almost all conventionally collected brain (T1w, T2w, FLAIR, DWI, 3D TOF MRA) and spine (T1w, T2w, Dixon) sequences received image quality scores corresponding to acceptable diagnostic image quality. These sequences form the basis of numerous neurological MRI protocols (e.g.: Cervical, Lumbar, and Thoracic Spine; Brain MR Angiography; and Multiple Sclerosis Brain), which based on these results could be collected at 0.55T. Sequences including brain SWI, spine angiography, and spine diffusion, had lower ratings, indicating that further sequence optimization or alternative imaging strategies might be required to enable these images to be routinely collected at 0.55T. With improvements in the SWI sequence, Routine Brain, Brain Tumor, and Brain Metastases protocols could also be implemented on 0.55T. Future research will include an assessment of the diagnostic capabilities of this 0.55T system compared with higher field MRI systems (1.5T and 3T).Conclusion
Diagnostic quality images in the brain and spine can be collected at 0.55T, with opportunities for sequence and protocol optimization in SWI in the brain and angiography and diffusion imaging in the spine.Acknowledgements
Research support from Siemens HealthineersReferences
[1] Marques JP, Simonis FFJ, Webb AG. Low-field MRI: An MR physics perspective. J Magn Reson Imaging. 2019 Jun;49(6):1528-1542. doi: 10.1002/jmri.26637.
[2] Campbell-Washburn AE, Ramasawmy R, Restivo MC, Bhattacharya I, Basar B, Herzka DA, Hansen MS, Rogers T, Bandettini WP, McGuirt DR, Mancini C, Grodzki D, Schneider R, Majeed W, Bhat H, Xue H, Moss J, Malayeri AA, Jones EC, Koretsky AP, Kellman P, Chen MY, Lederman RJ, Balaban RS. Opportunities in Interventional and Diagnostic Imaging by Using High-Performance Low-Field-Strength MRI. Radiology. 2019 Nov;293(2):384-393. doi: 10.1148/radiol.2019190452.
[3] Runge VM, Heverhagen JT. Advocating the Development of Next-Generation, Advanced-Design Low-Field Magnetic Resonance Systems. Invest Radiol. 2020 Dec;55(12):747-753. doi: 10.1097/RLI.0000000000000703. PMID: 33156083.
[4] Hansen BB, Ciochon UM, Trampedach CR, Christensen AF, Rasti Z, Boesen M. Grading lumbar disc degeneration: a comparison between low- and high-field MRI. Acta Radiol. 2019 Dec;60(12):1636-1642. doi: 10.1177/0284185119842472. Epub 2019 Apr 19. PMID: 31003590.
[5] Campbell-Washburn AE, Jiang Y, Körzdörfer G, Nittka M, Griswold MA. Feasibility of MR fingerprinting using a high-performance 0.55 T MRI system. Magn Reson Imaging. 2021 Sep;81:88-93. doi: 10.1016/j.mri.2021.06.002. Epub 2021 Jun 8. PMID: 34116134.
[6] Wang Y, van Gelderen P, de Zwart JA, Campbell-Washburn AE, Duyn JH. FMRI based on transition-band balanced SSFP in comparison with EPI on a high-performance 0.55 T scanner. Magn Reson Med. 2021 Jun;85(6):3196-3210. doi: 10.1002/mrm.28657. Epub 2021 Jan 21. PMID: 33480108; PMCID: PMC7904622.
[7] Mazurek MH, Cahn BA, Yuen MM, Prabhat AM, Chavva IR, Shah JT, Crawford AL, Welch EB, Rothberg J, Sacolick L, Poole M, Wira C, Matouk CC, Ward A, Timario N, Leasure A, Beekman R, Peng TJ, Witsch J, Antonios JP, Falcone GJ, Gobeske KT, Petersen N, Schindler J, Sansing L, Gilmore EJ, Hwang DY, Kim JA, Malhotra A, Sze G, Rosen MS, Kimberly WT, Sheth KN. Portable, bedside, low-field magnetic resonance imaging for evaluation of intracerebral hemorrhage. Nat Commun. 2021 Aug 25;12(1):5119. doi: 10.1038/s41467-021-25441-6.
Figures
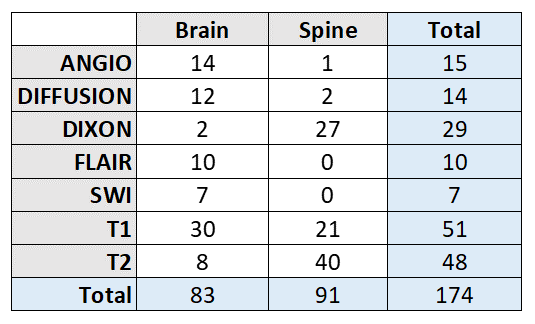
Figure 1: Counts for brain and spine images acquired with different sequence families at 0.55T.
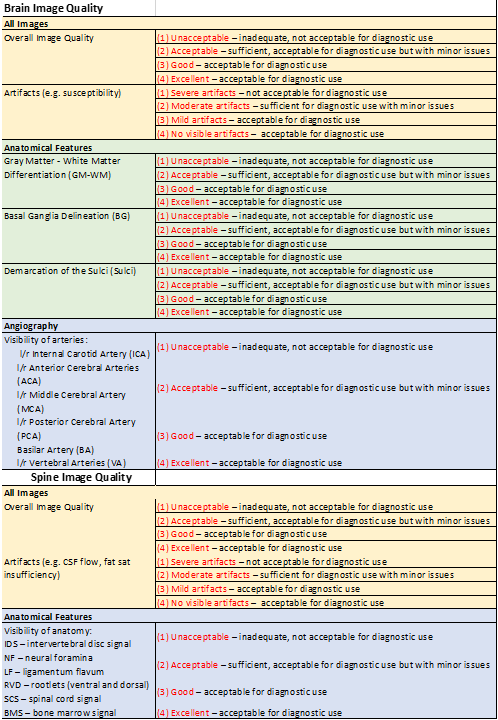
Figure 2: Likert scales used to rate various aspects of image quality in brain and spine images.
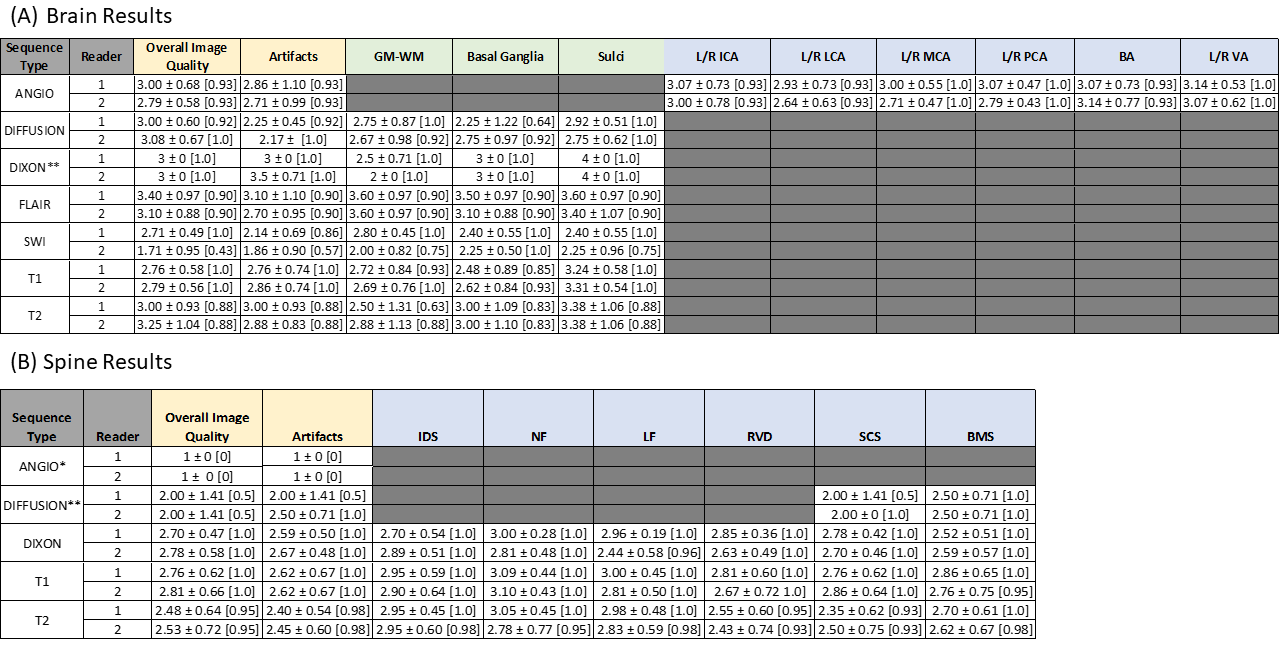
Figure 3: (A) Brain and (B) Spine image ratings, reported as mean ± standard deviation [fraction of images rated ≥2], for each pulse sequence and reader. Shaded boxes indicate that the feature was not applicable for a specific image type, and therefore not rated. *Category consists of only one image volume. **Category consists of only two image volumes.
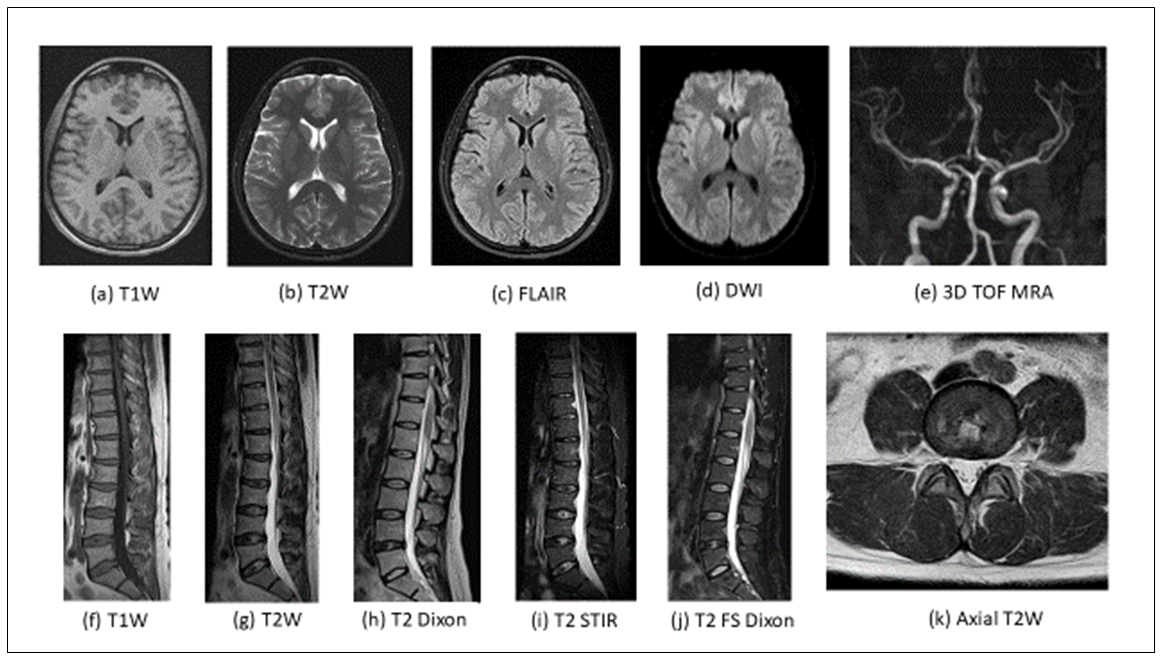
Figure 4: Examples of brain (a-e) and spine (f-k) images acquired at 0.55T.
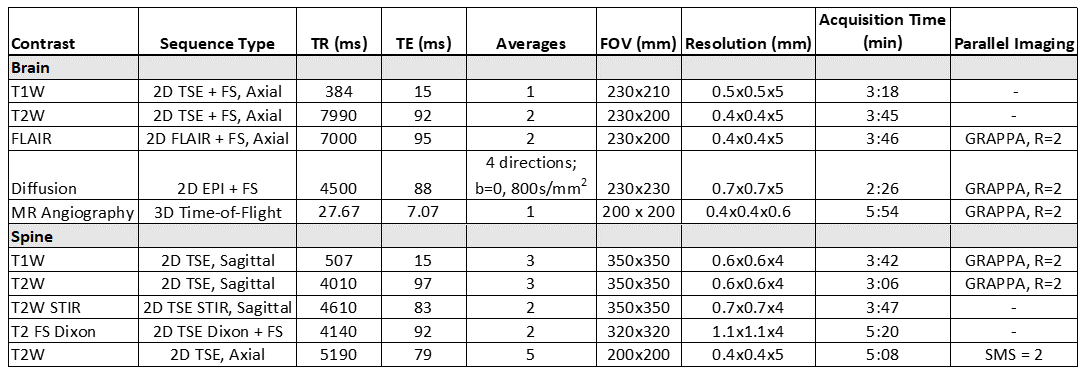
Figure 5: Acquisition parameters for the example images shown in Figure 4.