1807
Free-Breathing Liver Fat Quantification using Radial Acquisition on a High-Performance 0.55T MRI System1Department of Radiological Sciences, University of California Los Angeles, Los Angeles, CA, United States, 2Department of Bioengineering, University of California Los Angeles, Los Angeles, CA, United States, 3Siemens Medical Solutions USA, Inc., Los Angeles, CA, United States, 4Ming Hsieh Department of Electrical and Computer Engineering, University of Southern California, Los Angeles, CA, United States
Synopsis
MRI proton-density fat fraction (PDFF) is used for non-invasive diagnosis of fatty liver disease, and has been validated at 1.5T and 3T field strengths. There is renewed interest in lower field strengths, such as 0.55T, because of potential advantages such as lower hardware/siting costs and a larger bore diameter. This study investigated PDFF quantification at 0.55T and validated PDFF quantification at 0.55T using Cartesian and Radial Dixon techniques in a reference phantom, and demonstrated the feasibility of in vivo free-breathing radial liver PDFF quantification in healthy subjects at 0.55T.
Introduction
MRI proton-density fat fraction (PDFF) is a biomarker for non-invasive diagnosis of fatty liver disease. PDFF quantification using chemical-shift-encoded “Dixon” MRI has been validated at 1.5T and 3T1-3. In addition to conventional PDFF quantification using breath-holding (BH) Cartesian acquisition3, recent work2 has demonstrated that radial techniques for PDFF enable free-breathing (FB) scans with larger volumetric coverage.There is renewed interest in lower field strength MRI (e.g., 0.55T)4-9 because of its potential advantages such as lower hardware/siting costs and a larger bore diameter. These could improve access to MRI for populations with obesity and at risk for fatty liver disease. Previous works have investigated qualitative abdominal imaging7 and iron quantification8 at 0.55T. Three-point Dixon water/fat separation at 0.75T was explored using a spiral sequence with BH acquisition9, but free-breathing PDFF quantification has not been investigated. There are several challenges in adapting Dixon-based PDFF quantification techniques from current clinical field strengths to lower ones. First, the already low image signal-to-noise ratio (SNR) at lower field becomes exacerbated when a small flip angle (FA) is used to reduce T1 bias in PDFF10. Second, the smaller fat/water frequency difference results in longer out-of-phase (TEop=6.47ms) and in-phase (TEin=12.94ms) echo times. This increases scan time and limits parameter choices.
In this work, we investigated Cartesian and Radial Dixon techniques for PDFF quantification at 0.55T, demonstrating accurate PDFF quantification in a reference phantom and feasibility of FB radial liver PDFF quantification in healthy subjects.
Methods
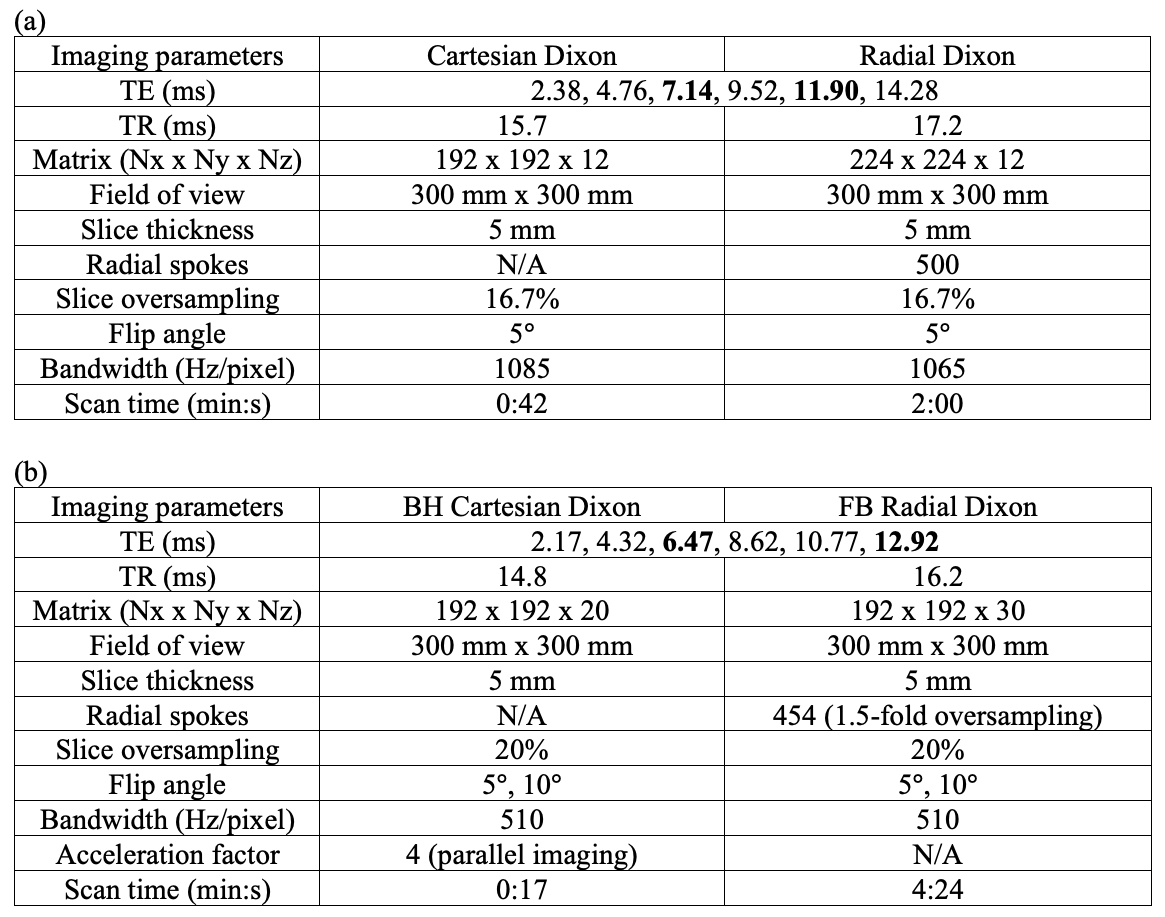
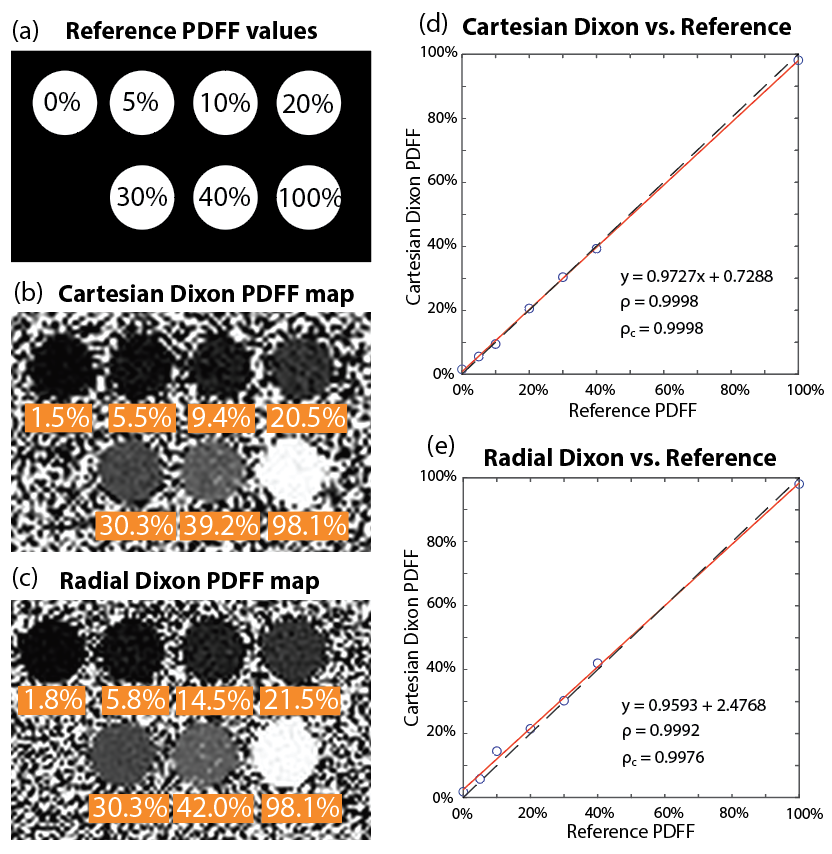
Scanner and Sequences: Experiments were performed using a whole-body 0.55T MRI system (prototype MAGNETOM Aera, Siemens Healthineers, Erlangen, Germany) equipped with high-performance shielded gradients (45 mT/m amplitude, 200 T/m/s slew rate). We used (1) a conventional multi-echo gradient-echo 3D Cartesian sequence (“Cartesian Dixon”)3, and (2) a prototype multi-echo gradient-echo 3D stack-of-radial technique with golden-angle ordering (“Radial Dixon”)2.Phantom Study: We scanned a PDFF phantom (Calimetrix, Madison, WI) with 7 compartments of known PDFF (0%, 5%, 10%, 20%, 30%, 40%, and 100%). Sequence parameters are in Table 1a.
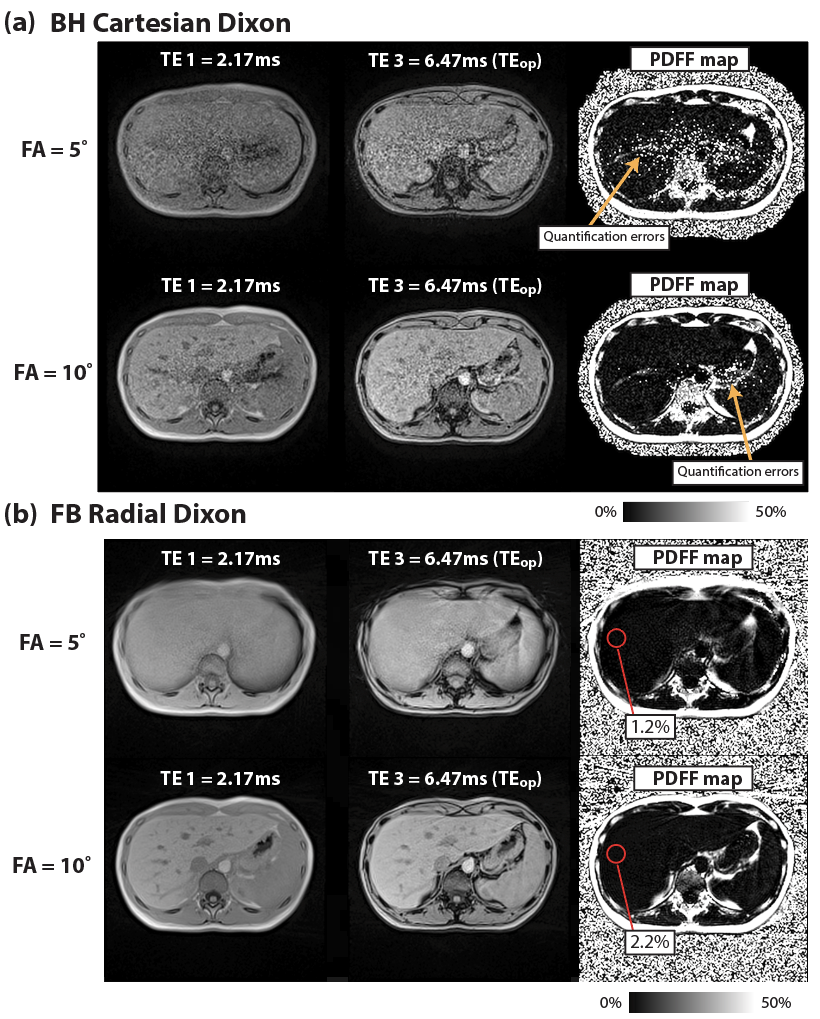
In Vivo Study: 2 healthy subjects were scanned under an IRB-approved protocol, after providing written informed consent. Sequence parameters are in Table 1b. We chose TE1=2.17ms and echo spacing=2.15ms, which achieved TEop=6.47ms and TEin=12.92ms in the 3rd and 6th echoes. FA=5° and FA=10° were tested in both sequences. To reduce BH time in Cartesian Dixon, parallel imaging (acceleration factor R=4) was used.
Fitting Algorithms: The multi-echo images were fitted to a multi-peak fat model with single effective R2* using a multi-step adaptive fitting method3 and a time-domain signal-dephasing fat model11. For phantom experiments, a vendor-provided fat model was used12. This fitting method uses images from in-phase and out-of-phase for initial estimates of fat/water. We chose 2 echo times near TEop=6.47ms and TEin=12.49ms for this initial step.
Analysis: In phantoms, we compared PDFF measurements from Cartesian and Radial Dixon with reference values in regions of interest (ROI). We used Pearson’s correlation coefficients for linear relationship evaluation and used Lin’s concordance coefficient to evaluate agreement with the reference. For in vivo scans, 5-cm2 ROIs were drawn in the liver while avoiding large vessels and mean PDFF values were reported.
Results
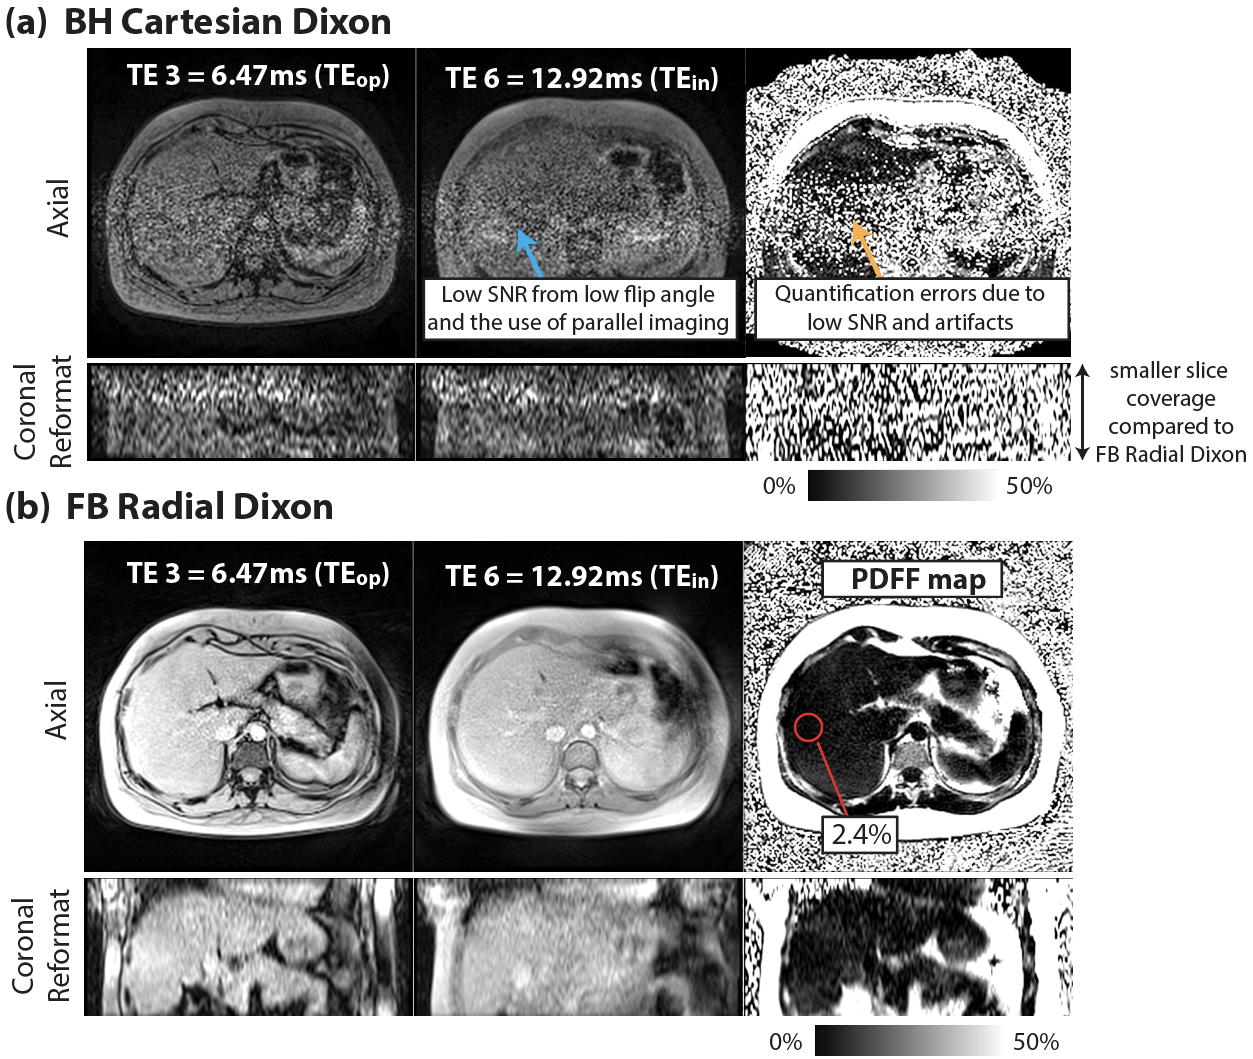
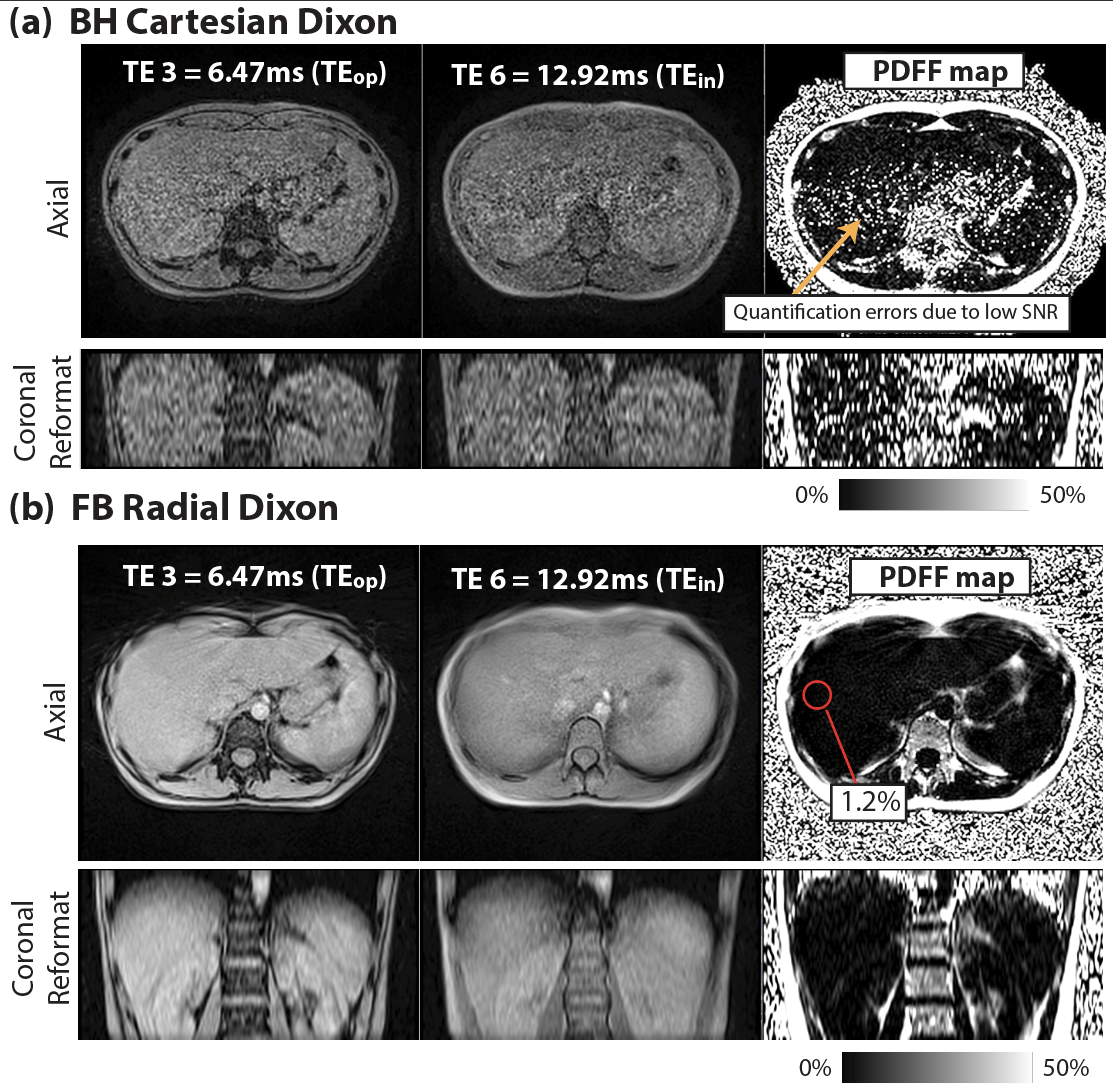
Figure 1 demonstrates close agreement between PDFF measurements from Cartesian and Radial Dixon versus reference with concordance coefficients ρc>0.997. Figures 2 and 3 show results from 2 healthy subjects. Low SNR in BH Cartesian Dixon led to errors in PDFF. FB Radial Dixon achieved larger volumetric coverage and sufficient SNR for PDFF quantification. Figure 4 shows that using FA=10° increased image SNR versus FA=5°. However, BH Cartesian with FA=10° still suffered from low SNR and parallel imaging artifacts that led to errors in PDFF. FB Radial Dixon using FA=10° had slightly increased PDFF compared with FA=5°, potentially due to uncorrected T1 bias.Discussion
Compared with previous studies on abdominal MRI at 0.55T7,8, we demonstrated quantitative fat MRI at 0.55T. The challenge of low SNR at lower field can potentially be mitigated by using non-Cartesian techniques9,13 that are more SNR-efficient and/or enable FB acquisition of more data without BH limitations. FB Radial Dixon at 0.55T can especially benefit patients with a larger body habitus in terms of the larger volumetric coverage and potentially larger bore size.There are some limitations in this work. First, we did not compare all parameter combinations. We chose TEs that at least included the first in-phase and out-of-phase echo times. Using shorter TEs with more robust fitting algorithms may shorten the acquisition time. Second, we observed increased PDFF as FA increased, but the FA choice that balances the trade-off between SNR and T1 bias needs further investigation. Third, the in vivo sample size is small, and did not include the spectrum of clinical PDFF and underlying obesity status. PDFF accuracy in subjects with fatty liver disease will be studied in the future.
Conclusion
We validated PDFF quantification at 0.55T using Cartesian and Radial Dixon techniques. We demonstrated the feasibility of in vivo free-breathing radial liver PDFF quantification at 0.55T.Acknowledgements
We acknowledge grant support from the National Science Foundation (#1828736) and the National Institutes of Health (R01DK124417), and research support from Siemens Medical Solutions USA, Inc.References
1. Artz NS, Haufe WM, Hooker CA, Hamilton G, Wolfson T, Campos GM, Gamst AC, Schwimmer JB, Sirlin CB, Reeder SB. Reproducibility of MR‐based liver fat quantification across field strength: Same‐day comparison between 1.5 T and 3T in obese subjects. Journal of Magnetic Resonance Imaging 2015;42(3):811-817.
2. Armstrong T, Dregely I, Stemmer A, Han F, Natsuaki Y, Sung K, Wu HH. Free‐breathing liver fat quantification using a multiecho 3 D stack‐of‐radial technique. Magnetic Resonance in Medicine 2018;79(1):370-382.
3. Zhong X, Nickel MD, Kannengiesser SA, Dale BM, Kiefer B, Bashir MR. Liver fat quantification using a multi‐step adaptive fitting approach with multi‐echo GRE imaging. Magnetic Resonance in Medicine 2014;72(5):1353-1365.
4. Campbell-Washburn AE, Ramasawmy R, Restivo MC, Bhattacharya I, Basar B, Herzka DA, Hansen MS, Rogers T, Bandettini WP, McGuirt DR. Opportunities in interventional and diagnostic imaging by using high-performance low-field-strength MRI. Radiology 2019;293(2):384-393.
5. Wald LL, McDaniel PC, Witzel T, Stockmann JP, Cooley CZ. Low‐cost and portable MRI. Journal of Magnetic Resonance Imaging 2020;52(3):686-696.
6. Marques JP, Simonis FF, Webb AG. Low‐field MRI: An MR physics perspective. Journal of Magnetic Resonance Imaging 2019;49(6):1528-1542.
7. Chandarana H, Bagga B, Huang C, Dane B, Petrocelli R, Bruno M, Keerthivasan M, Grodzki D, Block KT, Stoffel D. Diagnostic abdominal MR imaging on a prototype low-field 0.55 T scanner operating at two different gradient strengths. Abdominal Radiology 2021:1-9.
8. Campbell‐Washburn AE, Mancini C, Conrey A, Edwards L, Shanbhag S, Wood J, Xue H, Kellman P, Bandettini WP, Thein SL. Evaluation of hepatic iron overload using a contemporary 0.55 T MRI System. Journal of Magnetic Resonance Imaging 2021.
9. Guenthner C, Koken P, Boernert P, Kozerke S. Three-point Dixon abdominal water/fat Separation using a lower-field 0.75T MRI. Proceedings of the 29th Annual Meeting of ISMRM; 2021.
10. Kühn JP, Jahn C, Hernando D, Siegmund W, Hadlich S, Mayerle J, Pfannmöller J, Langner S, Reeder S. T1 bias in chemical shift‐encoded liver fat‐fraction: role of the flip angle. Journal of Magnetic Resonance Imaging 2014;40(4):875-883.
11. Nickel M, Kannengiesser S, Kiefer B. Time-domain calibration of fat signal dephasing from multi-echo STEAM spectroscopy for multi-gradient-echo imaging based fat quantification. Proceedings of the 23rd Annual Meeting of ISMRM, Toronto, Canada; 2015.
12. Hu H, Yokoo T, Hernando D. Multi-site, multi-vendor, and multi-platform reproducibility and accuracy of quantitative proton-density fat fraction (PDFF) at 1.5 and 3 Tesla with a standardized spherical phantom: Preliminary results from a study by the RSNA QIBA PDFF Committee. Proceedings of the 27th Annual Meeting of ISMRM, Montreal, Canada; 2019.
13. Restivo MC, Ramasawmy R, Bandettini WP, Herzka DA, Campbell‐Washburn AE. Efficient spiral in‐out and EPI balanced steady‐state free precession cine imaging using a high‐performance 0.55 T MRI. Magnetic Resonance in Medicine 2020;84(5):2364-2375.
Figures